

Key Points
Clinical multi-omics analysis unveils a core PBX1-FOXM1 regulatory axis underlying high-risk proliferative phenotypes in chr1q-amp myeloma.
Preclinical profiling of a novel PBX1 inhibitor (T417) shows selective potency and supports its use against chr1q-amp myeloma.

Abstract
Understanding the biological and clinical impact of copy number aberrations (CNAs) on the development of precision therapies in cancer remains an unmet challenge. Genetic amplification of chromosome 1q (chr1q-amp) is a major CNA conferring an adverse prognosis in several types of cancer, including in the blood cancer multiple myeloma (MM). Although several genes across chromosome 1 (chr1q) portend high-risk MM disease, the underpinning molecular etiology remains elusive. Here, with reference to the 3-dimensional (3D) chromatin structure, we integrate multi-omics data sets from patients with MM with genetic variables to obtain an associated clinical risk map across chr1q and to identify 103 adverse prognosis genes in chr1q-amp MM. Prominent among these genes, the transcription factor PBX1 is ectopically expressed by genetic amplification and epigenetic activation of its own preserved 3D regulatory domain. By binding to reprogrammed superenhancers, PBX1 directly regulates critical oncogenic pathways and a FOXM1-dependent transcriptional program. Together, PBX1 and FOXM1 activate a proliferative gene signature that predicts adverse prognosis across multiple types of cancer. Notably, pharmacological disruption of the PBX1-FOXM1 axis with existing agents (thiostrepton) and a novel PBX1 small molecule inhibitor (T417) is selectively toxic against chr1q-amp myeloma and solid tumor cells. Overall, our systems medicine approach successfully identifies CNA-driven oncogenic circuitries, links them to clinical phenotypes, and proposes novel CNA-targeted therapy strategies in MM and other types of cancer.
Introduction
Genetic amplification of chromosome 1q (chr1q-amp), one of the most frequent copy number aberrations (CNAs), confers an adverse prognosis in cancer.1,-3 In multiple myeloma (MM), an incurable cancer of the B lineage plasma cells (PCs), chr1q-amp is a secondary genetic event that is present in 30% to 40% of patients at diagnosis and is associated with adverse prognosis, high-burden proliferative disease, and drug resistance.4,,,,-9 In addition, along with t(4;14) and del(17p), chr1q-amp is 1 of the top 3 genetic markers conferring adverse overall and progression-free survival in MM.10,11
Previous studies, often guided by low-resolution methodologies (eg, fluorescence in situ hybridization [FISH] against 1q21 locus12), identified several chr1q21 genes that are associated with adverse prognosis in MM, including CKS1B, PDKZ1, ILF2, ARNT, ADAR1, IL6R, MCL1, BCL9, and MDM2.13,,,,,,-20 However, genetic amplification that extends beyond chr1q21 has been reported in a small cohort of patients with MM,21 and non-chr1q21 genes (eg, CD1D, FCER1G) have been linked to the biology and prognosis of MM.22,-24 These observations raise the prospect that several areas across chr1q may contribute to the biological profile and clinical impact of chr1q-amp.
Further, how genetic amplification affects the 3-dimensional (3D) chromatin architecture of chr1q and influences biological processes that promote high-risk disease is not known. Understanding these processes could inform novel anticancer therapeutic approaches targeted to chr1q-amp that are currently lacking.
Here, we used a comprehensive systems medicine approach to resolve the 3D genome landscape of chr1q-amp and to integrate it with multi-omics data sets from patients with MM. This approach led to the identification of adverse prognosis genes across the entire chr1q arm, particularly in the 1q22 and 1q23.3 bands. Among 1q23.3-associated genes, we identified the transcription factor (TF) PBX1, which, in cooperation with FOXM1, regulates myeloma PC proliferation and generates a selective therapeutic vulnerability in chr1q-amp MM that can be targeted by a novel PBX1 inhibitor.
Methods
Cell cultures
All cell lines and culturing conditions used in this study are detailed in supplemental Methods (available on the Blood Web site).
Primary samples
Bone marrow aspirate samples from patients with MM and peripheral blood samples from normal donors were obtained upon written informed consent and under research ethics committee approval (Research Ethics Committee Reference: 11/H0308/9). Bone marrow aspirates were subjected to red cell lysis. MM PCs were purified after 2 rounds of CD138 immunomagnetic selection (Miltenyi Biotec), following the manufacturer’s instructions, as previously described.25 Pre- and postselection purity were assessed by flow cytometric analysis (BD LSR Fortessa) using a panel of fluorochrome-labeled anti-CD138, anti-CD45, anti-CD19, anti-CD56, and anti-CD38 monoclonal antibodies. Purified cells were immediately processed for assay for transposase-accessible chromatin using sequencing (ATAC-seq) and RNA-sequencing (RNA-seq) analysis or stored in fetal bovine serum plus 10% dimethyl sulfoxide (DMSO) at −150°C for later use.
Mononuclear cells from normal donor peripheral blood were isolated by Ficoll-Hypaque (Sigma-Aldrich) density centrifugation, following the manufacturer’s instructions, as described previously.26 The mononuclear cell interphase layer was aspirated, washed with 1 mL of phosphate buffered saline (PBS), centrifuged at 300g for 5 minutes, and resuspended in 100 μL of PBS. Peripheral blood B cells (PBBCs) were isolated using a Pan B Cell Isolation Kit II, human (Miltenyi Biotec), as per the manufacturer’s instructions.
Molecular cloning
A modified pLKO.1 lentiviral vector (Addgene plasmid #27994) was used in which the puromycin marker gene was replaced by eGFP (for knockdown experiments) or eBFP (for rescue experiments). All short hairpin RNA (shRNA) oligos were cloned, as previously described27: scrambled control (scrbl), 5′-CCTAAGGTTAAGTCGCCCTCG-3′; P11 (anti-PBX1), 5′-CGAAGCAATCAGCAAACACAA-3′; P31 (anti-PBX1), 5′-ATGATCCTGCGTTCCCGATTT-3′; O1 (anti-FOXM1), 5′-CTCTTCTCCCTCAGATATAGA-3′; and O4 (anti-FOXM1), 5′-GCCAATCGTTCTCTGACAGAA-3′. Successful cloning of recombined vectors was initially confirmed via diagnostic polymerase chain reaction (PCR), using the DreamTaq Green PCR Master Mix (2X) (Thermo Scientific) protocol and the 5′-TGGACTATCATATGCTTACCGTAAC-3′ forward and 5′- GTATGTCTGTTGCTATTATGTCTA-3′ reverse primers, followed by 1% agarose gel electrophoresis. The DNA sequence of positive clones was further confirmed via Sanger sequencing (outsourced to GENEWIZ Ltd), using the same primer set.
Molecular cloning of the overexpression plasmid vector is described in supplemental Methods.
RNA-seq
Total RNA was extracted from FACS-sorted myeloma PCs using a NucleoSpin RNA Kit (MACHEREY-NAGEL). A Qubit RNA Assay Kit (Life Technologies) was used to determine RNA quantity. Quality of RNA extracts was assessed on a Bioanalyzer using an RNA Pico Kit (Agilent). Samples with an RNA integrity number > 8 were processed using a NEBNext Poly(A) mRNA Magnetic Isolation Module and a NEBNext Ultra II RNA Library Prep Kit for Illumina (New England Biolabs), following the manufacturer’s instructions. A Qubit High Sensitivity DNA kit (Life Technologies) was used for library quantification; library size was evaluated using a Bioanalyzer High Sensitivity DNA Kit (Agilent). Libraries from the same experiment were diluted to 5 nM, pooled together, and sequenced at the BRC Genomics Facility (Imperial College London) using an Illumina HiSeq 4000 platform to obtain paired-end 75-bp reads.
ATAC-seq
ATAC-seq was performed as previously described.28 Briefly, 50 000 purified myeloma PCs or myeloma cell lines were washed with cold PBS (Sigma-Aldrich) at 500g at 4°C for 5 minutes. The cells were resuspended in 50 μL of cold Lysis Buffer (10 mM Tris-HCl [pH 7.4], 10 mM NaCl, 3 mM MgCl2, 0.1% IGEPAL CA-630) and washed at 500g at 4°C for 10 minutes. The nuclei were subjected to transposase reaction for 30 minutes at 37°C; termination of the reaction and DNA purification were performed using a MiniElute kit (QIAGEN) and eluted twice with 10 μL. The purified DNA was amplified as described before with NEBNext High-Fidelity 2X PCR Master Mix (New England Biolabs). The PCR amplified product was cleaned twice with (0.9X) AMPure beads (Beckman Coulter). The quality of the libraries was assessed with a Bioanalyzer High Sensitivity DNA Kit (Agilent). The libraries were quantified using a NEBNext Library Quant Kit for Illumina (New England Biolabs) on a StepOnePlus Real-Time PCR System (Applied Biosystems). The libraries were sequenced at the Genomics Facility at Imperial College London using an Illumina HiSeq 4000 platform to obtain paired-end 75-bp reads.
Bioinformatics and clinical informatics analysis
All methods used for statistical, bioinformatics, and clinical informatics analyses are described in supplemental Methods.
Code availability
Code used in this study can be accessed from the specified github page: https://github.com/nikostrasan/PBX1-project.
Additional materials and methods are described in supplemental Methods.
Results
Distinct patterns of amplification within chr1q shape its 3D chromatin architecture
We first explored whether and how genomic structural changes might impact the 3D chromatin structure of chr1q-amp myeloma cells. For this purpose, we constructed a correlation matrix of copy number scores across the chr1q arm (2-dimensional [2D] genome coamplification map) using whole genome sequencing (WGS) data from patients with MM (Multiple Myeloma Research Foundation [MMRF] CoMMpass database, N = 896)29 and compared it with the 3D genome Hi-C contact maps of 2 chr1q-amp MM cell lines (MMCLs; U266 and RPMI822630; Figure 1A). By applying the same computational method used for topologically associated domain (TAD) discovery to the 2D genome map,30 we found 4 main blocks (B1-B4) of genomic coamplification (termed “topologically coamplified domains” [TCDs]) that define distinct amplification patterns across patients with MM (Figure 1A; supplemental Figure 1A). Next, to understand the relationship between chr1q-amp and 3D chromatin structure, we compared the myeloma TCD and TAD maps, along with the Hi-C map of the reference GM12828 B cells31 (supplemental Figure 1B). First, we found that TAD organization was highly similar between the U266 and RPMI8226 myeloma cells but highly dissimilar between them and the GM12828 B cells (supplemental Figure 1B), suggesting extensive reorganization of the chr1q-amp 3D genome in myeloma cells. Second, we identified a weak overall similarity between the WGS coamplification map and the 3D genome maps of U266, RPMI8226, and GM12828 cells when we compared their insulation score profiles (supplemental Figure 1B). In a complementary analysis that aimed to identify the genetic amplification breakpoints in all patients, we found that ∼65% of the 135 GM12828 reference TADs are disrupted by chr1q-amp breakpoints (supplemental Figure 1C), further supporting the notion that genetic amplification extensively disrupts the 3D chromatin architecture of chr1q. In both analyses, we also identified a pericentromeric cluster of multiple breaks, as previously described.32
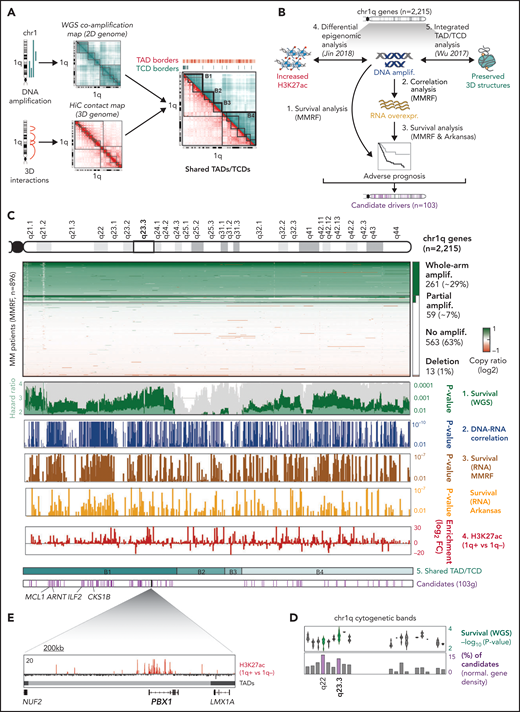
Multilayer systems medicine analysis of chr1q amplification in MM. (A) 2D coamplification (cyan) and 3D Hi-C contact (red) maps of chr1q locus in MM cells used to identify TCDs and TADs, respectively. Map overlay identified 4 major coamplified domains that retain a preserved 3D structure (B1-B4 hyperdomains). (B) Schematic overview of the analysis strategy used to detect candidate gene drivers of high-risk phenotypes in chr1q-amp MM. Scanning across the 2215 genes in chr1q, those fulfilling the following criteria were considered candidate drivers: (1) their genetic amplification (amplif.) is significantly associated with poor prognosis (MMRF data set, N = 896); (2) their genetic amplification is significantly associated with overexpression (MMRF data set, N = 896); (3) overexpression (overexpr.) is associated with poor prognosis in the MMRF (N = 896) and Arkansas data sets (N = 413); (4) significant epigenetic activation (ie, H3K27ac gain) is detected in chr1q-amp vs nonamplified samples (Jin2018,34 n = 10). The B1-B4 hyperdomains were also used as a reference here (5).30 Overall, our analysis identified 103 genes across the chr1q arm as candidate drivers for a high-risk MM prognosis. (C) Analysis overview. From top to bottom: chr1q cytogenetic map; copy number profiles of chr1q genes across MMRF patients detecting whole-arm amplification (amplif.; ∼29%), partial amplification (∼7%), no amplification (∼63%), and deletions (∼1%); survival analysis of genetic amplification of chr1q genes across MMRF patients (WGS, 73 genetic parameters; dark green bars, P values; light green bars, hazard ratio; gray bars, percentage bootstrapping confidence levels); Pearson correlation analysis between copy number ratios (WGS) and expression (RNA-seq; blue bars indicate Pearson correlation P values); survival analysis of chr1q gene expression (RNA-seq) in MMRF (brown) and Arkansas (yellow) data sets (bars indicate analysis P values); differential H3K27ac analysis between chr1q-amp (n = 5) vs nonamplified (n = 5) MM cells (red bars indicate differential log2 fold-change enrichment scores); 4 chr1q domains (B1-B4) with conserved TAD/TCD structures; candidate pathogenic driver genes (n = 103, pink bars) identified by the current analysis (the previously known MCL1, ARNT, ILF2, and CKS1B genes are shown here). (D) Analysis overview of candidate driver genes (103) across chr1q cytogenetic bands. Distribution of WGS multivariate analysis scores (-log10P value; upper panel) and percentage of candidate genes (relative to band gene density; lower panel) per cytogenetic band. The highest candidate gene density was detected in 1q22 and 1q23.3 bands (highlighted here), with 1q23.3 also displaying the highest survival significance scores. (E) The PBX1 gene as a prominent candidate occupying alone a single TAD, displays strong epigenetic activation across PBX1 body and putative enhancers in chr1q-amp myeloma PCs.
Multilayer systems medicine analysis of chr1q amplification in MM. (A) 2D coamplification (cyan) and 3D Hi-C contact (red) maps of chr1q locus in MM cells used to identify TCDs and TADs, respectively. Map overlay identified 4 major coamplified domains that retain a preserved 3D structure (B1-B4 hyperdomains). (B) Schematic overview of the analysis strategy used to detect candidate gene drivers of high-risk phenotypes in chr1q-amp MM. Scanning across the 2215 genes in chr1q, those fulfilling the following criteria were considered candidate drivers: (1) their genetic amplification (amplif.) is significantly associated with poor prognosis (MMRF data set, N = 896); (2) their genetic amplification is significantly associated with overexpression (MMRF data set, N = 896); (3) overexpression (overexpr.) is associated with poor prognosis in the MMRF (N = 896) and Arkansas data sets (N = 413); (4) significant epigenetic activation (ie, H3K27ac gain) is detected in chr1q-amp vs nonamplified samples (Jin2018,34 n = 10). The B1-B4 hyperdomains were also used as a reference here (5).30 Overall, our analysis identified 103 genes across the chr1q arm as candidate drivers for a high-risk MM prognosis. (C) Analysis overview. From top to bottom: chr1q cytogenetic map; copy number profiles of chr1q genes across MMRF patients detecting whole-arm amplification (amplif.; ∼29%), partial amplification (∼7%), no amplification (∼63%), and deletions (∼1%); survival analysis of genetic amplification of chr1q genes across MMRF patients (WGS, 73 genetic parameters; dark green bars, P values; light green bars, hazard ratio; gray bars, percentage bootstrapping confidence levels); Pearson correlation analysis between copy number ratios (WGS) and expression (RNA-seq; blue bars indicate Pearson correlation P values); survival analysis of chr1q gene expression (RNA-seq) in MMRF (brown) and Arkansas (yellow) data sets (bars indicate analysis P values); differential H3K27ac analysis between chr1q-amp (n = 5) vs nonamplified (n = 5) MM cells (red bars indicate differential log2 fold-change enrichment scores); 4 chr1q domains (B1-B4) with conserved TAD/TCD structures; candidate pathogenic driver genes (n = 103, pink bars) identified by the current analysis (the previously known MCL1, ARNT, ILF2, and CKS1B genes are shown here). (D) Analysis overview of candidate driver genes (103) across chr1q cytogenetic bands. Distribution of WGS multivariate analysis scores (-log10P value; upper panel) and percentage of candidate genes (relative to band gene density; lower panel) per cytogenetic band. The highest candidate gene density was detected in 1q22 and 1q23.3 bands (highlighted here), with 1q23.3 also displaying the highest survival significance scores. (E) The PBX1 gene as a prominent candidate occupying alone a single TAD, displays strong epigenetic activation across PBX1 body and putative enhancers in chr1q-amp myeloma PCs.
Finally, despite the extensive 3D chromatin reorganization within the TCDs, we observed that the B1-B4 borders coincide with TAD borders in chr1q-amp MM, suggesting that organization of these 4 hyperdomains evolves in parallel with some level of 3D chromatin structure retention and preservation (supplemental Figure 1A,D).
Systems medicine analysis identifies adverse prognosis drivers beyond chr1q21
Next, to identify all genes across chr1q that could potentially drive a high-risk phenotype in MM and with reference to the 3D chromatin structure, we combined genomic (WGS; whole exome sequencing), epigenomic (H3K27ac-seq), and transcriptomic (RNA-seq, DNA microarray) data with genetic variables from 3 studies: MMRF (N = 896),29 Arkansas (N = 414),33 and Jin2018 (N = 12)34 (Figure 1B). Of the 2215 chr1q genes, we considered as candidate drivers of adverse prognosis only those fulfilling the following criteria: (1) their genetic amplification predicts adverse prognosis, independent of the prognostic impact of 73 other molecular markers (MMRF data set; supplemental Figure 1E); (2) their genetic amplification is significantly associated with their transcriptional overexpression (MMRF data set); (3) their overexpression is significantly correlated with adverse prognosis (MMRF and Arkansas data sets); and (4) their genetic amplification is accompanied by epigenetic activation (ie, H3K27ac signal gain compared with nonamplified MM; Jin2018 data set34) (Figure 1C; supplemental Table 1).
This stepwise analysis identified 103 candidate genes residing exclusively in the B1 and B4 hyperdomains, including the previously known MCL1, CKS1B, ILF2, and ARNT genes located in chr1q21.313,-15 (Figure 1C). Pathway analysis of all 103 genes showed significant enrichment for cell cycle–related processes, suggesting their involvement in the proliferative phenotype that is associated with chr1q-amp MM17 (supplemental Figure 1F). Interestingly, we identified chr1q22 and chr1q23.3 as the 2 cytogenetic bands that, relative to their gene density, contain the highest number of candidate adverse prognosis genes (supplemental Figure 1G), with chr1q23.3 displaying the highest association with adverse prognosis (Figure 1C-D). Therefore, regions other than chr1q21 also contribute to the high-risk proliferative phenotype linked to chr1q-amp in MM.
PBX1 is a novel biomarker of chr1q genetic amplification
Among chr1q23.3 genes, the TF PBX1, which was previously reported to promote cancer cell survival, metastasis, and drug resistance,35,-37 was notable for the highest H3K27ac signal gain across its own preserved TAD (Figure 1E; supplemental Figure 1D,H). These features make up a unique case of amplification of an entire regulatory domain linked to epigenetic activation, gene overexpression, and adverse prognosis. Further analysis using the MMRF data set confirmed PBX1 as a marker of high-risk MM disease, with its amplification significantly correlating with its overexpression (supplemental Figure 2A-B), whereas PBX1 overexpression was associated with high-risk clinical features, high myeloma PC proliferative index, progressive/relapsed disease, and worse overall survival (supplemental Figure 2C-J).
The proproliferative role of PBX1 in chr1q-amp MM
We further explored the functional role of PBX1 in chr1q-amp MM cells by assessing its messenger RNA (mRNA) and protein expression levels across healthy and tumor cells. Based on RNA-seq data, we found that, in normal hematopoiesis, PBX1 is expressed in bone marrow hematopoietic stem and progenitor cells, as well as megakaryocytes, but not in B cells or PCs (supplemental Figure 3A). In MM, we confirmed ectopic expression of PBX1 in 4 chr1q-amp MMCLs by reverse transcription quantitative PCR (RT-qPCR) (Figure 2A), as well as in 9 of 11 patient myeloma PC samples with FISH-verified chr1q-amp by RT-qPCR and immunohistochemistry, using breast cancer as a positive control (Figure 2B; supplemental Figure 3B-C). As expected, tonsillar germinal center B cells and submucosal PCs stained negative for PBX1 expression (supplemental Figure 3C)
![PBX1-dependent myeloma cell proliferation. (A) mRNA expression of PBX1 in 4 MM cell lines. (B) Immunohistochemical (IHC) analysis of trephine bone marrow biopsy samples from 11 patients with MM detects no (neg), medium (1), or high (2) PBX1 expression at the clonal or subclonal level (percentage of PBX1+ cells). (C) Time course flow cytometry–based analysis of MM.1S (left panel) and U226 (right panel) myeloma cell viability in vitro, upon lentiviral transduction with scrbl and anti-PBX1 shRNAs (P11, P31). Data collected from 3 biological replicates represent the fraction of GFP+ live cells at the time points shown, after normalization against day 3 (d3). Statistical analysis was performed using 2-way analysis of variance (ANOVA) with a post hoc multiple-comparisons test. Error bars represent standard error of the mean (n = 3). Knockdown of PBX1 in MM.1S cells using an in vivo plasmacytoma xenograft mouse model; tumor size (D) and tumor weight (E) at the termination day 32. Statistical analysis was performed using the Kruskal-Wallis test with Dunn’s post hoc multiple-comparisons test. (F) Relative fraction of transduced cells detected at the start (day 0 [D0], Live/GFP+ cells) and termination (D32, Live/HLA+GFP+ cells) day. (G) RNA-seq analysis of PBX1-depleted MM.1S and U266 cells 3 days after lentiviral transduction. Heat maps indicate differentially expressed genes shared between P11- and P31-depleted cells for each cell line. (H) Gene set enrichment analysis (GSEA) of upregulated (UP) or downregulated (DOWN) genes in MM.1S and U266 myeloma cells illustrates significantly enriched molecular pathways in each cell line. Enrichment plots for the prominent cell cycle regulation pathway (E2F targets), which was identified as a top hit, are also presented. (I) Flow cytometric cell cycle analysis of MM.1S and U266 cells 6 days after PBX1 knockdown. Data represent the summary of 3 biological experiments. Analysis was done using parametric 1-way ANOVA with a post hoc multiple-comparisons test. *P < .05; **P < .01; ***P < .001; ****P < .0001.](https://ash.silverchair-cdn.com/ash/content_public/journal/blood/139/13/10.1182_blood.2021014391/6/m_bloodbld2021014391f2.png?Expires=1765884714&Signature=TXDCJYBUW~ada1Gm2HS9oAacbw4vimuA6HMngLVfGAqQoMflE-FnTXnrQ7s55GxwCbqoy0mOg5KOQeoeScPGCifplvvD0R~Ds3FMKrYSVVUJkppoScqL79ycXYjNNRbsoJpKbkH6aMnBWvqDkRj600jwXM3iz0h-UwjjFLP-UPIIs4WcJyVEayC-bfH3sZcwpmk~e7o7dH8PI4EdPgu261ZCQ27P5~-DRRy0~y2GB641KAfKvNWiBrV90rWSC5TYPp2Jx2~REU1PRtBKl8UN25cuVZumtT9raKBOqCaE3gG5FfcNb4tplfEV5C6F7vVa3EedDG-sOL2PtqUcAYefVA__&Key-Pair-Id=APKAIE5G5CRDK6RD3PGA)
PBX1-dependent myeloma cell proliferation. (A) mRNA expression of PBX1 in 4 MM cell lines. (B) Immunohistochemical (IHC) analysis of trephine bone marrow biopsy samples from 11 patients with MM detects no (neg), medium (1), or high (2) PBX1 expression at the clonal or subclonal level (percentage of PBX1+ cells). (C) Time course flow cytometry–based analysis of MM.1S (left panel) and U226 (right panel) myeloma cell viability in vitro, upon lentiviral transduction with scrbl and anti-PBX1 shRNAs (P11, P31). Data collected from 3 biological replicates represent the fraction of GFP+ live cells at the time points shown, after normalization against day 3 (d3). Statistical analysis was performed using 2-way analysis of variance (ANOVA) with a post hoc multiple-comparisons test. Error bars represent standard error of the mean (n = 3). Knockdown of PBX1 in MM.1S cells using an in vivo plasmacytoma xenograft mouse model; tumor size (D) and tumor weight (E) at the termination day 32. Statistical analysis was performed using the Kruskal-Wallis test with Dunn’s post hoc multiple-comparisons test. (F) Relative fraction of transduced cells detected at the start (day 0 [D0], Live/GFP+ cells) and termination (D32, Live/HLA+GFP+ cells) day. (G) RNA-seq analysis of PBX1-depleted MM.1S and U266 cells 3 days after lentiviral transduction. Heat maps indicate differentially expressed genes shared between P11- and P31-depleted cells for each cell line. (H) Gene set enrichment analysis (GSEA) of upregulated (UP) or downregulated (DOWN) genes in MM.1S and U266 myeloma cells illustrates significantly enriched molecular pathways in each cell line. Enrichment plots for the prominent cell cycle regulation pathway (E2F targets), which was identified as a top hit, are also presented. (I) Flow cytometric cell cycle analysis of MM.1S and U266 cells 6 days after PBX1 knockdown. Data represent the summary of 3 biological experiments. Analysis was done using parametric 1-way ANOVA with a post hoc multiple-comparisons test. *P < .05; **P < .01; ***P < .001; ****P < .0001.
PBX1-dependent myeloma cell proliferation. (A) mRNA expression of PBX1 in 4 MM cell lines. (B) Immunohistochemical (IHC) analysis of trephine bone marrow biopsy samples from 11 patients with MM detects no (neg), medium (1), or high (2) PBX1 expression at the clonal or subclonal level (percentage of PBX1+ cells). (C) Time course flow cytometry–based analysis of MM.1S (left panel) and U226 (right panel) myeloma cell viability in vitro, upon lentiviral transduction with scrbl and anti-PBX1 shRNAs (P11, P31). Data collected from 3 biological replicates represent the fraction of GFP+ live cells at the time points shown, after normalization against day 3 (d3). Statistical analysis was performed using 2-way analysis of variance (ANOVA) with a post hoc multiple-comparisons test. Error bars represent standard error of the mean (n = 3). Knockdown of PBX1 in MM.1S cells using an in vivo plasmacytoma xenograft mouse model; tumor size (D) and tumor weight (E) at the termination day 32. Statistical analysis was performed using the Kruskal-Wallis test with Dunn’s post hoc multiple-comparisons test. (F) Relative fraction of transduced cells detected at the start (day 0 [D0], Live/GFP+ cells) and termination (D32, Live/HLA+GFP+ cells) day. (G) RNA-seq analysis of PBX1-depleted MM.1S and U266 cells 3 days after lentiviral transduction. Heat maps indicate differentially expressed genes shared between P11- and P31-depleted cells for each cell line. (H) Gene set enrichment analysis (GSEA) of upregulated (UP) or downregulated (DOWN) genes in MM.1S and U266 myeloma cells illustrates significantly enriched molecular pathways in each cell line. Enrichment plots for the prominent cell cycle regulation pathway (E2F targets), which was identified as a top hit, are also presented. (I) Flow cytometric cell cycle analysis of MM.1S and U266 cells 6 days after PBX1 knockdown. Data represent the summary of 3 biological experiments. Analysis was done using parametric 1-way ANOVA with a post hoc multiple-comparisons test. *P < .05; **P < .01; ***P < .001; ****P < .0001.
Depletion of PBX1, using 2 validated shRNAs (P31, P11) and assessed by GFP marker expression, was toxic to MM.1S and U266 cells compared with the scrbl shRNA control in vitro (Figure 2C; supplemental Figure 3D) and impaired myeloma cell growth (MM.1S) in an in vivo subcutaneous MM model (Figure 2D-F; supplemental Figure 3E-G). To gain further insights, we performed RNA-seq analysis in both MMCLs upon shRNA-mediated PBX1 depletion (Figure 2G-H; supplemental Table 2). Transcriptome profiling of PBX1-depleted cells showed that similar numbers of genes were deregulated in the 2 MMCLs, whereas gene set enrichment analysis revealed significant enrichment for cell cycle–related pathways in downregulated and interferon response pathways in upregulated genes (Figure 2H). This is consistent with the reported enrichment of interferon response pathways in early-stage nonproliferative MM and of cell cycle–related pathways in advanced disease and MMCLs.38,39 Accordingly, flow cytometric analysis showed significant G1-phase cell cycle arrest in PBX1-depleted MMCLs (Figure 2I; supplemental Figure 3H).
Defining the epigenetic and regulatory program of PBX1 in chr1q-amp cells
Chromatin immunoprecipitation sequencing (ChIP-seq) analysis against PBX1 in MM.1S and U266 cells identified 30 000 to 40 000 binding sites (Figure 3A; supplemental Table 2). Further annotation using chromHMM maps (built upon ENCODE/Blueprint Consortium data) showed that 60% to 80% of PBX1 recruitment occurs in active chromatin promoter and enhancer areas, and motif enrichment analysis identified the PBX1 motif among the top hits (Figure 3A; supplemental Figure 4A-D). Additional analysis of ChIP-seq against H3K27ac (H3K27ac-seq) profiles from 8 primary myeloma PCs and 9 MMCLs34 identified 2400 superenhancers (SEs), 70% of which are PBX1 bound (Figure 3B). Sample stratification based on chr1q-amp status showed a significantly higher H3K27ac signal in PBX1-bound SEs in chr1q-amp vs nonamplified cells, suggesting extensive epigenetic reprogramming associated with PBX1 binding in chr1q-amp myeloma cells (Figure 3C; supplemental Figure 4E-F). Interestingly, the PBX1-bound SEs in chr1q-amp cells are predicted to regulate critical cellular pathways, including the cell cycle (Figure 3D).
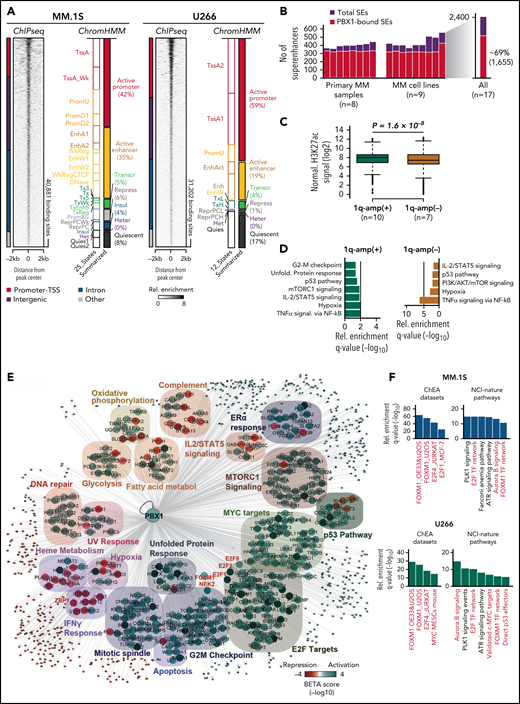
Genome-wide analysis of PBX1 function in chr1q-amp myeloma cells. (A) Heat map representation of PBX1 cistrome in MM.1S and U266 cells, as identified by ChIP-seq analysis (n = 2 per cell line). Genomic annotation (left) and epigenomic chromHMM states (right) of significantly enriched regions are also shown. (B) SE analysis across 9 MM cell lines and 8 MM primary samples using H3K27ac-seq (data obtained from Jin201834). Number of total and PBX1-bound SEs across 17 MM samples (left panel) and the aggregated profile in all samples (right panel) are shown. (C) Boxplot representations of average normalized H3K27ac signal of chr1q-amp and nonamplified samples across 1655 PBX1-bound SEs. Analysis was performed using a paired Student t test. (D) Pathway analysis of genes predicted to be regulated by PBX1-bound SEs in chr1q-amp (+) and nonamplified (-) cells. (E) Integrative cistrome-transcriptome analysis with BETA-plus displays the regulatory program of PBX1 in MM.1S cells. Biological annotation of genes was performed using the Molecular Signatures Database. Node colors represent average predicted activation (blue) or repression (red) for each gene. Transcriptional targets of interest are highlighted in red font. (F) Overrepresentation analysis against the ChEA database and NCI-Nature pathways of the direct PBX1 target genes in MM.1S (upper panels) and U266 (lower panels) cells. Terms of interest are highlighted in red font. metabol, metabolism; Rel., relative.
Genome-wide analysis of PBX1 function in chr1q-amp myeloma cells. (A) Heat map representation of PBX1 cistrome in MM.1S and U266 cells, as identified by ChIP-seq analysis (n = 2 per cell line). Genomic annotation (left) and epigenomic chromHMM states (right) of significantly enriched regions are also shown. (B) SE analysis across 9 MM cell lines and 8 MM primary samples using H3K27ac-seq (data obtained from Jin201834). Number of total and PBX1-bound SEs across 17 MM samples (left panel) and the aggregated profile in all samples (right panel) are shown. (C) Boxplot representations of average normalized H3K27ac signal of chr1q-amp and nonamplified samples across 1655 PBX1-bound SEs. Analysis was performed using a paired Student t test. (D) Pathway analysis of genes predicted to be regulated by PBX1-bound SEs in chr1q-amp (+) and nonamplified (-) cells. (E) Integrative cistrome-transcriptome analysis with BETA-plus displays the regulatory program of PBX1 in MM.1S cells. Biological annotation of genes was performed using the Molecular Signatures Database. Node colors represent average predicted activation (blue) or repression (red) for each gene. Transcriptional targets of interest are highlighted in red font. (F) Overrepresentation analysis against the ChEA database and NCI-Nature pathways of the direct PBX1 target genes in MM.1S (upper panels) and U266 (lower panels) cells. Terms of interest are highlighted in red font. metabol, metabolism; Rel., relative.
Next, we integrated the PBX1 cistrome with the PBX1-depleted transcriptomes to generate the gene regulatory network of PBX1 in chr1q-amp cells (Figure 3E; supplemental Figure 4G-I; supplemental Table 3). We identified ∼700 and ∼300 genes that were directly activated and repressed, respectively, by PBX1 in MM.1S and U266 MMCLs. Again, among other prominent oncogenic pathways, the former were primarily enriched in cell cycle–related biological processes and the latter were enriched in interferon response pathways (Figure 3E).
The PBX1-FOXM1 axis regulates cell proliferation in chr1q-amp MM
Among the PBX1-dependent targets, we detected significant enrichment of the proproliferative FOXM1 and E2F TFs and their corresponding targets (Figure 3F), such as the FOXM1-dependent NEK2 that regulates drug resistance in MM40,41 (Figure 4A). Further, we identified PBX1 binding on active PBX1, E2F1/2, and NEK2 promoters and PBX1, FOXM1, E2F2, and NEK2 enhancers (Figure 4B). FOXM1 was also found to bind to the same FOXM1 and NEK2 regions as PBX1 (supplemental Figure 5A). To better explore the regulatory interplay among those factors (Figure 4A), we further characterized the role of FOXM1 in chr1q-amp cells. Knockdown of FOXM1 using 2 validated shRNAs was toxic to MM.1S cells (Figure 4C), as previously shown.40 In addition, depletion of FOXM1 mRNA was associated with downregulation of NEK2 but not of PBX1 (Figure 4D), suggesting that FOXM1 acts downstream of PBX1 (Figure 4A). Moreover, RNA-seq analysis revealed ∼800 differentially expressed genes after FOXM1 knockdown in MM.1S cells (Figure 4E); cell cycle–related pathways were significantly enriched among downregulated genes (Figure 4F). Cell cycle arrest at G2/M was corroborated by flow cytometry, thus confirming the proproliferative role of FOXM1 in chr1q-amp MMCLs (supplemental Figure 5B).
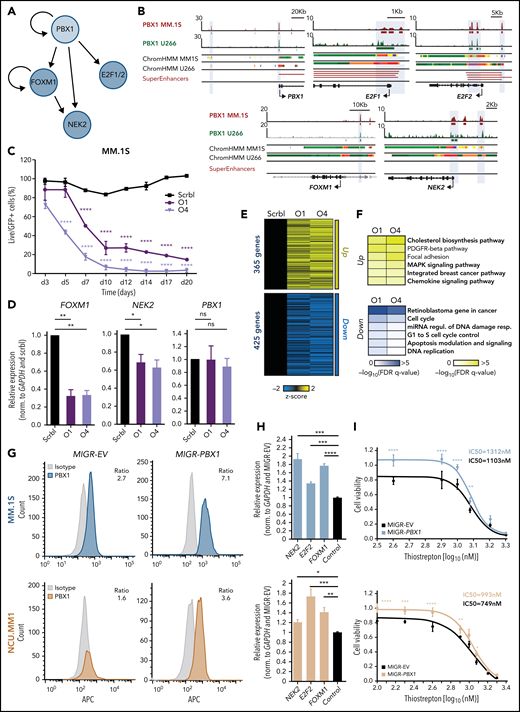
PBX1 directly regulates FOXM1- and E2F1/2-associated transcriptional programs in chr1q-amp MM cells. (A) Regulatory connections between PBX1 and its downstream targets FOXM1, E2F1/2, and NEK2 in chr1q-amp MM cells as derived from Figure 3E-F. (B) IGV snapshots display the epigenomic features of prominent genetic loci: PBX1 promoter and enhancer, E2F1 promoter, E2F2 promoter and enhancer, FOXM1 enhancer, NEK2 promoter and enhancer. From top tobottom: PBX1 ChIP-seq in MM.1S and U266 cells, ChromHMM maps in MM.1S and U266 cells (color code same as in Figure 3A), and SEs as identified in chr1q-amp MMCL and primary samples. (C) Flow cytometry–based analysis of MM.1S cell survival (n = 3) upon transduction with anti-FOXM1 shRNAs (O1, O4) and scrbl lentiviral vectors. Statistical analysis was performed using 2-way analysis of variance (ANOVA) with a post hoc multiple-comparisons test. (D) Analysis of PBX1, FOXM1, and NEK2 expression levels by RT-qPCR after lentiviral transduction with anti-FOXM1 and scrbl shRNA in MM.1S cells (n = 3). Statistical analysis was performed using 1-way ANOVA with a post hoc multiple-comparisons test. (E) Heat map representation of differentially expressed genes after FOXM1 depletion with O1 and O4 shRNAs in comparison with scrbl (RNA-seq, n = 2). (F) Overrepresentation analysis of significantly upregulated (upper panel) and downregulated (lower panel) genes upon FOXM1 knockdown in MM.1S cells. (G) Intracellular staining was followed by flow cytometric analysis of MM.1S (upper panels) and NCU.MM1 (lower panels) cells transduced with control (MIGR-EV) or PBX1-overexpressing (MIGR-PBX1) vectors using anti-PBX1 or isotype control antibodies (mean fluorescence intensity ratio between antibodies is shown). (H) RT-qPCR analysis of NEK2, E2F2, and FOXM1 mRNA expression in PBX1-overexpressing vs control MM.1S (upper panel) and NCUMM1 (lower panel) cells (n = 4). Data were analyzed using 1-way ANOVA with a post hoc multiple-comparisons test. (I) Drug-sensitivity assays in MIGR-EV and MIGR-PBX1 transduced MM.1S (upper panel) and NCU.MM1 (lower panel) cells 48 hours after treatment with the FOXM1 inhibitor thiostrepton (n = 3). Fifty percent inhibitory concentration (IC50) values were calculated for each cell line using a nonlinear fitting model (fitting line represented here). Error bars show standard errors of the mean. *P < .05; **P < .01; ***P < .001; ****P < .0001. FDR, false discovery rate; miRNA, microRNA; ns, not significant; Regul., regulation; Resp., response.
PBX1 directly regulates FOXM1- and E2F1/2-associated transcriptional programs in chr1q-amp MM cells. (A) Regulatory connections between PBX1 and its downstream targets FOXM1, E2F1/2, and NEK2 in chr1q-amp MM cells as derived from Figure 3E-F. (B) IGV snapshots display the epigenomic features of prominent genetic loci: PBX1 promoter and enhancer, E2F1 promoter, E2F2 promoter and enhancer, FOXM1 enhancer, NEK2 promoter and enhancer. From top tobottom: PBX1 ChIP-seq in MM.1S and U266 cells, ChromHMM maps in MM.1S and U266 cells (color code same as in Figure 3A), and SEs as identified in chr1q-amp MMCL and primary samples. (C) Flow cytometry–based analysis of MM.1S cell survival (n = 3) upon transduction with anti-FOXM1 shRNAs (O1, O4) and scrbl lentiviral vectors. Statistical analysis was performed using 2-way analysis of variance (ANOVA) with a post hoc multiple-comparisons test. (D) Analysis of PBX1, FOXM1, and NEK2 expression levels by RT-qPCR after lentiviral transduction with anti-FOXM1 and scrbl shRNA in MM.1S cells (n = 3). Statistical analysis was performed using 1-way ANOVA with a post hoc multiple-comparisons test. (E) Heat map representation of differentially expressed genes after FOXM1 depletion with O1 and O4 shRNAs in comparison with scrbl (RNA-seq, n = 2). (F) Overrepresentation analysis of significantly upregulated (upper panel) and downregulated (lower panel) genes upon FOXM1 knockdown in MM.1S cells. (G) Intracellular staining was followed by flow cytometric analysis of MM.1S (upper panels) and NCU.MM1 (lower panels) cells transduced with control (MIGR-EV) or PBX1-overexpressing (MIGR-PBX1) vectors using anti-PBX1 or isotype control antibodies (mean fluorescence intensity ratio between antibodies is shown). (H) RT-qPCR analysis of NEK2, E2F2, and FOXM1 mRNA expression in PBX1-overexpressing vs control MM.1S (upper panel) and NCUMM1 (lower panel) cells (n = 4). Data were analyzed using 1-way ANOVA with a post hoc multiple-comparisons test. (I) Drug-sensitivity assays in MIGR-EV and MIGR-PBX1 transduced MM.1S (upper panel) and NCU.MM1 (lower panel) cells 48 hours after treatment with the FOXM1 inhibitor thiostrepton (n = 3). Fifty percent inhibitory concentration (IC50) values were calculated for each cell line using a nonlinear fitting model (fitting line represented here). Error bars show standard errors of the mean. *P < .05; **P < .01; ***P < .001; ****P < .0001. FDR, false discovery rate; miRNA, microRNA; ns, not significant; Regul., regulation; Resp., response.
For further validation of the PBX1-FOXM1 axis, we forced expression of exogenous PBX1 complementary DNA (cDNA) into MM.1S and NCU.MM1 chr1q-amp MM cells (Figure 4G). This led to a modest, but significant, increase in FOXM1, NEK2, and E2F2 mRNA levels (Figure 4H) and significantly reduced sensitivity of the MMCLs to thiostrepton, an inhibitor of FOXM1 transcription40,42 (Figure 4I; supplemental Figure 5C). Rescue of PBX1 depletion by shRNA-resistant PBX1 cDNA resulted in a significantly lower MMCL toxicity, ameliorated cell cycle arrest, and dampened downregulation of FOXM1, NEK2, and E2F2 (supplemental Figure 5D-G). These findings validated the genetic and functional interactions in the PBX1-FOXM1 axis (Figure 4A) and its role in orchestrating an oncogenic proliferative process in chr1q-amp MM cells.
The PBX1-FOXM1 regulatory axis generates a selective therapeutic vulnerability in primary chr1q-amp MM cells
Next, we sought to validate activity of the PBX1-FOXM1 axis in primary myeloma PCs (Figure 5A). For this purpose, we combined RNA-seq with ATAC-seq profiling of highly purified chr1q-amp (n = 6) and nonamplified (n = 6) primary myeloma PCs and explored differences in chromatin accessibility, gene expression, and predicted TF connectivity (Figure 5A; supplemental Table 4). In addition to previously established gene markers (CKS1B, IL6R, ARNT, PDKZ1, ADAR), we found overexpression of all main PBX1-FOXM1 module components (PBX1, FOXM1, E2F1/2, NEK2) in chr1q-amp cells (Figure 5B). Moreover, there was significant enrichment of proliferative pathways and FOXM1-dependent targets in genes overexpressed in chr1q-amp cells (Figure 5C). Comparative ATAC-seq analysis revealed enhanced chromatin accessibility in the regulatory regions of genes overexpressed in the same cells (Figure 5D). Differential TF footprinting analysis revealed a higher number of TFs with increased connectivity (measured as differential regulatory potential, ΔP) in chr1q-amp cells vs nonamplified cells (Figure 5E). By combining transcriptional and regulation profiles, we identified 34 TFs with increased expression and connectivity in chr1q-amp cells, including all 4 TFs involved in the PBX1-FOXM1 module (PBX1, FOXM1, E2F1, E2F2; Figures 4A and 5F). Notably, compared with nonamplified cells (n = 3), chr1q-amp primary myeloma cells (n = 3) were selectively sensitive to thiostrepton treatment, whereas expression of FOXM1 and NEK2, but not PBX1, decreased in response to treatment (Figure 5G-H).
![Differential regulome and thiostrepton cytotoxicity profiling of primary chr1q-amp vs nonamplified MM cells. (A) Schematic representation of experimental strategy. Myeloma PCs were isolated via magnetic beads selection (CD138+) from bone marrow aspirates derived from 6 patients with chr1q-amp [chr1q-amp(+)] MM and 6 patients with nonamplified [chr1q-amp(-)] MM. Differential regulome (TF expression and wiring) analysis was performed via parallel chromatin accessibility (ATAC-seq) and transcriptome (RNA-seq) profiling. (B) Volcano plot displaying differentially expressed genes [chr1q-amp(+), green; chr1q-amp(-), orange]. Genes implicated in chr1q-amp pathogenesis in this study (pink) or previous studies (black) are indicated. (C) Enrichment analysis (NCI-Nature pathways) of differentially expressed genes in 2 patient subgroups. (D) Differential ATAC-seq analysis between chr1q-amp(+) and chr1q-amp(-) myeloma PCs. Increased accessibility was found on genetic loci of genes of interest upon chr1q amplification (as indicated here). (E) Differential ATAC-seq footprinting analysis of expressed TFs in chr1q-amp(+) vs chr1q-amp(-) cells (ΔP, differential regulatory potential). TFs of interest are indicated. (F) Scatter plot representation of differential expression (x-axis) and differential regulatory potential (y-axis) of 63 TFs displaying significant differences in both dimensions. Green quartile: TFs with increased expression and ΔP in chr1q-amp(+) cells; orange quartile: TFs with decreased expression and ΔP in chr1q-amp(+) cells. Key TFs are also highlighted. (G) Selective sensitivity of chr1q-amp(+) (n = 3, green) vs chr1q-amp(-) (n = 3, orange) primary myeloma PCs to thiostrepton at 48 hours after treatment. Fifty percent inhibitory concentration (IC50) values were calculated for each patient sample using a nonlinear fitting model (fitting line shown here). (H) Transcriptional profiling (RT-qPCR) of FOXM1 and NEK2 mRNA levels in chr1q-amp(+) (green) and chr1q-amp(-) (orange) primary samples 24 hours after thiostrepton (1μM) or mock (0nM) treatment. The (%) decrease in FOXM1 and NEK2 mRNA levels is also indicated. ***P < .001; ****P < .0001. n/a, not applicable.](https://ash.silverchair-cdn.com/ash/content_public/journal/blood/139/13/10.1182_blood.2021014391/6/m_bloodbld2021014391f5.png?Expires=1765884714&Signature=QYzaKHs9rAjsV1Aw7gw28~vNmIJ4C09H0NTXvMypUPhadpvliDdg2YfoORUJJHm4LZ2SKs00pvStBP~SFRWHOKYYKajCpC3zfEU1rgPe8kD9Q~z-emwMDLeGJvHKJPZQhzFlo~qwCiykw65feHhgFAo9bX-WS9qo-jwMq4UZ1Lg7sKuqJ-35xH7KzipBP~ypBok70k-rcVp8Jm0Bmol8BC2dVzIZeSB8wWD2iO9ABESvM3dQtiObrS~Qbu4DjShqIAWblQuducfe-QGbKjV-iCv-qAnZZpC28mkp9eNajn5sR5Hv8SzIIOQ~A2P0LIOeGA4x0ROtE3Ou3s18~V7VjQ__&Key-Pair-Id=APKAIE5G5CRDK6RD3PGA)
Differential regulome and thiostrepton cytotoxicity profiling of primary chr1q-amp vs nonamplified MM cells. (A) Schematic representation of experimental strategy. Myeloma PCs were isolated via magnetic beads selection (CD138+) from bone marrow aspirates derived from 6 patients with chr1q-amp [chr1q-amp(+)] MM and 6 patients with nonamplified [chr1q-amp(-)] MM. Differential regulome (TF expression and wiring) analysis was performed via parallel chromatin accessibility (ATAC-seq) and transcriptome (RNA-seq) profiling. (B) Volcano plot displaying differentially expressed genes [chr1q-amp(+), green; chr1q-amp(-), orange]. Genes implicated in chr1q-amp pathogenesis in this study (pink) or previous studies (black) are indicated. (C) Enrichment analysis (NCI-Nature pathways) of differentially expressed genes in 2 patient subgroups. (D) Differential ATAC-seq analysis between chr1q-amp(+) and chr1q-amp(-) myeloma PCs. Increased accessibility was found on genetic loci of genes of interest upon chr1q amplification (as indicated here). (E) Differential ATAC-seq footprinting analysis of expressed TFs in chr1q-amp(+) vs chr1q-amp(-) cells (ΔP, differential regulatory potential). TFs of interest are indicated. (F) Scatter plot representation of differential expression (x-axis) and differential regulatory potential (y-axis) of 63 TFs displaying significant differences in both dimensions. Green quartile: TFs with increased expression and ΔP in chr1q-amp(+) cells; orange quartile: TFs with decreased expression and ΔP in chr1q-amp(+) cells. Key TFs are also highlighted. (G) Selective sensitivity of chr1q-amp(+) (n = 3, green) vs chr1q-amp(-) (n = 3, orange) primary myeloma PCs to thiostrepton at 48 hours after treatment. Fifty percent inhibitory concentration (IC50) values were calculated for each patient sample using a nonlinear fitting model (fitting line shown here). (H) Transcriptional profiling (RT-qPCR) of FOXM1 and NEK2 mRNA levels in chr1q-amp(+) (green) and chr1q-amp(-) (orange) primary samples 24 hours after thiostrepton (1μM) or mock (0nM) treatment. The (%) decrease in FOXM1 and NEK2 mRNA levels is also indicated. ***P < .001; ****P < .0001. n/a, not applicable.
Differential regulome and thiostrepton cytotoxicity profiling of primary chr1q-amp vs nonamplified MM cells. (A) Schematic representation of experimental strategy. Myeloma PCs were isolated via magnetic beads selection (CD138+) from bone marrow aspirates derived from 6 patients with chr1q-amp [chr1q-amp(+)] MM and 6 patients with nonamplified [chr1q-amp(-)] MM. Differential regulome (TF expression and wiring) analysis was performed via parallel chromatin accessibility (ATAC-seq) and transcriptome (RNA-seq) profiling. (B) Volcano plot displaying differentially expressed genes [chr1q-amp(+), green; chr1q-amp(-), orange]. Genes implicated in chr1q-amp pathogenesis in this study (pink) or previous studies (black) are indicated. (C) Enrichment analysis (NCI-Nature pathways) of differentially expressed genes in 2 patient subgroups. (D) Differential ATAC-seq analysis between chr1q-amp(+) and chr1q-amp(-) myeloma PCs. Increased accessibility was found on genetic loci of genes of interest upon chr1q amplification (as indicated here). (E) Differential ATAC-seq footprinting analysis of expressed TFs in chr1q-amp(+) vs chr1q-amp(-) cells (ΔP, differential regulatory potential). TFs of interest are indicated. (F) Scatter plot representation of differential expression (x-axis) and differential regulatory potential (y-axis) of 63 TFs displaying significant differences in both dimensions. Green quartile: TFs with increased expression and ΔP in chr1q-amp(+) cells; orange quartile: TFs with decreased expression and ΔP in chr1q-amp(+) cells. Key TFs are also highlighted. (G) Selective sensitivity of chr1q-amp(+) (n = 3, green) vs chr1q-amp(-) (n = 3, orange) primary myeloma PCs to thiostrepton at 48 hours after treatment. Fifty percent inhibitory concentration (IC50) values were calculated for each patient sample using a nonlinear fitting model (fitting line shown here). (H) Transcriptional profiling (RT-qPCR) of FOXM1 and NEK2 mRNA levels in chr1q-amp(+) (green) and chr1q-amp(-) (orange) primary samples 24 hours after thiostrepton (1μM) or mock (0nM) treatment. The (%) decrease in FOXM1 and NEK2 mRNA levels is also indicated. ***P < .001; ****P < .0001. n/a, not applicable.
In addition, we validated functional activation of the PBX1 and shared PBX1-FOXM1 transcriptional programs in a large cohort of patients (MMRF, N = 813) and confirmed significant coexpression of PBX1 and FOXM1 with almost all of their gene targets across patients in 2 cohorts (MMRF, Arkansas; supplemental Figure 6A; supplemental Table 5). Importantly, the majority of genes previously shown to make up high-risk disease signatures in MM17,41,43,44 were found to be directly regulated by PBX1 (supplemental Figure 6B; supplemental Table 5). Together, these findings strongly support the critical role of the PBX1-FOXM1 axis in promoting proliferative regulatory circuitries determining adverse prognosis and high-risk disease in patients with chr1q-amp MM.
Targeted therapy against chr1q-amp in cancer using a novel selective PBX1 inhibitor
Given that the PBX1-FOXM1 axis acts as a central regulatory hub in chr1q-amp MM cells, we next sought to explore the prognostic impact and therapeutic potential of selective PBX1 targeting in chr1q-amp cells across several types of cancer. For this purpose, we first analyzed transcriptomic data from multiple cohorts of patients with cancer and found that activation of the PBX1-dependent regulatory signature (n = 320 genes) predicts adverse prognosis in MM and 12 solid tumor patient cohorts, including breast, ovarian, lung, and brain cancer, in which chr1q-amp is a frequent CNA2,3 (Figure 6A; supplemental Figure 7A). Next, we tested the impact of our novel, recently reported small molecule compound T417, which specifically inhibits PBX1 binding to its cognate DNA motif in chr1q-amp ovarian cancer cells.45 We screened 4 myeloma (MM.1S, U266, NCU.MM1, OPM2), 2 breast cancer (MCF-7, LTED), 2 ovarian cancer (OVCAR3, A2780), 2 lung cancer (A549, H69AR), and 1 brain cancer (SNB-75) cell lines harboring ≥1 additional copy of chr1q (supplemental Figure 7B). Cell viability assays revealed sensitivity of all cell lines to T417 at low micromolar concentrations (4-28 μΜ), whereas no significant toxicity was detected upon treatment with the inactive analog/prodrug compound DHP52 in 2 myeloma and 2 ovarian cancer cell lines (Figure 6B; supplemental Figure 7C). In addition, cell cycle analysis revealed significant depletion of the G2/M phase, together with G0/1 phase arrest, upon T417 treatment in all tested cell lines (Figure 6C). mRNA levels of FOXM1, NEK2, and E2F2 were decreased significantly in almost all 11 cell lines upon treatment with T417, as assessed by RT-qPCR (Figure 6D). Interestingly, a significant decrease in PBX1 mRNA itself was also detected in 8 of 11 cell lines. This, in conjunction with the binding of PBX1 to its own promoter and putative enhancer, is consistent with a potential mechanism of PBX1 transcriptional autoregulation (Figure 4B) that would potentiate activity of T417 in chr1q-amp cells. Next, using a subcutaneous xenograft myeloma model, we also validated the antimyeloma activity of T417 in vivo. We observed significantly reduced tumor size and weight in T417-treated mice vs control mice, and we also detected cell cycle arrest and mRNA depletion of PBX1-regulated genes in explanted myeloma cells (Figure 6E-G; supplemental Figure 7D-H). In addition, selective cytotoxicity of T417 was detected against PBX1-expressing primary chr1q-amp myeloma cells (X1-X3; n = 3), but not against nonamplified MM cells (X4, X5; n = 2) or normal donor PBBCs (n = 1) with undetectable levels of PBX1 mRNA (Figure 6G-H; supplemental Figure 7I-J).
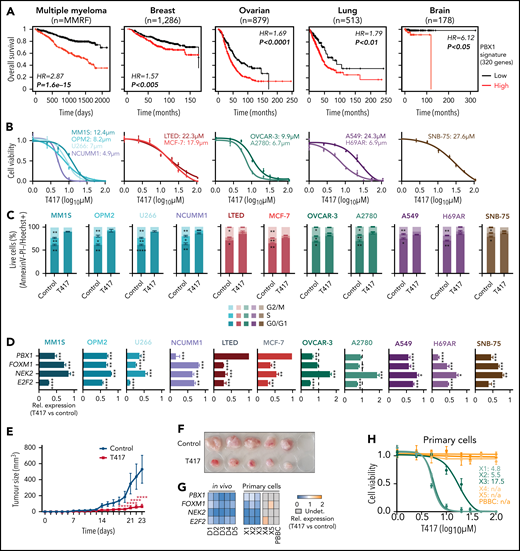
Selective targeting of chr1q-amp tumor cells with a selective PBX1 inhibitor. (A) Survival analysis of patients with MM or with breast, ovarian, lung, or brain cancer based on the PBX1 signature expression (red: high; black: low; n = 320 genes; supplemental Table 5). Kaplan-Meier plots and statistical analysis depict the significantly poorer survival of patients with an active PBX1 signature. (B) Cytotoxicity profiles (n = 3) of MM cells (MM.1S, OPM2, U266, NCU.MM1) and breast (MCF-7, LTED), ovarian (OVCAR-3, A2780), lung (A549, H69AR), and brain (SNB-75) cancer cell lines 48 hours after treatment with the small molecule PBX1 inhibitor T417. Three independent experiments were performed per cell line, and 50% inhibitory concentration (IC50) values were calculated using a nonlinear fitting model (fitting line represented here). (C) Cell cycle profiling of 11 cancer cell lines 48 hours after treatment with 1% DMSO (control) or T417 (20 μM). Three independent experiments were performed per cell line. Statistical comparisons were performed using a 2-way nonparametric analysis of variance (ANOVA) with a post hoc multiple-comparisons test. (D) Assessment of PBX1, FOXM1, NEK2, and E2F2 mRNA levels in 11 cancer cell lines 16 to 20 hours after treatment with 1% DMSO (control) or T417 (20 μM). Bar graphs illustrate transcriptional levels normalized to corresponding control samples (n = 3 replicates). Analysis was performed using a paired Student t test. (E) Tumor volumes of MM.1S xenografts measured in vehicle-treated (control) and T417-treated (10 mg/kg per injection) mice across experimental time points. Statistical analysis was performed using a 2-way ANOVA with a post hoc multiple-comparisons test. (F) Tumors explanted from control- and T417-treated mice at the termination of the study (day 23). (G) Heat map representation of PBX1, FOXM1, NEK2, and E2F2 mRNA levels assessed by RT-qPCR. For the in vivo experiment in tumor explanted cells, values represent pairwise comparisons of the T417 group (D1-D5) against the vehicle-treated group (C1-C5). For in vitro primary myeloma PC samples, values represent T417-treated (20 μM) vs control-treated (1% DMSO) cells. Gray boxes correspond to nonapplicable comparisons resulting from undetectable levels of mRNA in control-treated cells. (H) Cell viability of primary chr1q-amp MM (X1, X2, X3; green), nonamplified MM (X4, X5; orange), and normal donor PBBCs (orange) at 48 hours after treatment with 1% DMSO (control) or T417 (20 μM). Nonlinear data fitting and IC50 calculations were performed as described in (B). *P < .05; **P < .01; ***P < .001; ****P < .0001. HR, hazard ratio; n/a, not applicable (noncalculable); Rel., relative; Undet., undetermined.
Selective targeting of chr1q-amp tumor cells with a selective PBX1 inhibitor. (A) Survival analysis of patients with MM or with breast, ovarian, lung, or brain cancer based on the PBX1 signature expression (red: high; black: low; n = 320 genes; supplemental Table 5). Kaplan-Meier plots and statistical analysis depict the significantly poorer survival of patients with an active PBX1 signature. (B) Cytotoxicity profiles (n = 3) of MM cells (MM.1S, OPM2, U266, NCU.MM1) and breast (MCF-7, LTED), ovarian (OVCAR-3, A2780), lung (A549, H69AR), and brain (SNB-75) cancer cell lines 48 hours after treatment with the small molecule PBX1 inhibitor T417. Three independent experiments were performed per cell line, and 50% inhibitory concentration (IC50) values were calculated using a nonlinear fitting model (fitting line represented here). (C) Cell cycle profiling of 11 cancer cell lines 48 hours after treatment with 1% DMSO (control) or T417 (20 μM). Three independent experiments were performed per cell line. Statistical comparisons were performed using a 2-way nonparametric analysis of variance (ANOVA) with a post hoc multiple-comparisons test. (D) Assessment of PBX1, FOXM1, NEK2, and E2F2 mRNA levels in 11 cancer cell lines 16 to 20 hours after treatment with 1% DMSO (control) or T417 (20 μM). Bar graphs illustrate transcriptional levels normalized to corresponding control samples (n = 3 replicates). Analysis was performed using a paired Student t test. (E) Tumor volumes of MM.1S xenografts measured in vehicle-treated (control) and T417-treated (10 mg/kg per injection) mice across experimental time points. Statistical analysis was performed using a 2-way ANOVA with a post hoc multiple-comparisons test. (F) Tumors explanted from control- and T417-treated mice at the termination of the study (day 23). (G) Heat map representation of PBX1, FOXM1, NEK2, and E2F2 mRNA levels assessed by RT-qPCR. For the in vivo experiment in tumor explanted cells, values represent pairwise comparisons of the T417 group (D1-D5) against the vehicle-treated group (C1-C5). For in vitro primary myeloma PC samples, values represent T417-treated (20 μM) vs control-treated (1% DMSO) cells. Gray boxes correspond to nonapplicable comparisons resulting from undetectable levels of mRNA in control-treated cells. (H) Cell viability of primary chr1q-amp MM (X1, X2, X3; green), nonamplified MM (X4, X5; orange), and normal donor PBBCs (orange) at 48 hours after treatment with 1% DMSO (control) or T417 (20 μM). Nonlinear data fitting and IC50 calculations were performed as described in (B). *P < .05; **P < .01; ***P < .001; ****P < .0001. HR, hazard ratio; n/a, not applicable (noncalculable); Rel., relative; Undet., undetermined.
Overall, these findings highlight the efficacy of T417 against chr1q-amp cancer cells and its clinical potential as an adjuvant approach against chr1q-amp high-risk myeloma and other solid tumors.
Discussion
Recurrent high-frequency CNAs, such as chr1q-amp, are major oncogenic drivers shared across different types of cancer.1,-3 However, delineating the prognostic and functional role of hundreds to thousands of genes and downstream oncogenic pathways associated with specific CNAs for the development of targeted therapies remains an unmet challenge. In this study, we focused on chr1q-amp, the most frequent CNA linked to high-risk MM.4,-6,10
First, by combining WGS and 3D genome data we found that genetic amplification disrupts a large proportion of the chromatin structure throughout the chr1q arm. This level of disruption likely reflects the contributions of multiple mechanisms of structural changes in chr1q,46 including isochromosome formation,47 hypoxia-driven tandem duplications,48 jumping translocations,47 chromothripsis,49 chromoplexy,50 and combinations of the above.51 Nevertheless, we detected 4 main blocks of coamplification (hyperdomains) that are the product of distinct amplification patterns and retain their overall chromatin structure across patients with MM. Of those, only 2 hyperdomains (B1, B4) contribute to adverse prognosis and, therefore, have potential implications for chr1q-amp biology.
In contrast to previous studies that traditionally focused on the chr1q21 band alone,13,,,-17 we used a large-scale integrative analysis of clinical and multi-omics data sets to identify adverse prognosis driver genes across the whole chr1q arm. This analysis validated previously reported high-risk markers in the chr1q21 locus,13,,-16 as well as linked novel genes to adverse prognosis and highlighted the biological and prognostic significance of 2 other new areas: the chr1q22 and chr1q23.3 bands. Collectively, the adverse prognosis genes identified across chr1q are predicted to promote cell cycle and proliferation, suggesting their direct involvement in the well-characterized proliferative phenotype associated with chr1q-amp in MM.17,43
Identification of PBX1, located in 1q23.3, as a prominent candidate driver of high-risk disease in chr1q-amp MM, also exemplifies the potential of our approach for biological discovery. Indeed, the role of PBX1 in promoting cancer cell survival, metastasis, and drug resistance has been reported previously in other types of cancer.35,-37,52 In addition, previous in silico work predicted a role for PBX1 in the biology of t(4;14) myeloma,53 which, interestingly, is highly associated with chr1q-amp.6 Here, we found ectopic expression of PBX1 in chr1q-amp myeloma cells associated with genetic amplification and strong epigenetic activation of its entire TAD (including proximal and distal DNA elements), suggesting a selective process acting on a whole regulatory domain rather than the gene alone, as previously suggested in oncogenesis.54 Moreover, our combined genetic, epigenetic, and pharmacological approaches establish the mechanisms and regulatory networks through which PBX1 regulates the activity of FOXM1, a master TF promoting cell cycle progression.40,42 The proliferative circuitries regulated by PBX1 and the PBX1-FOXM1 axis are of wider importance in cancer, because they exert a powerful prognostic impact on several types. Pertinently, as well as in MM, chr1q-amp is one of the most frequent CNAs in other cancers, including breast and ovarian cancers.35,-37
The finding that pharmacological abrogation of the PBX1-FOXM1 axis selectively impacts survival of chr1q-amp myeloma cells is another notable finding of this work. As well as providing proof-of-principle for developing CNA-specific therapeutic approaches, our data strongly support the central role of PBX1 and FOXM1 in regulating the transcriptional program driving the proliferative phenotype and adverse prognosis in chr1q-amp MM. In addition, these findings support our recent efforts for the development of T417, a small molecule inhibitor of PBX1 binding to its cognate DNA motif,45 and suggest the potential benefit of its use in MM and other cancers with chr1q-amp and PBX1 overexpression. Indeed, along with our previously reported preclinical activity of T417 against ovarian cancer,45 the data herein demonstrate selective targeting against MM cells, as well as breast, lung, liver, and brain cancer cells, with chr1q-amp. These findings validate the presence of a common PBX1-FOXM1 axis underlying chr1q-amp that is active in many types of cancer and provide the basis for clinical development of T417 as a therapy targeting chr1q-amp.
In summary, we showed that our systems medicine dissection of CNA in cancer, which includes integration of genetic, epigenetic, transcriptional, and 3D-chromatin profiles, is a powerful strategy to identify genes and cellular oncogenic pathways of biological significance and clinical impact. Through this process, we demonstrated that ectopically expressed PBX1, in co-operation with FOXM1, is a critical driver of the proliferative phenotype in chr1q-amp MM and several other cancers and provided proof-of-principle supporting selective therapeutic targeting of chr1q-amp, the most prevalent CNA in MM and in cancer in general.
Acknowledgments
The authors thank Ichiro Hanamura (Aichi Medical University, Nagakute, Aichi, Japan) for providing the NCU.MM1 myeloma cell line, Sadaf Ghaem-Maghami (Imperial College London) for providing the OVCAR3 and A2780 cell lines, and Udayakumar Achandira (Hammersmith Hospital) for advice and assistance with MMCL FISH analysis.
N.T., V.S.C., X.X., and K.P. were supported by Bloodwise (Blood Cancer UK), and A. Katsarou was supported by the Kay Kendall Leukaemia Fund and the Imperial NIHR Biomedical Research Centre. The authors also acknowledge support from the LMS/NIHR Flow Cytometry Facility, the Imperial NIHR Biomedical Research Centre Genomics Facility, the Imperial NIHR Biomedical Research Centre, and the Cancer Research UK Experimental Cancer Medicine Centre.
Authorship
Contribution: N.T. designed the study, conceived and implemented computational pipelines, and designed and performed experiments; A. Katsarou, K.P., Y.-A.S., I.V.K., V.S.C., B.B., K.K., and P.M.R.S. performed experiments; X.X. assisted with analysis of bioinformatics data; P.R. and K.N.N. performed and interpreted immunohistochemical analyses; R.M.S. assisted with analysis of clinical informatics data; A.C. and H.W.A. provided clinical samples; I.A.G.R., T.-L.W., L.M., and N.T. wrote the manuscript; and V.S.C. and A. Karadimitris designed and supervised the study and wrote the first draft of the manuscript. All authors contributed to the final draft of the manuscript.
Conflict-of-interest disclosure: The authors declare no competing financial interests.
Correspondence: Nikolaos Trasanidis, Room 4S10, Commonwealth Building, Hammersmith Campus, Imperial College London, Du Cane Road, London W12 0NN, United Kingdom; e-mail: nikolaos.trasanidis12@imperial.ac.uk; Valentina S. Caputo, Room 4S10, Commonwealth Building, Hammersmith Campus, Imperial College London, Du Cane Road, London W12 0NN, United Kingdom; e-mail: v.caputo@imperial.ac.uk; and Anastasios Karadimitris, Room 4S10C, Commonwealth Building, Hammersmith Campus, Imperial College London, Du Cane Road, London W12 0NN, United Kingdom; e-mail: a.karadimitris@imperial.ac.uk.
The high-throughput sequencing data reported in this article have been deposited in the Gene Expression Omnibus database (accession numbers GSE165060 and GSE153381).
Data sharing requests should be sent to Nikolaos Trasanidis (nikolaos.trasanidis12@imperial.ac.uk).
The online version of this article contains a data supplement.
There is a Blood Commentary on this article in this issue.
The publication costs of this article were defrayed in part by page charge payment. Therefore, and solely to indicate this fact, this article is hereby marked “advertisement” in accordance with 18 USC section 1734.
