

Key Points
Quantitative, mutational, and fragmentation features in the ctDNA dynamically predict treatment responses and survival.
ctDNA captures the complete lymphoma ecosystem that extends beyond tumor biopsies, imaging, and clinical estimates.

Abstract
Inadequate molecular and clinical stratification of the patients with high-risk diffuse large B-cell lymphoma (DLBCL) is a clinical challenge hampering the establishment of personalized therapeutic options. We studied the translational significance of liquid biopsy in a uniformly treated trial cohort. Pretreatment circulating tumor DNA (ctDNA) revealed hidden clinical and biological heterogeneity, and high ctDNA burden determined increased risk of relapse and death independently of conventional risk factors. Genomic dissection of pretreatment ctDNA revealed translationally relevant phenotypic, molecular, and prognostic information that extended beyond diagnostic tissue biopsies. During therapy, chemorefractory lymphomas exhibited diverging ctDNA kinetics, whereas end-of-therapy negativity for minimal residual disease (MRD) characterized cured patients and resolved clinical enigmas, including false residual PET positivity. Furthermore, we discovered fragmentation disparities in the cell-free DNA that characterize lymphoma-derived ctDNA and, as a proof-of-concept for their clinical application, used machine learning to show that end-of-therapy fragmentation patterns predict outcome. Altogether, we have discovered novel molecular determinants in the liquid biopsy that can noninvasively guide treatment decisions.
Introduction
Genomic interrogation of circulating tumor DNA (ctDNA) provides clinically applicable and minimally invasive tools to profile cancers, including B-cell lymphomas.1-3 Large B-cell lymphomas (LBCLs) are a heterogeneous group of cancers, of which diffuse large B-cell lymphoma (DLBCL) is the most common entity.4 In response to rituximab, cyclophosphamide, doxorubicin, vincristine, and prednisone (R-CHOP), 30% to 40% of the DLBCLs progress, resulting in high risk of death.5 Despite improved insights to decompose the biological and clinical complexity of DLBCL,6-10 neither subtype-targeted11,12 nor risk-adapted13 interventions have been established to be superior to R-CHOP, and the early identification of refractory patients remains inaccurate.14,15 Inadequate dismantling of clinical and biological heterogeneity remains the main obstacle for improving outcomes in response to novel therapies, and there is a need for new clinically applicable tools to stratify patients with DLBCL more accurately. Here, precision medicine applications utilizing ctDNA are anticipated.
Cell-free DNA (cfDNA) has tremendous clinical potential as a liquid biopsy.16,17 Besides opening avenues for molecularly targeted treatments,18,19 the burden and kinetics measured in ctDNA concentration are of great interest for their clinical value. Pretreatment ctDNA burden has been reported as a surrogate for tumor burden with prognostic information in DLBCL.19-21 Furthermore, early detection of refractoriness with dynamic measurements of ctDNA during therapy could lay the foundations for molecular response-adapted treatment decisions.2,3,22-24 Albeit compelling, these early results have been obtained from heterogeneous patient cohorts treated with diverse therapies and utilizing plasma and/or serum samples.2,18,19,24,25 To date, the clinical value of ctDNA-based analyses has not been evaluated in the context of clinical trial patients with aggressive B-cell lymphoma and uniform therapy.
Despite the plethora of somatic events in the B-cell lymphoma genome, most of the ctDNA does not contain mutational information. Another approach that has proven to be useful in solid tumors is based on the analysis of cfDNA fragmentation patterns.26,27 Upon its release mainly from apoptotic cells, cfDNA is fragmented, and nucleosomes, transcription factors, and other DNA-binding proteins prevent this cleavage, resulting in specific patterns of fragmentation. These fragmentation profiles reflect chromatin proteome occupancy maps and epigenetic fingerprints that can be used to detect and determine molecular profiles of cancer.26,28,29 So far, these fragmentation landscapes and their potential clinical utility have remained unexplored in B-cell lymphomas.
Here, we have dissected the molecular determinants within the ctDNA that resolve heterogeneity and characterize trial patients with poor outcomes. We show how pretreatment ctDNA reflects the ecosystem of clinical disease and lymphoma biology that extends beyond conventional measures and tumor biopsies. We describe and use ctDNA hypermutation patterns and fragmentation disparities to show how complementary dynamic analysis of ctDNA accurately determines treatment responses and predicts survival. Taken together, we uncover novel features in the lymphoma ctDNA that we anticipate resulting in novel tools to noninvasively guide future treatment decisions.
Materials and methods
Patients and samples
The correlative study included 101 patients (aged 18 to 65) with high-risk (age-adjusted International Prognostic Index [aaIPI 2-3] and/or site-specific risk factors for central nervous system [CNS] recurrence) primary LBCL treated uniformly in a Nordic LBC-05 phase 2 trial (NCT01325194) (supplemental Table 1).30 Plasma samples were collected according to the study protocol prior to therapy and at response evaluations (after 3 cycles and posttherapy) (Figure 1A). Additionally, 4 relapse plasma samples and 9 healthy controls were included. Diagnostic tumor tissue was available for sequencing from 39 patients. Matched whole-blood samples were used as germline controls for variant calling.
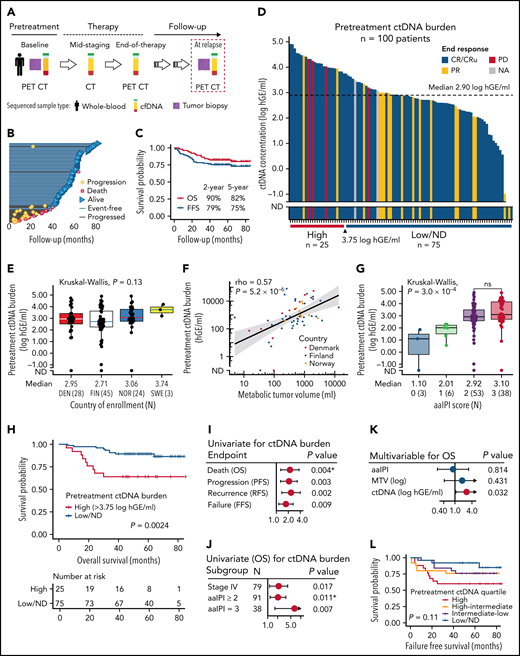
Clinicopathological features and prognostic impact of pretreatment ctDNA burden in trial patients with high-risk demographics. (A) Sample collection and radiological imaging according to the study protocol. (B) Swimmers plot of the individual patients and their follow-up in the study. Median follow-up time was 61 months. (C) Kaplan-Meier survival estimates for OS (red) and FFS (blue) for the study cohort of 101 patients. (D) Waterfall plot of the pretreatment ctDNA burden (concentration) measured in 100 patients. Color fills of the plot represent end-of-therapy responses according to PET-CT. Below, the cut-point for high ctDNA burden identified by random sampling of the cohort. (E,G) Box plots of pretreatment ctDNA burden according to (E) different countries of study enrollment and (G) age-adjusted international prognostic index (aaIPI). Note the similar levels between study countries in (E) suggesting similar preanalytical factors affecting the measurements. Below the plots, median ctDNA burden and numbers of patients per group are reported. (F) Dot plot showing the correlation between radiologically measured metabolic tumor volume (x-axis, MTV, mL) and pretreatment ctDNA burden (y-axis, hGE/mL). Logarithmic scales on both axes. Spearman correlation. Dot colors represent countries of enrollment. (H) Kaplan-Meier survival estimate for OS according to high pretreatment ctDNA burden threshold identified by bootstrapping the cohort. Log-rank test. (I-K) Forest plots of Cox-proportional hazard model hazard ratios, 95% coincidence intervals, and P values. Asterisk denotes Cox proportional hazards assumption violation. (I) Univariate model of pretreatment ctDNA burden for different clinical endpoints. (J) Univariate models for OS according to pretreatment ctDNA burden (log hGE/mL) stratified according to different clinical high-risk subgroups. (K) Multivariable model for OS according to pretreatment ctDNA burden, aaIPI, and MTV. (L) Kaplan-Meier survival estimate for FFS according to different pretreatment ctDNA burden quartiles. Four-way log-rank test. ND, not detected; OS, overall survival; PFS, progression-free survival; RFS, recurrence-free survival; FFS, failure-free survival (defined as a time period between the date of trial entry and the last date of follow-up or the date of progression, lack of response, death for any reason, or discontinuation/change of therapy because of toxicity); DEN, Denmark; FIN, Finland; NOR, Norway; SWE, Sweden.
Clinicopathological features and prognostic impact of pretreatment ctDNA burden in trial patients with high-risk demographics. (A) Sample collection and radiological imaging according to the study protocol. (B) Swimmers plot of the individual patients and their follow-up in the study. Median follow-up time was 61 months. (C) Kaplan-Meier survival estimates for OS (red) and FFS (blue) for the study cohort of 101 patients. (D) Waterfall plot of the pretreatment ctDNA burden (concentration) measured in 100 patients. Color fills of the plot represent end-of-therapy responses according to PET-CT. Below, the cut-point for high ctDNA burden identified by random sampling of the cohort. (E,G) Box plots of pretreatment ctDNA burden according to (E) different countries of study enrollment and (G) age-adjusted international prognostic index (aaIPI). Note the similar levels between study countries in (E) suggesting similar preanalytical factors affecting the measurements. Below the plots, median ctDNA burden and numbers of patients per group are reported. (F) Dot plot showing the correlation between radiologically measured metabolic tumor volume (x-axis, MTV, mL) and pretreatment ctDNA burden (y-axis, hGE/mL). Logarithmic scales on both axes. Spearman correlation. Dot colors represent countries of enrollment. (H) Kaplan-Meier survival estimate for OS according to high pretreatment ctDNA burden threshold identified by bootstrapping the cohort. Log-rank test. (I-K) Forest plots of Cox-proportional hazard model hazard ratios, 95% coincidence intervals, and P values. Asterisk denotes Cox proportional hazards assumption violation. (I) Univariate model of pretreatment ctDNA burden for different clinical endpoints. (J) Univariate models for OS according to pretreatment ctDNA burden (log hGE/mL) stratified according to different clinical high-risk subgroups. (K) Multivariable model for OS according to pretreatment ctDNA burden, aaIPI, and MTV. (L) Kaplan-Meier survival estimate for FFS according to different pretreatment ctDNA burden quartiles. Four-way log-rank test. ND, not detected; OS, overall survival; PFS, progression-free survival; RFS, recurrence-free survival; FFS, failure-free survival (defined as a time period between the date of trial entry and the last date of follow-up or the date of progression, lack of response, death for any reason, or discontinuation/change of therapy because of toxicity); DEN, Denmark; FIN, Finland; NOR, Norway; SWE, Sweden.
Sequencing and ctDNA analysis
A custom capture-based gene panel targeting the most common lymphoma driver genes, regions of somatic hypermutations, and immunoglobulin loci was used to detect ctDNA (supplemental Table 2). Target-enriched libraries from patients were sequenced to a median deduplicated depth 1557× with HiSeq2500 (Illumina) (supplemental Figure 1A-B). Additionally, whole-genome sequencing (WGS) (depth ∼10×) was performed for 8 overlapping pretreatment cfDNA libraries on the Novaseq6000 (Illumina) instrument.
ctDNA was quantified in log10-transformed haploid genome equivalents per mL of plasma (log10 hGE/mL), assuming 1 haploid genome weighs 3.3 picograms. The presence of ctDNA or minimal residual disease (MRD) was evaluated in tumor genotyped pretreatment samples and follow-up samples using an in-house developed R-package ‘ctDNAtools’ that utilizes an established Monte Carlo framework31 for testing MRD incorporating variant phasing patterns.32 MRD test was calibrated to 95% specificity using withheld healthy control cfDNA samples, and ctDNA detection was based on the MRD test positivity. Molecular responses were measured as log10-transformed fold-changes in ctDNA quantities between consecutive samples. Fragment length data were extracted from aligned sequencing data using the ‘ctDNAtools’ R-package. Detailed methodology is provided in the supplemental Methods.
Data can be found under accession number EGAS00001005835.
Statistical analysis
Statistical details accompany presented results in text, figure legends, figures, and supplemental results. P values < .05 were considered significant and significance of is indicated in figures as follows: ns, P ≥ .05; *P < .05; **P < .01; ***P < .001; ****P < .0001.
Results
Pretreatment ctDNA level reveals concealed heterogeneity and different outcomes behind conventional risk groups
We detected ctDNA in the pretreatment plasma samples in 97 of 100 (97%) patients (Figure 1A-D; supplemental Figure 1; supplemental Tables 1-4). The quantified levels were comparable with the high-risk patient demographics reported previously in DLBCL19,24 and similar between different countries (Figure 1E).
Elevated pretreatment ctDNA burden was associated with high metabolic tumor volume (MTV) and total lesion glycolysis (Figure 1F; supplemental Figure 2A). aaIPI and CNS-IPI were positively associated with ctDNA levels, but the levels did not differ between the patients with higher risk scores (Figure 1G; supplemental Figure 2B). Advanced stage, elevated lactate dehydrogenase and bone marrow involvement were associated with higher ctDNA levels, whereas age, poor performance status, bulky disease, or the presence of B-symptoms at diagnosis were not ( supplemental Figure 2C-I). The patients whose lymphoma was diagnosed from a needle biopsy had higher ctDNA levels than the patients diagnosed from a surgical biopsy (supplemental Figure 2J). ctDNA levels were similar between different histopathological entities and molecular subtypes (supplemental Figure 3A-D). Taken together, pretreatment ctDNA burden represents an accurate measure of tumor burden that reveals substantial heterogeneity in the trial patients with predefined high-risk inclusion criteria.
High pretreatment ctDNA burden translated to poor outcome on all measured endpoints (Figure 1H-I; supplemental Figure 4A-B; supplemental Table 5). Clinical risk factors were not associated with outcome, whereas the dismal impact of high ctDNA burden was evident also among the patients with advanced-stage or elevated aaIPI (Figure 1J; supplemental Figure 4C; supplemental Table 5). In multivariable analyses, the survival impact was independent of MTV, aaIPI, and CNS-IPI (Figure 1K; supplemental Figure 4D; supplemental Table 5). Together, these findings confirm the clinical significance of pretreatment ctDNA burden that extends beyond the established clinical risk groups.
Although high ctDNA level was a strong predictor for overall survival (OS), treatment failures were also recorded in the patients with low ctDNA burden (Figure 1L). However, while the fraction of lymphoma-related failures regressed per decreasing pretreatment ctDNA quartile, nonlymphoma related failures were more common among the patients with lower burden (supplemental Figure 5). The accumulation of nonlymphoma-related failures, including 3 treatment-related acute myeloid leukemias in the patients with below-median pretreatment ctDNA levels, suggests that dose deescalation could provide a clinical benefit for this subgroup.
Temporal analysis of ctDNA uncovers clinically meaningful molecular responses
To understand how treatment responses and clinical challenges are reflected by ctDNA kinetics during a uniform therapy, we interrogated the plasma samples collected at response evaluations for the presence of MRD (Figure 2A; supplemental Figure 6A-E). We compared the results with computer tomography (CT) and positron emission tomography (PET)-CT-based responses and outcomes.
![Molecular responses in ctDNA during therapy. (A) Line graph showing the dynamic changes in the ctDNA concentration (y-axis) incorporated with temporal MRD test results in the patients with midstaging plasma samples available. Colors of the lines represent different clinical courses. Numbers for the patients with relapse samples available indicate months from diagnosis. (B) Waterfall plot of quantified molecular responses (log10-transformed fold-change in ctDNA concentration, y-axis) after 3 cycles of therapy. Patients (columns, x-axis) arranged according to responses and MRD test results. Bar colors represent midstaging responses according to CT-scan. (C) Crosstabulation of midstaging MRD and CT-scan results. (D) Kaplan-Meier survival estimate for failure-free survival (FFS) according to MRD test results at midstaging. (E) Waterfall plot of the quantified molecular responses between midstaging and endstaging plasma samples (log10-transformed fold-change in ctDNA concentration, y-axis) in evaluable patients (x-axis, n = 53). Patients with MRDend- shown with an arbitrary negative value for fold-change. Patients deemed MRD-negative at midstaging and MRD-positive at endstaging are not included. Bar colors represent end-of-therapy responses according to PET-CT. (F) Kaplan-Meier survival estimate for FFS according to end-of-treatment MRD test result. (G,H) Dot plots representing end-of-treatment MRD test results and ctDNA concentration (y-axis) per patient according to (G) end-of-therapy response evaluation results from PET-CT (Deauville score [D-S]) and (H) whether a PET-avid lesion was tissue biopsied after therapy. Numbers of patients are shown in parenthesis, and black dots with red borders indicate patients who experienced lymphoma progression during follow-up. (G) Crosstabulation below the plot shows the number of patients according to D-S and MRD test results. (H) Round shape of dots denotes biopsies negative for viable lymphoma (9 of 10), and the triangle denotes the only patient with tissue biopsy deemed positive for lymphoma. Tissue-biopsied cases who relapsed during follow-up are annotated for their end-of-therapy PET-CT responses. MRD, minimal residual disease; CR/CRu, complete response (unconfirmed); PR, partial response; PD, progressive disease.](https://ash.silverchair-cdn.com/ash/content_public/journal/blood/139/12/10.1182_blood.2021012852/3/m_bloodbld2021012852f2.png?Expires=1769084790&Signature=skftlIKW-dMlqb6WZF1ZoaaH5E062MeKgkly~ARWtr4YO-Tp38bWu4qRcYH7ycWl8Ug~gOwh9-NubX707M8wu93SaHzfOTSDl~Mjf8~xoHKrtPcBQf3MFajV~aW2A7wOiVWTpTw6Kcy80AKwH2Ns~05N6OYWCud5poodPWlWXVjjtn80m5WZ884-BrJNiA2An1dDcqWoe0vqeGDqZcthegAeQy9cfJgC8ztBzbyrWzf5ixUFt4LCvSvH~Uv5IYC3M9B-Wn1PMcd~A1SexksojTFGdcpYqUSabiqIbuGpKMcoZHAFdYJlY1v9hIW6HcRhWHuv-ygEJjITqQzjN8MhZA__&Key-Pair-Id=APKAIE5G5CRDK6RD3PGA)
Molecular responses in ctDNA during therapy. (A) Line graph showing the dynamic changes in the ctDNA concentration (y-axis) incorporated with temporal MRD test results in the patients with midstaging plasma samples available. Colors of the lines represent different clinical courses. Numbers for the patients with relapse samples available indicate months from diagnosis. (B) Waterfall plot of quantified molecular responses (log10-transformed fold-change in ctDNA concentration, y-axis) after 3 cycles of therapy. Patients (columns, x-axis) arranged according to responses and MRD test results. Bar colors represent midstaging responses according to CT-scan. (C) Crosstabulation of midstaging MRD and CT-scan results. (D) Kaplan-Meier survival estimate for failure-free survival (FFS) according to MRD test results at midstaging. (E) Waterfall plot of the quantified molecular responses between midstaging and endstaging plasma samples (log10-transformed fold-change in ctDNA concentration, y-axis) in evaluable patients (x-axis, n = 53). Patients with MRDend- shown with an arbitrary negative value for fold-change. Patients deemed MRD-negative at midstaging and MRD-positive at endstaging are not included. Bar colors represent end-of-therapy responses according to PET-CT. (F) Kaplan-Meier survival estimate for FFS according to end-of-treatment MRD test result. (G,H) Dot plots representing end-of-treatment MRD test results and ctDNA concentration (y-axis) per patient according to (G) end-of-therapy response evaluation results from PET-CT (Deauville score [D-S]) and (H) whether a PET-avid lesion was tissue biopsied after therapy. Numbers of patients are shown in parenthesis, and black dots with red borders indicate patients who experienced lymphoma progression during follow-up. (G) Crosstabulation below the plot shows the number of patients according to D-S and MRD test results. (H) Round shape of dots denotes biopsies negative for viable lymphoma (9 of 10), and the triangle denotes the only patient with tissue biopsy deemed positive for lymphoma. Tissue-biopsied cases who relapsed during follow-up are annotated for their end-of-therapy PET-CT responses. MRD, minimal residual disease; CR/CRu, complete response (unconfirmed); PR, partial response; PD, progressive disease.
Molecular responses in ctDNA during therapy. (A) Line graph showing the dynamic changes in the ctDNA concentration (y-axis) incorporated with temporal MRD test results in the patients with midstaging plasma samples available. Colors of the lines represent different clinical courses. Numbers for the patients with relapse samples available indicate months from diagnosis. (B) Waterfall plot of quantified molecular responses (log10-transformed fold-change in ctDNA concentration, y-axis) after 3 cycles of therapy. Patients (columns, x-axis) arranged according to responses and MRD test results. Bar colors represent midstaging responses according to CT-scan. (C) Crosstabulation of midstaging MRD and CT-scan results. (D) Kaplan-Meier survival estimate for failure-free survival (FFS) according to MRD test results at midstaging. (E) Waterfall plot of the quantified molecular responses between midstaging and endstaging plasma samples (log10-transformed fold-change in ctDNA concentration, y-axis) in evaluable patients (x-axis, n = 53). Patients with MRDend- shown with an arbitrary negative value for fold-change. Patients deemed MRD-negative at midstaging and MRD-positive at endstaging are not included. Bar colors represent end-of-therapy responses according to PET-CT. (F) Kaplan-Meier survival estimate for FFS according to end-of-treatment MRD test result. (G,H) Dot plots representing end-of-treatment MRD test results and ctDNA concentration (y-axis) per patient according to (G) end-of-therapy response evaluation results from PET-CT (Deauville score [D-S]) and (H) whether a PET-avid lesion was tissue biopsied after therapy. Numbers of patients are shown in parenthesis, and black dots with red borders indicate patients who experienced lymphoma progression during follow-up. (G) Crosstabulation below the plot shows the number of patients according to D-S and MRD test results. (H) Round shape of dots denotes biopsies negative for viable lymphoma (9 of 10), and the triangle denotes the only patient with tissue biopsy deemed positive for lymphoma. Tissue-biopsied cases who relapsed during follow-up are annotated for their end-of-therapy PET-CT responses. MRD, minimal residual disease; CR/CRu, complete response (unconfirmed); PR, partial response; PD, progressive disease.
After 3 therapy cycles, 36% (21 of 58) of the samples were positive for MRD (MRDmid+) (Figure 2A-B; supplemental Figure 7A). Patients with MRDmid+ were characterized by a lower rate of complete responses (CR) according to midstaging CT in comparison with MRD-negative cases (MRDmid-) (Figure 2C). MRDmid- translated to a favorable trend toward better survival, whereas CT-based CR did not (Figure 2D; supplemental Figure 7B-F). Notably, refractory patients were characterized by MRDmid+ and elevated ctDNA levels at midstaging (≥median) (supplemental Figure 7G). Although limited by sample size, these data suggest that ctDNA evaluation at midstaging could be a feasible tool to identify patients with favorable responses and outcomes.
At the end-of-therapy response evaluation, ctDNA was detected in 14% (10 of 71, MRDend+) of the patients with extremely poor outcomes, and primary refractory diseases were characterized by a rebound in ctDNA concentration (Figure 2E-F; supplemental Figure 8A-E). In contrast, only 5 of the 18 patients with PET positivity experienced progression (PET+, Deauville score = 4 to 5), among whom MRDend+ could predict 4 of the 5 progressions with 100% specificity (Figure 2G; supplemental Figure 8F-H). Additionally, 10 patients underwent confirmatory biopsies from their ambiguous fluorodeoxyglucose-avid lesions, among whom MRD positivity could capture the only patient with biopsy-confirmed progression (9 tissue biopsies negative for viable lymphoma) (Figure 2H). Taken together, these data confirm the prognostic impact of MRD measurements and demonstrate how end-of-therapy examination of ctDNA could be used to complement the poor specificity of PET-CT in response evaluation.
Disparities in fragmentation distinguish lymphoma ctDNA and provide a mutation-independent relapse predictor
Measuring ctDNA quantities, kinetics, and MRD relies on the detection of somatic mutations. To explore mutation-independent translational utilities of ctDNA, we dissected the fragmentation landscapes captured by our study. First, by comparing the fragment profiles captured by WGS and our targeted approach in 8 overlapping pretreatment plasma samples, we confirmed that target enrichment does not distort fragment length patterns that depend on the genomic regions analyzed (supplemental Figure 9).
Pooled analysis of the pretreatment fragmentation data revealed that fragment size distributions differed between the fragments bearing mutant and reference sequences (Figure 3A). Mutated fragments were, in general, shorter, favoring submononucleosomal and subdinucleosomal lengths, and they were more enriched for dinucleosomal lengths than their reference counterparts (Figure 3A; supplemental Figure 10A). As expected, within a few patients with exceptionally high variant allele frequencies, the fragment profiles of mutated and wild-type (WT) fragments were nearly identical, as most of their cell-free DNA was lymphoma-derived (supplemental Figure 10B). Similar differences were detected between healthy controls and patient samples at diagnosis (supplemental Figure 10C). Together these data show that lymphoma ctDNA and other cfDNA fragments in plasma differ for their composition of fragment lengths.
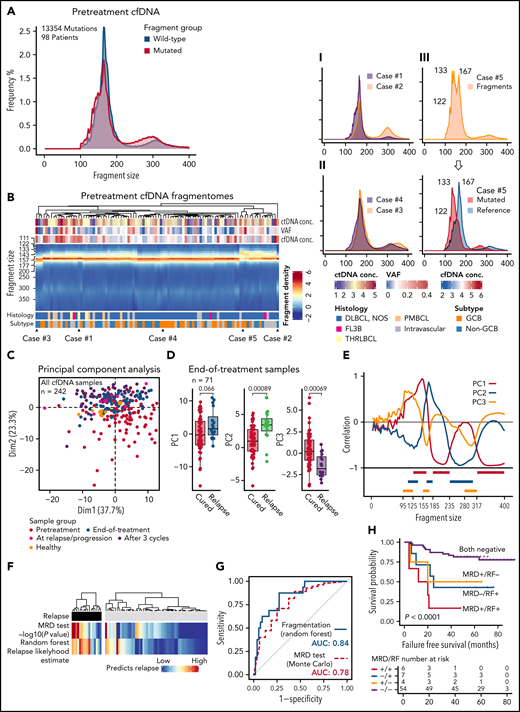
Fragmentation landscapes of cell-free DNA reveal lymphoma-related disparities and provide a mutation-independent relapse predictor in end-of-therapy samples. (A) Histograms demonstrating differences in fragment length distribution between mutated (red) and wild-type (WT, blue) fragments in pretreatment plasma samples from all the patients with single nucleotide variants detected and pretreatment cfDNA sample available. (B) Heatmap showing fragment density according to fragment length (y-axis) in all pretreatment cfDNA profiles (x-axis). Examples of different patterns are demonstrated on the right with smoothened histograms. I: Case#1 with prominent mononucleosomal pattern vs Case#2 with the most prominent dinucleosomal pattern. II: Case#3 histogram favoring longer fragment lengths (perinucleosomal) vs Case#4 histogram favoring shorter fragment lengths (subnucleosomal). III: Case#5 with bifurcation of the mononucleosomal fragments that reflect the difference between mutated and WT fragments (histogram below; red, mutated fragments; blue, reference sequence fragments). (C) Scatterplot of the first 2 dimensions of the principal component analysis (PCA) of fragment profiles with all the cfDNA samples in the study. Colors of the dots represent sample groups indicated in the legend below. (D) Box plots demonstrate the differences in the first 3 components of the PCA between cured and relapsing patients in the end-of-therapy plasma samples. (E) Line graph showing correlation of the first 3 components with fragment size histogram. Below: 9 histogram bin size windows selected based on their correlation with fragment size and mutually exclusive pattern with each other. (F) Heatmaps demonstrate the concordance between the 2 independent predictors of recurrence among the relapsing and nonrelapsing patients. Monte Carlo, mutation-MRD-based relapse predictor with -log10 transformed P values; Random forest, classifier predictions for relapse likelihood 0% to 100%. (G) Receiver operating characteristics curves for the phasing-aware mutation-based (‘Monte Carlo’) and fragmentation-based (‘Random forest’) predictors for recurrence. AUC, area under curve. (H) Kaplan-Meier survival estimates for FFS according to the combined mutation-based MRD test and fragmentation-based random forest prediction results in the end-of-therapy plasma samples.
Fragmentation landscapes of cell-free DNA reveal lymphoma-related disparities and provide a mutation-independent relapse predictor in end-of-therapy samples. (A) Histograms demonstrating differences in fragment length distribution between mutated (red) and wild-type (WT, blue) fragments in pretreatment plasma samples from all the patients with single nucleotide variants detected and pretreatment cfDNA sample available. (B) Heatmap showing fragment density according to fragment length (y-axis) in all pretreatment cfDNA profiles (x-axis). Examples of different patterns are demonstrated on the right with smoothened histograms. I: Case#1 with prominent mononucleosomal pattern vs Case#2 with the most prominent dinucleosomal pattern. II: Case#3 histogram favoring longer fragment lengths (perinucleosomal) vs Case#4 histogram favoring shorter fragment lengths (subnucleosomal). III: Case#5 with bifurcation of the mononucleosomal fragments that reflect the difference between mutated and WT fragments (histogram below; red, mutated fragments; blue, reference sequence fragments). (C) Scatterplot of the first 2 dimensions of the principal component analysis (PCA) of fragment profiles with all the cfDNA samples in the study. Colors of the dots represent sample groups indicated in the legend below. (D) Box plots demonstrate the differences in the first 3 components of the PCA between cured and relapsing patients in the end-of-therapy plasma samples. (E) Line graph showing correlation of the first 3 components with fragment size histogram. Below: 9 histogram bin size windows selected based on their correlation with fragment size and mutually exclusive pattern with each other. (F) Heatmaps demonstrate the concordance between the 2 independent predictors of recurrence among the relapsing and nonrelapsing patients. Monte Carlo, mutation-MRD-based relapse predictor with -log10 transformed P values; Random forest, classifier predictions for relapse likelihood 0% to 100%. (G) Receiver operating characteristics curves for the phasing-aware mutation-based (‘Monte Carlo’) and fragmentation-based (‘Random forest’) predictors for recurrence. AUC, area under curve. (H) Kaplan-Meier survival estimates for FFS according to the combined mutation-based MRD test and fragmentation-based random forest prediction results in the end-of-therapy plasma samples.
Further exploration of the pretreatment samples revealed that there were also differences in the complete and mutated fragmentation patterns between the patients (Figure 3B, supplemental Figure 10D). Intriguingly, some pretreatment fragmentation patterns were characterized by a more prominent dinucleosomal abundance, whereas the others had a more prominent shift toward submono- and subdinucleosomal lengths (Figure 3B; Examples I and II). A small group of pretreatment samples was distinguished by an evident bifurcation of the mononucleosomal fragments that reflected the very short nature and high abundance of ctDNA fragments in these samples (Figure 3B; Example III). These findings establish that fragmentation patterns also differ between lymphoma patients.
To understand the disparities in fragmentation landscapes, we ran a principal component analysis (PCA) of the fragmentation profiles of all the cfDNA samples in our study (n = 242). Decomposition of fragmentation patterns revealed that the samples from different treatment phases differed for the major components in the PCA (Figure 3C; supplemental Figure 11A). Interestingly, we observed that the end-of-therapy cfDNA profiles of cured and relapsing patients differed for the major principal components (Figure 3D; supplemental Figure 11B-D). This led us to hypothesize that end-of-therapy fragmentation patterns contain information that could be used for mutation-free relapse prediction.
To pursue a predictor of progression by utilizing end-of-therapy fragmentation disparities, we extracted features for machine learning-based classifier from fragment density histograms in fragment size windows identified by their correlation with major principal components of the PCA (Figure 3E; supplemental Table 6). The classifier estimate for recurrence probability was in general concordant with the mutation-based MRD approach but disagreed for some patients, and in 5-fold crossvalidation, the classifier performance was even better than the MRD-based prediction (Figure 3F-G; supplemental Figure 11E-F). The independent methods complemented each other and together predicted the majority of the failures (Figure 3H; supplemental Figure 11G). Importantly, the fragment classifier could augment prediction in samples with borderline negative MRD results and PET positivity (supplemental Figure 11G-H). As a proof-of-principle, our discoveries demonstrate that mutation-independent means based on fragmentome disparities can complement mutation-based MRD detection in predicting survival.
Genomic dissection of pretreatment ctDNA reveals novel avenues to noninvasive phenotyping, risk-stratification, and understanding of spatial heterogeneity
Having learned how quantitative, kinetic, and structural features in ctDNA predict outcome in LBCL, we next sought to scrutinize the genetic content of ctDNA and its translational impact. First, we compared the mutational repertoires between concurrent liquid and tumor tissue biopsies at diagnosis (Figure 4A). The number of recorded mutations between tumor-educated and tumor-naive cases did not differ, and most mutations recorded in tumor tissue were also detected in plasma (Figure 4A; Case#1; supplemental Figure 12A-B). In some patients, however, we observed that the diagnostic biopsy represented a subclone diverged from the major systemic clone in the ctDNA (Figure 4A; Case#2). Importantly, in some relapsing patients, these site-specific or systemically subclonal mutations were not present in the subsequent relapse ctDNA or tissues (Figure 4B; supplemental Figure 12C-D). These data underline that a tissue biopsy may not mutation-wise represent the most clinically significant clone, which potentially compromises MRD measurements relying only on tumor-educated reporter mutations.
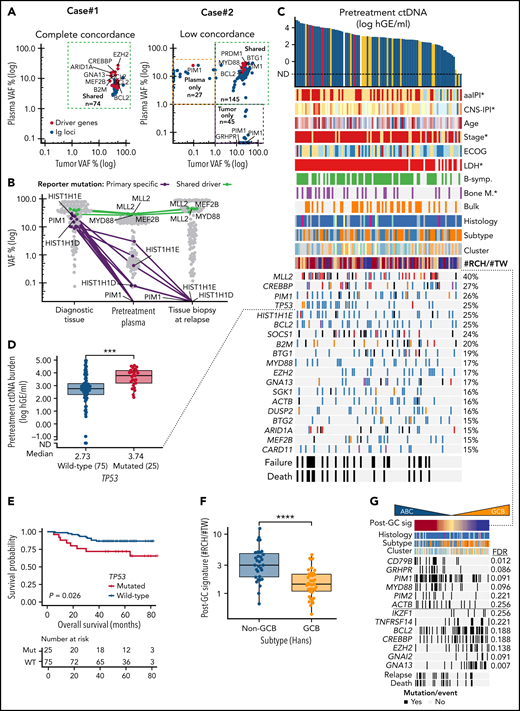
Noninvasive genotyping and genomic analysis of ctDNA at diagnosis. (A) Dot plots of somatic mutations according to their variant allele frequencies (VAF) in concurrent pretreatment plasma samples (y-axis) and diagnostic tumor biopsies (x-axis) in 2 patients. Case#1 with high concordance, Case#2 with spatial heterogeneity demonstrated with both plasma- and tumor-specific mutations in addition to shared mutations. Colors of dots indicate mutations in driver genes (red) and immunoglobulin targets (blue). (B) Dot and line graph tracking somatic reporter mutations in a patient with relapse tissue biopsy sequenced. Purple color denotes reporter mutations in the diagnostic tissue biopsy (driver genes labeled) that are subclonal or not detected in concurrent pretreatment plasma sample and not present in the consecutive relapse tissue. Green color and text annotations denote drivers shared by the diagnostic and relapse biopsies. Gray dots denote other indifferent reporter mutations between the samples. (C) Oncoprint of the coding driver mutation landscape according to pretreatment ctDNA concentration. Columns represent individual patients, and rows represent different clinical variables or driver genes. Genes mutated in ≥15% of the patients included, and the percentages are indicated. Asterisks in clinical factors denote a positive association with pretreatment ctDNA concentration. (D) Box plot demonstrating the difference in pretreatment ctDNA concentration between TP53-mutated and WT patients. (E) Kaplan-Meier curve for overall survival demonstrating the poor outcomes of patients with TP53 mutations in the ctDNA at diagnosis. (F) Box plot demonstrating the different abundance of mutations with RCH and TW hypermutation signatures (y-axis, post-GC signature, #RCH:#TW ratio) between GCB and non-GCB lymphomas according to Hans’ algorithm. (G) Oncoprint with patients arranged according to post-GC signature with driver genes associated with the signature. Driver genes with Wilcoxon rank-sum P values < .05 for association are shown. FDR, false discovery rate. (H) Forest plots of multivariable Cox-proportional hazard model hazard ratios, 95% coincidence intervals, and P values for progression-free survival (PFS). Post-GC signature (median cutoff, model #1) or CD79B mutation (model #2) and pretreatment ctDNA burden. (I) Oncoprint of genomic targets and genes most affected by somatic phased events (rows). Top annotation bar plot; sum of variants detected in-phase per patient (columns). (J) Box plot demonstrating the number of detected BCL2 mutations (y-axis) per patient according to BCL2 translocation status in the diagnostic biopsy according to FISH (x-axis). Break-apart probe detection. (K) Dot plot of somatic mutations and their VAF (y-axis) in pretreatment plasma sample of Case#3 with multiple subclonal BCL10 C-terminal truncating mutations (black dots and text annotation). Other driver events are annotated with text and green dots. Gray dots denote other somatic events. (L) Lollipop plot showing the location and VAFs of BCL10 targeting nonphased subclonal mutations. Below, a screenshot from interactive genomics viewer (IGV) showing the mutually exclusive nature of reads containing the mutations.
Noninvasive genotyping and genomic analysis of ctDNA at diagnosis. (A) Dot plots of somatic mutations according to their variant allele frequencies (VAF) in concurrent pretreatment plasma samples (y-axis) and diagnostic tumor biopsies (x-axis) in 2 patients. Case#1 with high concordance, Case#2 with spatial heterogeneity demonstrated with both plasma- and tumor-specific mutations in addition to shared mutations. Colors of dots indicate mutations in driver genes (red) and immunoglobulin targets (blue). (B) Dot and line graph tracking somatic reporter mutations in a patient with relapse tissue biopsy sequenced. Purple color denotes reporter mutations in the diagnostic tissue biopsy (driver genes labeled) that are subclonal or not detected in concurrent pretreatment plasma sample and not present in the consecutive relapse tissue. Green color and text annotations denote drivers shared by the diagnostic and relapse biopsies. Gray dots denote other indifferent reporter mutations between the samples. (C) Oncoprint of the coding driver mutation landscape according to pretreatment ctDNA concentration. Columns represent individual patients, and rows represent different clinical variables or driver genes. Genes mutated in ≥15% of the patients included, and the percentages are indicated. Asterisks in clinical factors denote a positive association with pretreatment ctDNA concentration. (D) Box plot demonstrating the difference in pretreatment ctDNA concentration between TP53-mutated and WT patients. (E) Kaplan-Meier curve for overall survival demonstrating the poor outcomes of patients with TP53 mutations in the ctDNA at diagnosis. (F) Box plot demonstrating the different abundance of mutations with RCH and TW hypermutation signatures (y-axis, post-GC signature, #RCH:#TW ratio) between GCB and non-GCB lymphomas according to Hans’ algorithm. (G) Oncoprint with patients arranged according to post-GC signature with driver genes associated with the signature. Driver genes with Wilcoxon rank-sum P values < .05 for association are shown. FDR, false discovery rate. (H) Forest plots of multivariable Cox-proportional hazard model hazard ratios, 95% coincidence intervals, and P values for progression-free survival (PFS). Post-GC signature (median cutoff, model #1) or CD79B mutation (model #2) and pretreatment ctDNA burden. (I) Oncoprint of genomic targets and genes most affected by somatic phased events (rows). Top annotation bar plot; sum of variants detected in-phase per patient (columns). (J) Box plot demonstrating the number of detected BCL2 mutations (y-axis) per patient according to BCL2 translocation status in the diagnostic biopsy according to FISH (x-axis). Break-apart probe detection. (K) Dot plot of somatic mutations and their VAF (y-axis) in pretreatment plasma sample of Case#3 with multiple subclonal BCL10 C-terminal truncating mutations (black dots and text annotation). Other driver events are annotated with text and green dots. Gray dots denote other somatic events. (L) Lollipop plot showing the location and VAFs of BCL10 targeting nonphased subclonal mutations. Below, a screenshot from interactive genomics viewer (IGV) showing the mutually exclusive nature of reads containing the mutations.
We next examined the driver gene landscape in the pretreatment ctDNA. As expected, the overall catalog of mutated driver genes in plasma represented the heterogeneous mutational landscape described in LBCLs (Figure 4C). We observed that high ctDNA burden arose from heterogeneous backgrounds, yet we recorded a striking association between TP53 mutations and high ctDNA levels and MTV (Figure 4D; supplemental Figure 12E). Consequently, TP53 mutations were identified as a surrogate for poor OS (Figure 4E). This finding reveals that some established biomarkers for dismal outcomes may interact with tumor burden at diagnosis.
To investigate phenotyping properties encoded in ctDNA, we studied the recorded mutational landscape for underlying patterns of driver genes and mutational signatures. Explorative analysis reproduced MCD/C5-like and EZB/C3-like DLBCL subgroups, and interestingly, distinguished 2 clusters enriched for T-cell/histiocyte-rich and primary mediastinal B-cell lymphomas, suggesting that genomic distinction of subtypes and histological entities can be achieved noninvasively (supplemental Figure 13A). Subsequently, we interrogated activation-induced cytidine deaminase (AID)-related hypermutation signatures that we have previously found to distinguish activated B-cell (ABC)- and germinal center B-cell (GCB)-like DLBCLs,33 and confirmed a striking difference in the abundance of RCH and TW signatures between these subtypes (Figure 4F; supplemental Figure 13B-E). As expected, ABC-related genomic drivers CD79B, PIM1, and GRHPR were enriched in lymphomas with RCH-enriched signature (henceforth post-GC signature), whereas G-protein signaling-related GCB drivers GNA13 and GNAI2 occurred in TW-enriched lymphomas, demonstrating that hypermutation signatures can be used to complement driver gene-based assessment of cell-of-origin (COO) noninvasively (Figure 4G). Importantly, the post-GC signature identified DLBCL patients with inferior survival, while the subtyping based on immunohistochemistry, digital gene expression, or mutational clustering did not reach statistical significance (supplemental Figure 13F). Furthermore, the post-GC signature and its surrogate, CD79B mutations, recognized patients with poor outcomes independent of pretreatment ctDNA burden, suggesting that accurate noninvasive phenotyping can provide COO-related additional prognostic information to tumor burden at diagnosis (Figure 4H; supplemental Figure 13G-H).
To continue learning from hypermutable patterns in ctDNA, we next dissected the landscape of phased variants that are linked somatic mutations in a shared haplotype (ie, same allele) of cancer cells. Overall, we recorded phased variants in 96 of 99 (97%) of the patients most commonly affecting well-established targets of AID in the immunoglobulin loci and BCL6 gene untranslated regions34 (Figure 4I). Phased variants in other hypermutable genes BCL2, SOCS1, and PIM1 were common, and they occurred in a mutually exclusive subtype-related fashion (Figure 4I). Notably, phased hypermutations of BCL2 were associated with BCL2 translocations, suggesting that they could be used to noninvasively detect BCL2 translocations (Figure 4J; supplemental Figure 14A-C).
Conversely, we observed that some adjacent somatic events were not phased (ie, derived from different haplotypes) in the ctDNA and provided direct evidence of convergent evolutionary patterns between different lymphoma clones. In the pretreatment plasma of Case#3, for example, we recorded multiple clones having independently acquired C-terminus truncating mutations of BCL10 that result in loss of apoptosis-inducing capability while retaining the CARD domain for NF-κ-B activation35 (Figure 4K-L). Interestingly, in another case, these nonphased patterns concerned another CARMA complex proto-oncogene CARD11 (supplemental Figure 14D-F). Altogether, these findings demonstrate that besides their utility in MRD interrogation, hypermutation patterns in plasma provide an untapped resource to assess molecular subtype, oncogene addiction, and clonal heterogeneity in B-cell lymphomas.
Refractory and relapsed clinical courses are associated with TP53 loss and MYC catastrophes
Despite clinical high-risk demographics, the overall outcome of the patients was excellent (Figure 1B-C). To improve our understanding of patients who relapsed or had refractory disease, we scrutinized their ctDNA for molecular and genomic characteristics (Figure 5A).
![Genomic patterns behind primary refractoriness and outcomes of high-grade B-cell lymphomas with MYC and BCL2 double-hit. (A) Annotated schematic representation of ctDNA dynamics in highlighted patients with primary refractory disease (end response = progressive disease [PD]) and progression (REL) during follow-up. (B) Dot and line graphs of the somatic reporter mutations according to their VAFs (y-axis) in plasma samples of primary refractory patients prior to therapy and at response evaluations. PD#1 and PD#2 are high-grade B-cell lymphomas with MYC and BCL2 alterations (HGBL-DH-BCL2). PD#3, an ABC DLBCL of MCD/C5 genomic subtype (CD79B [Y197S] and MYD88 [L265P] mutations). TP53 mutations (shown in red) are labeled, ctDNA concentrations are indicated below the plots, logarithmic scale on y-axis. (C) Dot plot comparing the relative VAFs of reporter mutations between pretreatment and end-of-therapy plasma samples in PD#2. Variant allele frequencies are normalized to a shared CREBBP founder mutation in the samples. Orange and purple colors denote enriched and lost mutations during therapy, respectively. Mutations were considered enriched if the fold-change of normalized VAFs between post- and pretherapy sequences was >2 and lost if no reads were present after therapy. Nonsynonymous genomic drivers are labeled. Variants with >1% VAF in the pretreatment sample were included. Logarithmic scale on y-axis. (D) PET-CT images showing the radiological response in PD#2. Bulky lesion decreased, whereas the perihepatic lesion increased in size and activity. (E) Comparison of ctDNA concentration and MRD test results (y-axis) between TP53 wild-type (WT) and mutated lymphomas (x-axis) at midstaging. (F) Swimmers plot of the HGBL-DH-BCL2 patients according to their pretreatment ctDNA concentration. DHIT#1 was deemed double-hit signature (DHITsig)-negative according to digital gene expression analysis with DLBCL90 assay. (G) Dot and line graphs of the somatic reporter mutations according to their VAFs (y-axis) in plasma samples of TP53 WT DHIT#1 and TP53 mutated DHIT#3. TP53 mutations (shown in red) are labeled, ctDNA concentrations or MRD negativity are indicated below the plots, logarithmic scale on y-axis. SUV, standardized uptake value.](https://ash.silverchair-cdn.com/ash/content_public/journal/blood/139/12/10.1182_blood.2021012852/3/m_bloodbld2021012852f5.png?Expires=1769084790&Signature=uRXrpnyZvaUXdvSnOmWVB1M99neKFo9lojNWzt0-spou4xRfBcIkaJsRxKWGINtxU5vPC5Wigt69b7VRcGetf5rzUH9UN17U580HkAT6MxW32M-KYCN37gY2ex1~AO5PBdWc2yKQ-3GX4q2eS48q4WCFyL-zTvK7uWh7pVY4jReR82SmqgM9j-JGoAhdBklFJshQ4s~C0-23bc0VkYiT4CxxZXf1fZsQIvmFWneNTN7iavbW3-RA3UMDlidvXhHU~9GcdrwuoA6AqcQb2Il5BrL6e6qcjPsZWDBvj3lehxBWt0S3JuXuzN5qGfWvEl~GK1kGQcjCkBgAb1ng97UA7A__&Key-Pair-Id=APKAIE5G5CRDK6RD3PGA)
Genomic patterns behind primary refractoriness and outcomes of high-grade B-cell lymphomas with MYC and BCL2 double-hit. (A) Annotated schematic representation of ctDNA dynamics in highlighted patients with primary refractory disease (end response = progressive disease [PD]) and progression (REL) during follow-up. (B) Dot and line graphs of the somatic reporter mutations according to their VAFs (y-axis) in plasma samples of primary refractory patients prior to therapy and at response evaluations. PD#1 and PD#2 are high-grade B-cell lymphomas with MYC and BCL2 alterations (HGBL-DH-BCL2). PD#3, an ABC DLBCL of MCD/C5 genomic subtype (CD79B [Y197S] and MYD88 [L265P] mutations). TP53 mutations (shown in red) are labeled, ctDNA concentrations are indicated below the plots, logarithmic scale on y-axis. (C) Dot plot comparing the relative VAFs of reporter mutations between pretreatment and end-of-therapy plasma samples in PD#2. Variant allele frequencies are normalized to a shared CREBBP founder mutation in the samples. Orange and purple colors denote enriched and lost mutations during therapy, respectively. Mutations were considered enriched if the fold-change of normalized VAFs between post- and pretherapy sequences was >2 and lost if no reads were present after therapy. Nonsynonymous genomic drivers are labeled. Variants with >1% VAF in the pretreatment sample were included. Logarithmic scale on y-axis. (D) PET-CT images showing the radiological response in PD#2. Bulky lesion decreased, whereas the perihepatic lesion increased in size and activity. (E) Comparison of ctDNA concentration and MRD test results (y-axis) between TP53 wild-type (WT) and mutated lymphomas (x-axis) at midstaging. (F) Swimmers plot of the HGBL-DH-BCL2 patients according to their pretreatment ctDNA concentration. DHIT#1 was deemed double-hit signature (DHITsig)-negative according to digital gene expression analysis with DLBCL90 assay. (G) Dot and line graphs of the somatic reporter mutations according to their VAFs (y-axis) in plasma samples of TP53 WT DHIT#1 and TP53 mutated DHIT#3. TP53 mutations (shown in red) are labeled, ctDNA concentrations or MRD negativity are indicated below the plots, logarithmic scale on y-axis. SUV, standardized uptake value.
Genomic patterns behind primary refractoriness and outcomes of high-grade B-cell lymphomas with MYC and BCL2 double-hit. (A) Annotated schematic representation of ctDNA dynamics in highlighted patients with primary refractory disease (end response = progressive disease [PD]) and progression (REL) during follow-up. (B) Dot and line graphs of the somatic reporter mutations according to their VAFs (y-axis) in plasma samples of primary refractory patients prior to therapy and at response evaluations. PD#1 and PD#2 are high-grade B-cell lymphomas with MYC and BCL2 alterations (HGBL-DH-BCL2). PD#3, an ABC DLBCL of MCD/C5 genomic subtype (CD79B [Y197S] and MYD88 [L265P] mutations). TP53 mutations (shown in red) are labeled, ctDNA concentrations are indicated below the plots, logarithmic scale on y-axis. (C) Dot plot comparing the relative VAFs of reporter mutations between pretreatment and end-of-therapy plasma samples in PD#2. Variant allele frequencies are normalized to a shared CREBBP founder mutation in the samples. Orange and purple colors denote enriched and lost mutations during therapy, respectively. Mutations were considered enriched if the fold-change of normalized VAFs between post- and pretherapy sequences was >2 and lost if no reads were present after therapy. Nonsynonymous genomic drivers are labeled. Variants with >1% VAF in the pretreatment sample were included. Logarithmic scale on y-axis. (D) PET-CT images showing the radiological response in PD#2. Bulky lesion decreased, whereas the perihepatic lesion increased in size and activity. (E) Comparison of ctDNA concentration and MRD test results (y-axis) between TP53 wild-type (WT) and mutated lymphomas (x-axis) at midstaging. (F) Swimmers plot of the HGBL-DH-BCL2 patients according to their pretreatment ctDNA concentration. DHIT#1 was deemed double-hit signature (DHITsig)-negative according to digital gene expression analysis with DLBCL90 assay. (G) Dot and line graphs of the somatic reporter mutations according to their VAFs (y-axis) in plasma samples of TP53 WT DHIT#1 and TP53 mutated DHIT#3. TP53 mutations (shown in red) are labeled, ctDNA concentrations or MRD negativity are indicated below the plots, logarithmic scale on y-axis. SUV, standardized uptake value.
TP53 loss drives chemorefractory disease and ctDNA kinetics
Nonresponding DLBCLs were characterized by continuous ctDNA positivity with an end-of-therapy rebound in concentration (Figure 5A). All 3 primary refractory cases with complete sample series carried TP53 mutations, 2 were high-grade GCB lymphomas with concurrent MYC and BCL2 alterations, and 1 was an MCD-like ABC DLBCL (Figure 5B). Interestingly, in PD#1 and PD#3, TP53 mutations appeared to be coupled with the loss of heterozygosity at diagnosis, whereas in PD#2 we observed a shift in mutational repertoire with enrichment of TP53 mutation at progression coupled with a change in involved sites of the disease (Figure 5C-D). Despite being associated with refractory disease, the majority of TP53-mutated cases eventually reached molecular remissions, albeit TP53 loss was strongly associated with MRD positivity at midstaging (Figure 5E). Together with the observed elevated pretreatment ctDNA levels, the findings add a novel molecular understanding of the high-risk nature of TP53-mutated lymphomas36-39 and may provide insight why MRDmid+ was not significantly associated with outcome in our study (Figure 2D).
ctDNA burden and outcome of MYC and BCL2 double-hit
Apart from the 2 treatment-refractory cases with concurrent BCL2 and MYC aberrations, the outcomes of double-hit (DHIT) lymphomas were favorable (Figure 5F). Among DHITs, primary refractoriness was distinguished by concurrent TP53-loss coupled to high pretreatment ctDNA burden, whereas DHITs with lower burden, even those with TP53-loss,40 responded to treatment and remained alive at the last follow-up (Figure 5F-G). These data suggest that high pretreatment ctDNA burden can distinguish poor prognosis even among rare high-risk biological entities.
Undisclosed MYC alterations are enriched at relapse
Plasma samples of the patients who initially achieved CR but progressed during follow-up contained reemerged ctDNA with mostly pretreatment matching mutational repertoire (4 patients) (Figure 5A). Interestingly, in 2 of these patients, explorative variant calling of the plasma samples at relapse revealed emerged MYC single nucleotide variations (SNVs) that were not detectable in plasma at diagnosis (Figure 6A-B). Moreover, in Rel#4, these mutations emerged linked in phase with an ancestral subclonal MYC lesion (S197T), demonstrating that phasing patterns can advance during clonal evolution of lymphoma (Figure 6C). In the tissue biopsies at diagnosis and relapse, we identified a shared rearrangement known to cooccur with MYC SNVs,36,41 and a marked increase in MYC protein levels in the relapse tissue (Figure 6D; supplemental Figure 15A-B). These findings suggest that upon translocation, MYC is subjected to mutation pressure, and the emerging point mutations associate with chemorefractory status of a late-relapsing clone.
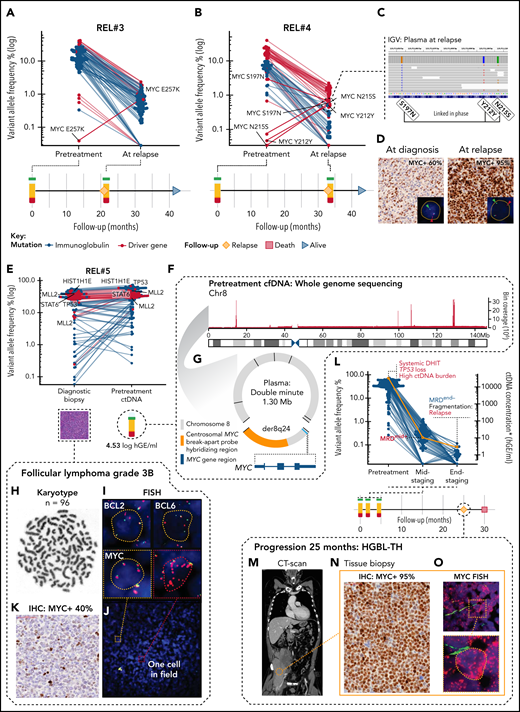
Subclonal point mutations and genomic catastrophes of MYC are associated with refractory subclones. (A,B) Dot and line graphs of somatic point mutations in patients (A) REL#3 and (B) REL#4 according to their VAFs (y-axis, logarithmic) in plasma samples drawn at diagnosis and at relapse. Lines connect the same mutations. Labels show all the exonic mutations detected by explorative genotyping of relapse plasma samples that were not detected in pretreatment samples. Also, an MYC SNV (S197N) detected subclonally at diagnosis is annotated in (B). Swimmer plots below the dot plots demonstrate clinical courses and time points of the plasma draws. (C) IGV screenshot showing reads spanning the relapse emerged MYC SNVs phased with an ancestral MYC SNV in the relapse plasma sample of REL#4. (D) Representative figures of MYC immunohistochemical (IHC) staining in primary and relapse tissues of REL#4. Relapse tissue biopsy is concurrent with the sequenced relapse plasma sample. Inlets show fluorescent images of representative cells in the analyzed tissues hybridized with FISH break-apart probes for MYC locus. Arrowheads denote break-apart signals. (E) Dot plot of somatic point mutations according to their VAF (y-axis, logarithmic scale) in the diagnostic biopsy and pretreatment plasma ctDNA of patient REL#5. Lines connect the same mutations. Nonsynonymous mutations of genomic driver genes are labeled excluding those of BCL2. (F) Bar plot showing the sequencing depth of chromosome 8 in WGS data of REL#5 pretreatment cfDNA. Note the exceptional spikes in coverage that give away high-level amplification of these sequences. One thousand base pair binning. (G) Scaled schematic representation of the completely solved structure of 1.30 megabase amplified double minute detected with plasma pretreatment cfDNA WGS. The double minute contained DNA derived only from chromosome 8, carried 7 novel junctions (black lines), and encompassed an intact MYC gene with hybridization sequences for centrosomal MYC break-apart probe (orange color annotation). (H-J) Genomic analysis of the complex karyotype in the diagnostic biopsy of REL#5. (H) Representative G-banding analysis showing near tetraploid corresponding karyotype (n = 96). (I) Representative cells from the FISH analyses: BCL2 and BCL6 with multiple break-apart signals and MYC with tetrasomy of 8 corresponding signals without a rearrangement. (J) Fluorescent image of MYC FISH showing a microscopy field in REL#5 diagnostic tissue with 1 single cell (red dashed box, inlet) detected carrying amplified double minute corresponding additional red fluorescent signals. (K) MYC IHC in the diagnostic tissue of REL#5 with 40% tumor cell positivity. (L) Dot and line graph showing individual mutations according to their VAF (blue dots, left y-axis) and ctDNA concentration (orange line, right y-axis) in the plasma samples drawn at different therapy phases of REL#5. Red and blue text annotations denote adverse and favorable risk features in ctDNA, respectively. Swimmer plot below showing timeline of REL#5 plasma sampling and disease course. DHIT, MYC/BCL2 double-hit; MRD, minimal residual disease. Asterisk denotes end-of-therapy ctDNA concentration estimated, although MRD was negative (borderline). (M) CT-scan, coronal section of patient REL#5 at progression showing a large partially necrotic mass near the right psoas muscle. (N) MYC IHC stain in the tissue biopsy taken at the time of progression showing markedly increased MYC immunoreactivity (95% tumor cell positivity) in comparison with the diagnostic MYC IHC stain. (O) Representative archival FISH analysis of MYC locus in the tissue biopsy taken at the time of Innumerable red fluorescent signals corresponding to high-level amplified double minutes in all lymphoma cells. Inlet: representative cell.
Subclonal point mutations and genomic catastrophes of MYC are associated with refractory subclones. (A,B) Dot and line graphs of somatic point mutations in patients (A) REL#3 and (B) REL#4 according to their VAFs (y-axis, logarithmic) in plasma samples drawn at diagnosis and at relapse. Lines connect the same mutations. Labels show all the exonic mutations detected by explorative genotyping of relapse plasma samples that were not detected in pretreatment samples. Also, an MYC SNV (S197N) detected subclonally at diagnosis is annotated in (B). Swimmer plots below the dot plots demonstrate clinical courses and time points of the plasma draws. (C) IGV screenshot showing reads spanning the relapse emerged MYC SNVs phased with an ancestral MYC SNV in the relapse plasma sample of REL#4. (D) Representative figures of MYC immunohistochemical (IHC) staining in primary and relapse tissues of REL#4. Relapse tissue biopsy is concurrent with the sequenced relapse plasma sample. Inlets show fluorescent images of representative cells in the analyzed tissues hybridized with FISH break-apart probes for MYC locus. Arrowheads denote break-apart signals. (E) Dot plot of somatic point mutations according to their VAF (y-axis, logarithmic scale) in the diagnostic biopsy and pretreatment plasma ctDNA of patient REL#5. Lines connect the same mutations. Nonsynonymous mutations of genomic driver genes are labeled excluding those of BCL2. (F) Bar plot showing the sequencing depth of chromosome 8 in WGS data of REL#5 pretreatment cfDNA. Note the exceptional spikes in coverage that give away high-level amplification of these sequences. One thousand base pair binning. (G) Scaled schematic representation of the completely solved structure of 1.30 megabase amplified double minute detected with plasma pretreatment cfDNA WGS. The double minute contained DNA derived only from chromosome 8, carried 7 novel junctions (black lines), and encompassed an intact MYC gene with hybridization sequences for centrosomal MYC break-apart probe (orange color annotation). (H-J) Genomic analysis of the complex karyotype in the diagnostic biopsy of REL#5. (H) Representative G-banding analysis showing near tetraploid corresponding karyotype (n = 96). (I) Representative cells from the FISH analyses: BCL2 and BCL6 with multiple break-apart signals and MYC with tetrasomy of 8 corresponding signals without a rearrangement. (J) Fluorescent image of MYC FISH showing a microscopy field in REL#5 diagnostic tissue with 1 single cell (red dashed box, inlet) detected carrying amplified double minute corresponding additional red fluorescent signals. (K) MYC IHC in the diagnostic tissue of REL#5 with 40% tumor cell positivity. (L) Dot and line graph showing individual mutations according to their VAF (blue dots, left y-axis) and ctDNA concentration (orange line, right y-axis) in the plasma samples drawn at different therapy phases of REL#5. Red and blue text annotations denote adverse and favorable risk features in ctDNA, respectively. Swimmer plot below showing timeline of REL#5 plasma sampling and disease course. DHIT, MYC/BCL2 double-hit; MRD, minimal residual disease. Asterisk denotes end-of-therapy ctDNA concentration estimated, although MRD was negative (borderline). (M) CT-scan, coronal section of patient REL#5 at progression showing a large partially necrotic mass near the right psoas muscle. (N) MYC IHC stain in the tissue biopsy taken at the time of progression showing markedly increased MYC immunoreactivity (95% tumor cell positivity) in comparison with the diagnostic MYC IHC stain. (O) Representative archival FISH analysis of MYC locus in the tissue biopsy taken at the time of Innumerable red fluorescent signals corresponding to high-level amplified double minutes in all lymphoma cells. Inlet: representative cell.
WGS of ctDNA reveals systemic transformation of FL3B
Lastly, in REL#5 with pretreatment cfDNA WGS available, we observed exceptional sequencing depths of specific chromosome 8 sequences that assembled and completely solved the structure of an amplified extrachromosomal circular element of DNA (‘double minute’) containing an intact MYC gene (Figure 6E-G; supplemental Figure 15C, supplemental Table 7). The diagnostic biopsy had FL3B histology, a complex karyotype with tetraploid chromosome number, and BCL2 and BCL6 translocations (Figure 6H-I). According to fluorescence in situ hybridization (FISH), MYC locus signals, however, corresponded to tetrasomy of chromosome 8 with no rearrangement detected despite the plasma-recorded double minute carried hybridization sequences for FISH detection (Figure 6G,I). Therefore, to search for any evidence of the presence of this rearrangement in the diagnostic tissue, we reexamined MYC FISH in available archival samples and were able to pinpoint scattered and extremely few occasional cells with double minute corresponding FISH signals (Figure 6J). On the protein level, MYC immunoreactivity was estimated at 40% (Figure 6K). Despite complete metabolic response to therapy (PET-CT, Deauville score = 1), the response according to liquid biopsy was suboptimal, and 25 months after the initial diagnosis, the patient experienced progression with a transformation to triple-hit high-grade B-cell lymphoma (HGBL-TH) (Figure 6L-M). In the tissue biopsy at relapse, MYC immunoreactivity had dramatically increased (95% positive), and fluorescent interrogation of MYC locus revealed a pattern corresponding to innumerable amplified double minute signals detected in plasma WGS already at diagnosis (Figure 6N-O). This analysis reveals that the FL3B in the initial diagnostic biopsy had already undergone systemic transformation to HGBL-TH lymphoma at baseline with high ctDNA burden and TP53-loss, giving rise to progression and ultimately death from lymphoma.
Discussion
Since the addition of rituximab, precision medicine approaches in aggressive B-cell lymphomas have not been successful as a part of primary therapy.5,42 This is likely due to confounding clinical and biological complexity that compromises clinical trials and is poorly captured by clinical estimates and tumor biopsies. By dissecting liquid biopsies of aggressive B-cell lymphoma patients, we discovered novel quantitative, mutational, and fragmentation patterns in the ctDNA that can resolve undisclosed heterogeneity and identify the patients with incomplete responses and inferior outcomes following a uniform therapy.
Our findings anticipate a pivotal role for pretreatment ctDNA analysis in future clinical trial designs, treatment decisions, and translational research in DLBCL. First, despite meeting the same inclusion criteria for high risk, we found substantial variation in pretreatment ctDNA burden between the patients, which translated into different outcomes even within individual clinical and biological risk groups. To overcome this clinically relevant plane of heterogeneity, a ctDNA burden-based index could provide an objective and generalizable tool for clinical trial inclusion21,43 and evaluation of their external validity. Furthermore, a ctDNA-based normalization could overcome selection biases arising from different diagnosis-to-treatment times21,43 and procedures of tissue biopsy, for example, both of which are linked with high-risk in DLBCL.44 Second, since baseline ctDNA levels determine both high- and low-risk patients, therapy stratification could result in improved outcomes. For example, patients with low ctDNA burden could benefit from therapy deescalation,45 whereas consolidation could improve the outcomes of patients with a high burden. Third, genomic analysis of pretreatment ctDNA provides an accurate systemic diagnosis that can culminate into diagnosis-changing discoveries that are not necessarily obtained from the most readily accessible site of tissue biopsy. As such, spatial heterogeneity can compromise the emergence of precision medicine approaches relying on tumor tissue for the detection of actionable mutations. Establishing these concepts and their further understanding warrants international efforts, prospective trials, and additional translational studies.
Treatment decisions based on pretreatment ctDNA-educated approaches could be complemented with serial analysis of ctDNA for response evaluation and surveillance as conceptualized by Kurtz and colleagues.22 Our findings validate and build on previously reported concepts,19,31 including novel ctDNA tools for precision oncology, such as phasing-aware MRD testing46 and fragmentation-based relapse prediction. With further development, these independent conceptual sources of input could be applied to detect incomplete responses and progression early and accurately. These applications could also save resources, diminish potentially harmful invasive procedures, and reduce unnecessary overtreatment caused by current response evaluation methods lacking specificity. Under continuous development, more sensitive ctDNA platforms will be achieved through better technical error suppression, for example, with duplex-adapters47 and additional tools to distinguish true MRD signal from biological confounders, such as clonal hematopoiesis,48 that represent limitations of our study. Although compelling, the efficacy and feasibility of dynamic ctDNA-guided decision-making warrant establishment in a prospective setting.
Altogether, our comprehensive analysis of ctDNA in the serial plasma samples of trial patients provides a roadmap for better understanding of high-risk B-cell lymphoma on the liquid biopsy. Our findings, both in terms of validation and novelty, are of high translational importance revealing previously unexplored molecular principles in the ctDNA that can be used in diagnostics, response evaluation, as prognostic tools, and in understanding lymphoma biology. We anticipate a growing interest in the platforms integrating both mutational and fragmentation features of the ctDNA in future LBCL studies, including ctDNA-based clinical trial designs and personalized treatment.
Acknowledgments
This article was supported by the Academy of Finland (grant 311171), the Biomedicum Helsinki Foundation, the Digital Precision Cancer Medicine Flagship iCAN, the Finnish Cancer Organizations, the Sigrid Juselius Foundation, the Southern Finland Regional Cancer Center FICAN South, Helsinki University Hospital, The University of Helsinki, the Ida Montin Foundation, the Orion Research Foundation, and the Paolo Foundation.
Authorship
Contribution: L.M., A.A., and S.L. conceived the study; L.M. and S.L. wrote the manuscript; A.P., J.J., Y.N.B., M.-L.K.-L., P.B., M.B., M.J., I.F., L.T.G.M., Ø.F., S.J., H.H., and S.L. provided samples and clinical data; A.P. and M.A. established the cell-free DNA extraction; M.L. and P.E. performed sequencing; L.M., A.A., P.M., and E.P. analyzed the data; A.A. preprocessed the raw sequencing data; S.L. supervised the study and data analysis; and all authors read and approved the manuscript.
Conflict-of-interest disclosure: S.L.: Janssen-Cilag: Consultancy, research funding*; Roche: Consultancy, honoraria, research funding*; Takeda: Consultancy, honoraria, research funding*; Novartis: Consultancy, honoraria; Bayer: Research funding*; Celgene: Consultancy, research funding*; Gilead: Consultancy*. H.H.: Gilead: Consultancy, honoraria*; Takeda: Consultancy, honoraria*; Novartis: Consultancy, honoraria*; Genmab: Consultancy, honoraria*, Incyte: Consultancy, honoraria*; Roche: Consultancy, honoraria*. Ø.F.: Novartis: Consultancy, honoraria*. M.B.: Incyte, Mundipharma, Schain Research, Roche, Pfizer, Bristol-Myers Squibb, and Janssen-Cilag: Consultant, advisor*; Takeda: Research grant*. The remaining authors declare no competing financial interests.
*Not related to this study.
Correspondence: Sirpa Leppä, Department of Oncology, Helsinki University Central Hospital Cancer Center, P.O. Box 180, FI-00029 Helsinki, Finland; e-mail: sirpa.leppa@helsinki.fi.
The online version of this article contains a data supplement.
There is a Blood Commentary on this article in this issue.
The publication costs of this article were defrayed in part by page charge payment. Therefore, and solely to indicate this fact, this article is hereby marked “advertisement” in accordance with 18 USC section 1734.
