

Key points
Two novel high-risk subtypes were identified in AYA and adults with B-ALL using integrated RNA-seq and target-capture DNA-seq analyses.
Frequencies of novel subtypes were distinct between adults and children, partly accounting for inferior outcome of adults with B-ALL.

Abstract
The genetic basis of leukemogenesis in adults with B-cell acute lymphoblastic leukemia (B-ALL) is largely unclear, and its clinical outcome remains unsatisfactory. This study aimed to advance the understanding of biological characteristics, improve disease stratification, and identify molecular targets of adult B-ALL. Adolescents and young adults (AYA) (15 to 39 years old, n = 193) and adults (40 to 64 years old, n = 161) with Philadelphia chromosome-negative (Ph−) B-ALL were included in this study. Integrated transcriptomic and genetic analyses were used to classify the cohort into defined subtypes. Of the 323 cases included in the RNA sequencing analysis, 278 (86.1%) were classified into 18 subtypes. The ZNF384 subtype (22.6%) was the most prevalent, with 2 novel subtypes (CDX2-high and IDH1/2-mut) identified among cases not assigned to the established subtypes. The CDX2-high subtype (3.4%) was characterized by high expression of CDX2 and recurrent gain of chromosome 1q. The IDH1/2-mut subtype (1.9%) was defined by IDH1 R132C or IDH2 R140Q mutations with specific transcriptional and high-methylation profiles. Both subtypes showed poor prognosis and were considered inferior prognostic factors independent of clinical parameters. Comparison with a previously reported pediatric B-ALL cohort (n = 1003) showed that the frequencies of these subtypes were significantly higher in AYA/adults than in children. We delineated the genetic and transcriptomic landscape of adult B-ALL and identified 2 novel subtypes that predict poor disease outcomes. Our findings highlight the age-dependent distribution of subtypes, which partially accounts for the prognostic differences between adult and pediatric B-ALL.
Introduction
B-cell acute lymphoblastic leukemia (B-ALL) is a life-threatening malignancy that occurs across all age groups, with adults showing poorer outcomes than children. Founding genetic events define B-ALL subtypes and are closely associated with its clinical course. Indeed, differences in subtype prevalence between adults and children may account for the differences in clinical outcomes.1,2 In addition to the classical subtypes, recent RNA sequencing (RNA-seq) studies have identified multiple rearrangements, including DUX4, ZNF384, and MEF2D rearrangements, that define B-ALL subtypes.3-9 Additionally, RNA-seq-based, large-scale studies have identified new subtypes characterized by single nucleotide variants (SNVs), including PAX5 P80R and IKZF1 N159Y.2,10 Despite the progress made in B-ALL classification, the subtypes of several adult patients with Philadelphia chromosome-negative (Ph−) B-ALL, which is considered to be responsible for the poor prognosis, are not well characterized.11
Herein, we aimed to classify a Ph− B-ALL cohort of adolescents and young adults (AYA), as well as adults, into subtypes using combined RNA- and DNA-seq analysis. Obtaining a clear understanding of genetic lesions, specific expression profiles, and clinical features of the respective subtypes can improve risk assessment while identifying target genes in AYA and adults with B-ALL.
Methods
Patients
All patients (n = 354; 15 to 64 years old) newly diagnosed with Ph− B-ALL enrolled in the ALL202-U (n = 54), ALL202-O (n = 147), and Ph−B-ALL213 (n = 153) studies conducted by the Japan Adult Leukemia Study Group, with available RNA specimens, were included in this study (supplemental Table 1).12,13 Ph– ALL patients between 15 and 24 years of age and between 25 and 64 years of age were enrolled concurrently in ALL202-U and ALL202-O studies, respectively, from August 2002 to January 2011.12,13 Ph– B-ALL patients between 15 and 64 years of age were enrolled in the Ph– B-ALL213 study from July 2013 to October 2016. Clinical details and survival data were prospectively collected, although the survival data for Ph– B-ALL213 is currently under analysis. Informed consent was obtained from all patients prior to study enrollment. The study was approved by the ethics committees at all participating institutions.
RNA-seq and target-capture (TC)-RNA-seq
To detect gene rearrangements, RNA-seq (RNA integrity number >6.0; n = 169), target- TC-RNA-seq (n = 31), or both (n = 154) was performed for all patients (supplemental Figure 1). RNA-seq libraries were prepared as described previously.7 To enable the efficient detection of gene rearrangements, even with poor-quality RNA, the TC-RNA-seq library was prepared with NEBNext Ultra II Directional RNA Library Prep Kit (New England BioLabs) using RNA samples after removing ribosomal RNA. Target regions were captured using a panel of exons involved in gene fusions and regions associated with immunoglobulin heavy chain (IGH) translocations (supplemental Table 2). These libraries were then subjected to next-generation sequencing (NGS) using the HiSeq2500 platform (Illumina, San Diego, CA). Our pilot study demonstrated that the sensitivity of detection of fusion genes using TC-RNA-seq was comparable (>90% agreement) to that using RNA-seq (supplemental Table 3). Detailed analytical procedures (gene rearrangement analysis) are described in the supplemental Methods.
Gene expression analysis from RNA-seq data
The obtained RNA-seq data were used to generate expression profiles as described previously7 (also see supplemental Methods). Normalized read counts, transformed by the variance-stabilizing transformation method, were subjected to hierarchical clustering analysis using Ward’s method or t-distributed stochastic neighbor embedding (tSNE) analysis with a perplexity value of 15. This analysis was performed with a gene set (n = 200)14 that was previously used for clustering analysis, including the top 25 rank-ordered genes in 8 unique cluster groups identified using the Recognition of Outliers by Sampling Ends method.15 Additional tSNE parameters (perplexity of 5, 20, and 30) were included, which demonstrated that the data were mostly concordant under different experimental conditions. For rigorous classification of Ph-like ALL, the top 100 rank-ordered genes, specific to the cluster with an activated kinase signature (R8),15 were reannotated to the updated RefSeq database, resulting in the concatenation of a total of 70 RefSeq entries (supplemental Table 4) that were ultimately used for hierarchical cluster analysis.
TC-DNA sequencing and whole-exome/genome sequencing
To detect SNVs/indels, copy number variations (CNVs), structural variations, and tumor clonality, target enrichment sequencing libraries were prepared from 20 to 200 ng DNA using SureSelect XT Low Input Reagent Kit (Agilent Technologies, Santa Clara, CA) with a custom capture panel,16 according to the manufacturer’s instructions. These libraries were subjected to NGS using the HiSeq2500 platform. Details of analytical procedures (SNVs/indels, structural variations, and tumor clonality) are provided in the supplemental Methods. CNVs were analyzed at both the arm and focal (30 Mb or less) levels using the CNACS algorithm. For focal CNV assessment, only deletions of the common regions (IKZF1, PAX5, EBF1, CDKN2A/2B, RB1, ETV6, BTLA, TBL1XR1, ERG, NF1, ATM, IKZF2, IKZF3, TP53, CREBBP, VPREB1, NR3C1, and TCF3) were evaluated. Candidate focal CNVs were manually reviewed and further filtered by removing regions detected by <3 capture probes, as described previously,17,18 and validated by orthogonal methods (see supplemental Methods).
To detect SNVs/indels and structural variations, the sequencing libraries for whole-exome sequencing (WES) (n = 10) and whole-genome sequencing (WGS) (n = 3) were prepared using SureSelect XT Low Input Reagent Kit and the NEBNext Ultra II FS DNA library prep kit (New England Biolabs), respectively. These libraries were subjected to NGS using the HiSeq2500 or NovaSeq 6000 platforms.
Statistical analysis
Groups were compared based on the Wilcoxon rank-sum test or Student t test for continuous data and Fisher’s exact test for categorical data with Benjamini-Hochberg correction. Overall survival (OS) and disease-free survival (DFS) for cases in ALL202-U and ALL202-O studies were estimated using the Kaplan-Meier method, and a log-rank test was used to assess differences in OS and DFS between subtypes. OS was also evaluated using Cox proportional-hazards model. Statistical analyses were performed with the R version 3.6.3 software (R Foundation for Statistical Computing). P values < .05 were considered statistically significant.
Results
Classification of disease subtypes in AYA and adults with B-ALL
Gene expression profiles and genetic alterations (rearrangements, SNVs/indels, and CNVs) were obtained by integrating RNA-seq (n = 323, TC-RNA-seq; n = 185) and TC-DNA-seq analyses (n = 313) in 354 individuals with B-ALL (supplemental Tables 5-10; supplemental Figure 1). Using tSNE and hierarchical clustering, we obtained several clusters with the most consistent results between the 2 methods (Figure 1A; supplemental Figure 2A,B). The cohort was classified into subtypes based on gene rearrangements, gross chromosomal alterations, or both gene expression profile and genetic alterations, similar to the classification reported previously2 (Table 1). Of the 323 cases for which RNA-seq was conducted, 250 (77.4%) were classified into 14 previously well-recognized subtypes (Figure 1A; supplemental Figure 2A,B). Notably, a subtype defined by ZNF384 rearrangements (ZNF384) was the most prevalent in AYA (21.6%) and adults (23.8%) (Figure 1B). Other subtypes defined by rearrangements included TCF3-PBX1 (9.0%), DUX4-rearranged (DUX4) (7.4%), MEF2D-rearranged (MEF2D) (5.3%), KMT2A-rearranged (KMT2A) (4.3%), BCL2/MYC-rearranged (BCL2/MYC) (1.9%), and ETV6-RUNX1 (0.6%). High-hyperdiploid (HeH) (2.8%), low-hypodiploid (HoL) (1.9%), and near-haploid (0.3%) were defined by gross chromosomal alterations via digital karyotyping and/or classical karyotyping (Table 1). Specific gene expression profiling combined with genetic alterations facilitated the identification of 4 subtypes: Ph-like (15.8%; CRLF2-rearranged [5.6%], ABL-class [ABL1, ABL2, and PDGFRB] rearranged [4.3%], and other [5.9%]), PAX5alt (3.1%), low hyperdiploid (1.2%), and PAX5 P80R (1.2%). Although subtype distribution differed between AYA and adults, the differences were not significant (Figure 1B).
![Disease subtypes identified in AYA and adults with B-ALL. (A) Gene expression profiling of 323 cases of Ph– B-ALL and 28 control samples (Ph+ALL; n = 4, T-cell ALL [T-ALL]; n = 18, normal lymphocyte; n = 6) in a 2-dimensional, t-distributed, stochastic neighbor embedding plot with a perplexity score of 15. We used a previously reported gene set (n = 200)14 for analysis (see supplemental Methods).15 Major subtypes defined by rearrangements (ZNF384, TCF3-PBX1, DUX4, MEF2D, KMT2A, and BCL2/MYC) and gross chromosomal alterations (HeH and HoL), as well as control samples (Ph+ ALL, T-ALL, and normal lymphocyte), are colored in each group. Ph-like, PAX5alt, PAX5 P80R, and CEBP/ZEB2 subtypes, which were defined using hierarchical clustering (supplemental Figure 2A,B), are also shown. Gray dots indicate other B-ALL. We propose 2 novel subtypes with distinct expression profiles: CDX2-high and IDH1/2-mut subtypes. (B) Distribution of Ph– B-ALL subtypes between AYA (15 to 39 years old) and adults (40 to 64 years old), whose samples were subjected to RNA-seq (n = 323). (C) The landscape of genetic alterations for 262 cases of the 18 indicated subtypes, identified by TC-DNA-seq. Rearrangements, common gene alterations (n ≥ 8), mutations in key genes (IL7R, CRLF2, and IDH1/2), and common arm-level CNVs are shown. Clinical information and information on the implementation status of NGS (RNA-seq and TC-RNA-seq) are also provided. Clonality indicates immunoglobulin rearrangements. NH, near haploid.](https://ash.silverchair-cdn.com/ash/content_public/journal/blood/139/12/10.1182_blood.2021011921/3/m_bloodbld2021011921f1.png?Expires=1769088653&Signature=wVPlwkE7HAbISvSIrsBiNA0lAREuHhsw6~mMASSpUhOg92KVZkZQustKnC3S-AqDDNgKF9435QVCvSnc-pxd7gb52FFeReL1o5uyK~zxVpISHg2B6~Dqr9JZ1SYBWVCRdCK44CtA7UfRKIa3z9h5N6kxOPgQVv1UEoibWPzajpC4rXM4lwZntYiejsdQweCvDqHf9CtI0akmiF5rdHzxXU4vsIukV9py8Tq-N-UMf~BjZ~HWT5iT6jF1usCHjwYR55TTNXw222YmlaLb9CnUggTqMaTFupUolZOTrJI~b6LYcX7IaNM9JXmm9P2G96-rD3Oa4oa~nmaYL0CJC6s2sg__&Key-Pair-Id=APKAIE5G5CRDK6RD3PGA)
Disease subtypes identified in AYA and adults with B-ALL. (A) Gene expression profiling of 323 cases of Ph– B-ALL and 28 control samples (Ph+ALL; n = 4, T-cell ALL [T-ALL]; n = 18, normal lymphocyte; n = 6) in a 2-dimensional, t-distributed, stochastic neighbor embedding plot with a perplexity score of 15. We used a previously reported gene set (n = 200)14 for analysis (see supplemental Methods).15 Major subtypes defined by rearrangements (ZNF384, TCF3-PBX1, DUX4, MEF2D, KMT2A, and BCL2/MYC) and gross chromosomal alterations (HeH and HoL), as well as control samples (Ph+ ALL, T-ALL, and normal lymphocyte), are colored in each group. Ph-like, PAX5alt, PAX5 P80R, and CEBP/ZEB2 subtypes, which were defined using hierarchical clustering (supplemental Figure 2A,B), are also shown. Gray dots indicate other B-ALL. We propose 2 novel subtypes with distinct expression profiles: CDX2-high and IDH1/2-mut subtypes. (B) Distribution of Ph– B-ALL subtypes between AYA (15 to 39 years old) and adults (40 to 64 years old), whose samples were subjected to RNA-seq (n = 323). (C) The landscape of genetic alterations for 262 cases of the 18 indicated subtypes, identified by TC-DNA-seq. Rearrangements, common gene alterations (n ≥ 8), mutations in key genes (IL7R, CRLF2, and IDH1/2), and common arm-level CNVs are shown. Clinical information and information on the implementation status of NGS (RNA-seq and TC-RNA-seq) are also provided. Clonality indicates immunoglobulin rearrangements. NH, near haploid.
Disease subtypes identified in AYA and adults with B-ALL. (A) Gene expression profiling of 323 cases of Ph– B-ALL and 28 control samples (Ph+ALL; n = 4, T-cell ALL [T-ALL]; n = 18, normal lymphocyte; n = 6) in a 2-dimensional, t-distributed, stochastic neighbor embedding plot with a perplexity score of 15. We used a previously reported gene set (n = 200)14 for analysis (see supplemental Methods).15 Major subtypes defined by rearrangements (ZNF384, TCF3-PBX1, DUX4, MEF2D, KMT2A, and BCL2/MYC) and gross chromosomal alterations (HeH and HoL), as well as control samples (Ph+ ALL, T-ALL, and normal lymphocyte), are colored in each group. Ph-like, PAX5alt, PAX5 P80R, and CEBP/ZEB2 subtypes, which were defined using hierarchical clustering (supplemental Figure 2A,B), are also shown. Gray dots indicate other B-ALL. We propose 2 novel subtypes with distinct expression profiles: CDX2-high and IDH1/2-mut subtypes. (B) Distribution of Ph– B-ALL subtypes between AYA (15 to 39 years old) and adults (40 to 64 years old), whose samples were subjected to RNA-seq (n = 323). (C) The landscape of genetic alterations for 262 cases of the 18 indicated subtypes, identified by TC-DNA-seq. Rearrangements, common gene alterations (n ≥ 8), mutations in key genes (IL7R, CRLF2, and IDH1/2), and common arm-level CNVs are shown. Clinical information and information on the implementation status of NGS (RNA-seq and TC-RNA-seq) are also provided. Clonality indicates immunoglobulin rearrangements. NH, near haploid.
Revised taxonomy of AYA/adults with Ph− B-ALL
| All (n = 323) | AYA (n = 176) | Adult (n = 147) | ||||||
|---|---|---|---|---|---|---|---|---|
| Subtype | n | Frequency (%) | n | Frequency (%) | n | Frequency (%) | Class | Criteria |
| ZNF384 | 73 | 22.6 | 38 | 21.6 | 35 | 23.8 | A | ZNF384 rearrangements |
| TCF3-PBX1 | 29 | 9.0 | 18 | 10.2 | 11 | 7.5 | A | TCF3-PBX1 fusion |
| DUX4 | 24 | 7.4 | 19 | 10.8 | 5 | 3.4 | A | DUX4 rearrangements |
| MEF2D | 17 | 5.3 | 13 | 7.4 | 4 | 2.7 | A | MEF2D rearrangements |
| KMT2A | 14 | 4.3 | 10 | 5.7 | 4 | 2.7 | A | KMT2A rearrangements |
| BCL2/MYC | 6 | 1.9 | 1 | 0.6 | 5 | 3.4 | A | BCL2, MYC, or BCL6 rearrangements |
| ETV6-RUNX1 | 2 | 0.6 | 2 | 1.1 | 0 | 0.0 | A | ETV6-RUNX1 fusion |
| High-hyperdiploid | 9 | 2.8 | 4 | 2.3 | 5 | 3.4 | B | Chromosome number 51-67 |
| Low-hypodiploid | 6 | 1.9 | 0 | 0.0 | 6 | 4.1 | B | Chromosome number 31-39 |
| Near-haploid | 1 | 0.3 | 1 | 0.6 | 0 | 0.0 | B | Chromosome number 24-30 |
| Ph-like | 51 | 15.8 | 22 | 12.5 | 29 | 19.7 | C | Hierarchical gene expression profile cluster enriched with BCR-ABL1; no BCR-ABL1 fusion |
| CDX2-high | 11 | 3.4 | 7 | 4.0 | 4 | 2.7 | C | Hierarchical gene expression profile cluster enriched with high expression of CDX2 and gain (1q) |
| PAX5alt | 10 | 3.1 | 6 | 3.4 | 4 | 2.7 | C | Hierarchical gene expression profile cluster enriched with PAX5 alterations |
| ZNF384-like | 7 | 2.2 | 5 | 2.8 | 2 | 1.4 | C | Hierarchical gene expression profile cluster enriched with ZNF384 fusions; no ZNF384 rearrangements |
| IDH1/2-mut | 6 | 1.9 | 2 | 1.1 | 4 | 2.7 | C | IDH1 R132C or IDH2 R140Q mutations; clustered with IDH1/2-mut subtype or unclustered with any established subtypes |
| CEBP/ZEB2 | 4 | 1.2 | 2 | 1.1 | 2 | 1.4 | C | Hierarchical gene expression profile cluster enriched with CEBP family (CEBPA, CEBPB, CEBPD, CEBPE) rearrangements and ZEB2 H1038R alterations |
| Low-hyperdiploid | 4 | 1.2 | 0 | 0.0 | 4 | 2.7 | C | Hierarchical gene expression profile cluster enriched with high-hyperdiploid; chromosome number 47-50 |
| PAX5 P80R | 4 | 1.2 | 2 | 1.1 | 2 | 1.4 | C | PAX5 P80R alterations or clustered with PAX5 P80R subtype |
| Other | 45 | 13.9 | 24 | 13.6 | 21 | 14.3 | — | — |
Classes defined by: (A) gene rearrangements; (B) CNVs; (C) integration of expression profile and genetic alterations (rearrangements, CNVs, and mutations).
Additionally, our analysis identified 2 previously ill-defined subtypes with distinct expression profiles. The CEBP/ZEB2 subtype (n = 4) was characterized by CEBP family (CEBPA, CEBPB, CEBPD, and CEBPE; n = 1 each) rearrangements with IGH (n = 4) and ZEB2 H1038R mutations (n = 3) (Figure 1A; supplemental Figure 2B). Although this subtype may be similar to a previously reported group (defined by IGH-CEBPE or ZEB2 mutations),10 our cases exhibited the following unique features: (1) CEBP family translocation and ZEB2 mutation typically coexisted; (2) partner genes for IGH translocation included those in the CEBP family, not CEBPE alone. The gene expression profile of CEBP/ZEB2 exhibited primarily downregulated genes compared with other B-ALL (64 upregulated and 529 downregulated genes, with twofold or greater change in expression level and adjusted P < .01) (supplemental Table 11). ZNF384-like (n = 7) had gene expression profiles similar to the ZNF384 subtype; however, it lacked the ZNF384 fusions. One of these cases harbored the alternate translocation TCF4-ZNF362 (supplemental Figure 2B).
TC-DNA-seq identified the genetic alterations coexisting in each subtype and revealed that their distributions differed substantially among subtypes (Figure 1C). For example, alterations in genes involved in the RAS/FLT3 pathway (NRAS, KRAS, NF1, PTPN11, and FLT3; 60.0%) and epigenetic regulation (KMT2D, CREBBP, KDM6A, and EZH2; 41.8%) were frequently identified in ZNF384 subtype. Meanwhile, genes involved in the JAK-STAT pathway (JAK2, IL7R, and CRLF2; 35.6%) and B-cell development (IKZF1, PAX5, and BTLA; 97.8%) were prevalent in the Ph-like subtype. TP53 mutations/deletions were more commonly observed in individuals with HoL (100%), DUX4 (24.0%), and KMT2A (29.4%) subtypes. Additionally, ERG deletion (36.0%), PAX5 alterations (rearrangements or mutations; 75.0%), and chromosome 1q gain (72.0%) were associated with the DUX4, PAX5alt, and TCF3-PBX1 subtypes, respectively. These results were further supported by the correlation analysis between major subtypes (n ≥ 8) and additional gene alterations (supplemental Figure 3). For example, the ZNF384 subtype showed a significantly positive correlation with FLT3, ETV6, and EZH2 mutations. Most results from TC-DNA-seq agreed with previous reports,2,8,16,19,20 confirming the validity and reliability of our subtype classification.
A novel subtype with ectopic expression of CDX2
We identified 2 novel groups characterized by specific expression profiles and recurrent genetic abnormalities in cases that did not belong to the subtypes mentioned above (Figure 1A; supplemental Figure 2B). One (n = 11) was characterized by remarkably high expression of CDX2, accompanied by downregulation of FLT3 (Figure 2A; supplemental Table 12). CDX2 is a critical regulator of HOX genes during embryonic hematopoiesis.21,22 Although CDX2 is not expressed in normal hematopoietic cells of human adults, ectopic expression of CDX2 transformed murine hematopoietic progenitor cells into leukemic cells.23-25 Indeed, all cases in this group showed higher CDX2 expression (n = 11) than in other B-ALL (n = 316) or normal lymphocytes (n = 6) (Figure 2B). In contrast, other B-ALL cases expressed negligible amounts of CDX2, except for 2 cases, which showed moderate to high expression. This combination was designated the “CDX2-high subtype.” Quantitative reverse transcription PCR showed that CDX2 expression in this subtype was comparable to that in the normal colon, which expresses physiological levels of CDX2; however, it was significantly higher than that in T-ALL, acute myeloid leukemia (AML), and normal tissue (Figure 2C). Furthermore, we confirmed high expression of CDX2 protein in all of the tested samples of the CDX2-high subtype using clinicopathological analysis (n = 5; initial diagnosis [n = 3], relapse [n = 2]) (Figure 2D; supplemental Figure 4A) or western blotting (n = 1) (supplemental Figure 4B). CDX2-high ALL had a B-cell precursor phenotype, as revealed by cell-surface markers assessed by flow cytometry, lineage-specific gene expression profiling, and immunoglobulin rearrangements (supplemental Table 13; supplemental Figure 5; Figure 1C).
![Novel subtype with high expression of CDX2. (A) Volcano plot comparing expression profiles of cases with CDX2-high subtype (n = 11) and other B-ALL cases (n = 316; including 4 Ph+ ALL). Genes with twofold or greater changes in expression and -log10 (q value) >5 are shown in red. (B) Box plot comparing fragments per kilobase of transcript per million (FPKM) of CDX2 in CDX2-high (n = 11), KMT2A (n = 14), ZNF384 (n = 73), Ph-like (n = 51), TCF3-PBX1 (n = 29), DUX4 (n = 24), MEF2D (n = 17) subtypes, other B-ALL cases (n = 108; including 4 Ph+ ALL), and normal B/T cells (n = 6). P values were calculated using the Wilcoxon rank-sum test. (C) CDX2 mRNA expression normalized to that of ACTB was determined using TaqMan reverse transcription-polymerase chain reaction analysis for CDX2-high ALL (n = 11), AML (n = 9; 3 clinical specimens and 6 cell lines [MV4-11, OCI-AML2, OCI-AML3, MOLM-13, THP-1, and NOMO1]), T-ALL (n = 16), and normal tissues (n = 8; colon, small intestine, brain, thymocytes, kidneys, lungs, liver, and heart). The abundance of CDX2 was further normalized to that of a normal colon. Data are shown as means from 3 independent experiments. (D) Sections of bone marrow (BM) clots immunostained with a CDX2 antibody to determine the expression levels of CDX2. Representative micrographs from specimens derived from 2 cases with CDX2-high subtype (202O-203 [left panel] and 202O-236 [right panel]) at the time of both initial diagnoses and either relapse (202O-203) or complete remission (202O-236) are shown (original magnification ×400). (E) The 323 cases of Ph– B-ALL plus 4 Ph+ ALL cases were clustered according to expression levels of CDX2, HOXA family genes (n = 11), HOXB family genes (n = 10), and MEIS1 using Ward’s correlation algorithms. Information on disease subtypes is shown at the top of the panel. (F) Methylation status of CpG dinucleotides of CDX2 promoter regions from 3 CDX2-high and 3 other B-ALL samples assessed by bisulfite sequencing. Each column represents sequenced clones. Methylated alleles (pink) and unmethylated alleles (blue) at 5 cytosine residues are indicated. HCT116 DKO and HCT116 gDNA were used as controls of unmethylated and methylated DNA, respectively. P values were calculated using Fisher’s exact test.](https://ash.silverchair-cdn.com/ash/content_public/journal/blood/139/12/10.1182_blood.2021011921/3/m_bloodbld2021011921f2.png?Expires=1769088653&Signature=xyoFMPpZd4FFDy0NtUwmhRiA-nhKh73NtU7nlk22jDh9dmU4GTqvndtw7SmKNWY8ggcIUGmTfChvzUzQQXZZXB~eY~lqOe4~tRaGBN-DtvQ3D6qb7CP6UmLGoenRDRhGywY1UmwnFWwYNPP22FRA17lKPXi7y5hmkxjjHMWSMzgcsGvSaYkhlyTCJqU3-9sn5OqbnQrpl6PrAmOOGoONe61rmY5lIVIIw2XOpZXZtWlfb21HplEi1RjlbuXhWeik2tJO5ZyyzDRIL6QkkfTvtdWHOaULwxQZlTBle3q6YmPmRsF194v7TCs9TGCfW8mumTuDi3tr~xSgn8C-9v72aA__&Key-Pair-Id=APKAIE5G5CRDK6RD3PGA)
Novel subtype with high expression of CDX2. (A) Volcano plot comparing expression profiles of cases with CDX2-high subtype (n = 11) and other B-ALL cases (n = 316; including 4 Ph+ ALL). Genes with twofold or greater changes in expression and -log10 (q value) >5 are shown in red. (B) Box plot comparing fragments per kilobase of transcript per million (FPKM) of CDX2 in CDX2-high (n = 11), KMT2A (n = 14), ZNF384 (n = 73), Ph-like (n = 51), TCF3-PBX1 (n = 29), DUX4 (n = 24), MEF2D (n = 17) subtypes, other B-ALL cases (n = 108; including 4 Ph+ ALL), and normal B/T cells (n = 6). P values were calculated using the Wilcoxon rank-sum test. (C) CDX2 mRNA expression normalized to that of ACTB was determined using TaqMan reverse transcription-polymerase chain reaction analysis for CDX2-high ALL (n = 11), AML (n = 9; 3 clinical specimens and 6 cell lines [MV4-11, OCI-AML2, OCI-AML3, MOLM-13, THP-1, and NOMO1]), T-ALL (n = 16), and normal tissues (n = 8; colon, small intestine, brain, thymocytes, kidneys, lungs, liver, and heart). The abundance of CDX2 was further normalized to that of a normal colon. Data are shown as means from 3 independent experiments. (D) Sections of bone marrow (BM) clots immunostained with a CDX2 antibody to determine the expression levels of CDX2. Representative micrographs from specimens derived from 2 cases with CDX2-high subtype (202O-203 [left panel] and 202O-236 [right panel]) at the time of both initial diagnoses and either relapse (202O-203) or complete remission (202O-236) are shown (original magnification ×400). (E) The 323 cases of Ph– B-ALL plus 4 Ph+ ALL cases were clustered according to expression levels of CDX2, HOXA family genes (n = 11), HOXB family genes (n = 10), and MEIS1 using Ward’s correlation algorithms. Information on disease subtypes is shown at the top of the panel. (F) Methylation status of CpG dinucleotides of CDX2 promoter regions from 3 CDX2-high and 3 other B-ALL samples assessed by bisulfite sequencing. Each column represents sequenced clones. Methylated alleles (pink) and unmethylated alleles (blue) at 5 cytosine residues are indicated. HCT116 DKO and HCT116 gDNA were used as controls of unmethylated and methylated DNA, respectively. P values were calculated using Fisher’s exact test.
Novel subtype with high expression of CDX2. (A) Volcano plot comparing expression profiles of cases with CDX2-high subtype (n = 11) and other B-ALL cases (n = 316; including 4 Ph+ ALL). Genes with twofold or greater changes in expression and -log10 (q value) >5 are shown in red. (B) Box plot comparing fragments per kilobase of transcript per million (FPKM) of CDX2 in CDX2-high (n = 11), KMT2A (n = 14), ZNF384 (n = 73), Ph-like (n = 51), TCF3-PBX1 (n = 29), DUX4 (n = 24), MEF2D (n = 17) subtypes, other B-ALL cases (n = 108; including 4 Ph+ ALL), and normal B/T cells (n = 6). P values were calculated using the Wilcoxon rank-sum test. (C) CDX2 mRNA expression normalized to that of ACTB was determined using TaqMan reverse transcription-polymerase chain reaction analysis for CDX2-high ALL (n = 11), AML (n = 9; 3 clinical specimens and 6 cell lines [MV4-11, OCI-AML2, OCI-AML3, MOLM-13, THP-1, and NOMO1]), T-ALL (n = 16), and normal tissues (n = 8; colon, small intestine, brain, thymocytes, kidneys, lungs, liver, and heart). The abundance of CDX2 was further normalized to that of a normal colon. Data are shown as means from 3 independent experiments. (D) Sections of bone marrow (BM) clots immunostained with a CDX2 antibody to determine the expression levels of CDX2. Representative micrographs from specimens derived from 2 cases with CDX2-high subtype (202O-203 [left panel] and 202O-236 [right panel]) at the time of both initial diagnoses and either relapse (202O-203) or complete remission (202O-236) are shown (original magnification ×400). (E) The 323 cases of Ph– B-ALL plus 4 Ph+ ALL cases were clustered according to expression levels of CDX2, HOXA family genes (n = 11), HOXB family genes (n = 10), and MEIS1 using Ward’s correlation algorithms. Information on disease subtypes is shown at the top of the panel. (F) Methylation status of CpG dinucleotides of CDX2 promoter regions from 3 CDX2-high and 3 other B-ALL samples assessed by bisulfite sequencing. Each column represents sequenced clones. Methylated alleles (pink) and unmethylated alleles (blue) at 5 cytosine residues are indicated. HCT116 DKO and HCT116 gDNA were used as controls of unmethylated and methylated DNA, respectively. P values were calculated using Fisher’s exact test.
Next, we compared the expression of HOX family genes (HOXA and HOXB) and the HOX cofactor MEIS1 across all cases, as they are known to function downstream of CDX2. In agreement with previous reports,26HOX-related genes were repressed in most cases except in the KMT2A subtype, wherein HOXA3-HOXA10 was highly upregulated (Figure 2E). However, HOX genes were largely repressed in CDX2-high ALL, presenting only slight to moderate expression of HOXA10, HOXB2, and MEIS1, suggesting that dysregulation of HOX family genes may not be the primary cause of leukemogenesis in the CDX2-high subtype. Instead, we noted a significant upregulation of IGF1R accompanied by a significant downregulation of IGFBP7, a negative regulator of the IGF1 pathway (Figure 2A; supplemental Figure 6A,B).27 Concordantly, gene set enrichment analysis (GSEA) revealed enrichment of gene sets associated with the IGF1 pathway in CDX2-high ALL (supplemental Figure 6C,D).
TC-DNA-seq revealed 1q gain to be the most frequent and significantly correlated with CDX2-high ALL (7 of 9 cases; 78%) (Figure 1C; supplemental Figures 3 and 7A). Two individuals not included in the TC-DNA-seq analysis were found to harbor chromosome 1q gain using digital PCR, multiplex ligation-dependent probe amplification, or G-banding (supplemental Table 14). Chromosome 1q gain was highly suggestive of the CDX2-high subtype in unclassified B-ALL cases, as 7 of 8 cases (88%) exhibiting chromosome 1q gain that did not meet the criteria of any established subtype were classified in this subtype. Structurally, the chromosome 1q gain regions in this subtype showed single and continuous duplication, which differed from that in the TCF3-PBX1 subtype in which the breakpoints were near PBX1, and the copy number occasionally exceeded 4 (supplemental Figure 7B). Other recurrently mutated genes identified in CDX2-high ALL included PAX5 (n = 2), CDKN2A (n = 2), and ATM (n = 2) (Figure 1C). Although recurrent genetic alterations in the full-length CDX2 gene and its surrounding regions were not detected by WES (n = 7) and WGS (n = 3), bisulfite sequencing showed that the promoter region of CDX2 was significantly more hypomethylated in the CDX2 subtype than in other B-ALL subtypes (P < .01), suggesting a potential mechanism for the increased CDX2 expression (Figure 2F).
To validate the presence of the CDX2-high subtype in another cohort, we analyzed CDX2 expression in the US B-ALL cohort2 (n = 1988) using gene expression values for all patients from the St. Jude Cloud database (visualization community).28 High expression of CDX2 (fragments per kilobase of transcript per million >40) was observed in 4 patients (supplemental Tables 15 and 16). Consistent with the results from the Japanese cohort, all of these patients were found to belong to a unique cluster associated with high expression of IGF1R and low expression of IGFBP7, which were distinct from any other established subtypes upon tSNE analysis28 (supplemental Figure 8A,B).
Novel subtype with IDH1/2 mutations
We identified oncogenic IDH1 R132C (n = 3) and IDH2 R140Q (n = 4) mutations in AYA and adults with B-ALL. Importantly, a cluster enriched with IDH1 (n = 3) or IDH2 (n = 3) mutations was identified in tSNE analysis (Figure 1A). Another case with the IDH2 R140Q mutation, which was not included in the RNA-seq analysis, was also clustered into the IDH1/2-mutation group by methylation analysis (described below). In addition, none of the individuals with IDH1/2 mutations harbored any subtype-defining genetic lesions. These findings strongly suggest the presence of an IDH1/2 mutation-driven subtype (we named it the “IDH1/2-mut subtype”), especially when its founder effects are considered in other cancers such as in brain tumor and AML.29-31 Variant allele frequencies of the IDH1 R132C and the IDH2 R140Q mutations from the WES data suggested that IDH1/2 mutations were derived from clonal leukemic cells, with both mutations persistently observed in a relapsed specimen by IDH1/2 amplicon sequencing (Figure 3A; supplemental Table 17). GSEA revealed upregulation of genes associated with mitochondrial function in IDH1/2-mut ALL, which may compensate for mitochondrial dysfunction associated with loss of function of wild-type IDH1/2 genes, owing to an increase in the number of mitochondria (Figure 3B-D).32 The B-ALL entity of this subtype was also confirmed using a similar method as that for the CDX2-high subtype (supplemental Table 13; supplemental Figure 5; Figure 1C).
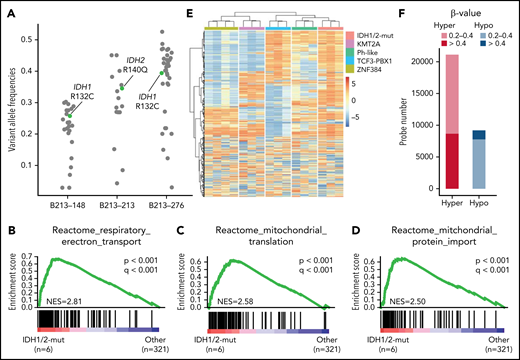
Novel subtype with IDH1/2 mutations. (A) Variant allele frequencies of IDH1/2 and other somatic mutations detected using whole-exome sequencing in 3 representative cases with IDH1/2 mutations. Variants in regions with abnormal copy number or with sequence depth <50 were excluded. IDH1 R132C and IDH2 R140Q mutations are shown in green. (B-D) Significantly enriched gene signatures for IDH1/2-mut ALL (n = 6) from GSEA of RNA sequencing data from 327 cases (323 Ph– B-ALL plus 4 Ph+ ALL) using Reactome gene sets. (E) DNA methylation clusters in 16 cases of B-ALL (supplemental Table 1), including cases of the IDH1/2-mut (n = 3), KMT2A (n = 3), Ph-like (n = 3), TCF3-PBX1 (n = 3), and ZNF384 (n = 4) subtypes with consensus unsupervised clustering with top 0.1% most variable methylation probes (n = 866) using Ward’s method. Information regarding disease subtypes is shown at the top of the panel. A case with IGH-CRLF2 (B213-069), which was not included in RNA-seq analysis, was assigned to the Ph-like group. (F) Differentially methylated regions in 3 IDH1/2-mut ALL cases compared with 13 other B-ALL cases. Statistically significant (q < 0.1) hyper (red) and hypo (blue) methylated probes, and the level of methylation are expressed by β value.
Novel subtype with IDH1/2 mutations. (A) Variant allele frequencies of IDH1/2 and other somatic mutations detected using whole-exome sequencing in 3 representative cases with IDH1/2 mutations. Variants in regions with abnormal copy number or with sequence depth <50 were excluded. IDH1 R132C and IDH2 R140Q mutations are shown in green. (B-D) Significantly enriched gene signatures for IDH1/2-mut ALL (n = 6) from GSEA of RNA sequencing data from 327 cases (323 Ph– B-ALL plus 4 Ph+ ALL) using Reactome gene sets. (E) DNA methylation clusters in 16 cases of B-ALL (supplemental Table 1), including cases of the IDH1/2-mut (n = 3), KMT2A (n = 3), Ph-like (n = 3), TCF3-PBX1 (n = 3), and ZNF384 (n = 4) subtypes with consensus unsupervised clustering with top 0.1% most variable methylation probes (n = 866) using Ward’s method. Information regarding disease subtypes is shown at the top of the panel. A case with IGH-CRLF2 (B213-069), which was not included in RNA-seq analysis, was assigned to the Ph-like group. (F) Differentially methylated regions in 3 IDH1/2-mut ALL cases compared with 13 other B-ALL cases. Statistically significant (q < 0.1) hyper (red) and hypo (blue) methylated probes, and the level of methylation are expressed by β value.
IDH1/2 hotspot mutations result in the production of the oncometabolite 2-HG, which causes aberrant methylation by partially inhibiting TET2 activity.33 Therefore, we performed DNA methylation array analyses for 3 patients with IDH1/2 mutations and 13 other B-ALL patients. Hierarchical cluster analysis using the most variable probes (n = 877) revealed 5 stable clusters with distinct methylation profiles depending on subtypes (Figure 3E; supplemental Figure 9A). IDH1/2-mut ALL showed a hypermethylation profile in both highly variable regions and differentially methylated regions compared with other B-ALL (Figure 3E,F). As only 2 genes (NRAS and IKZF1) were recurrently mutated in this subtype, we speculated that impaired expression of certain crucial genes, caused by aberrant DNA methylation, may play critical roles in leukemia development. Comparison of the IDH1/2-mut subtype with other subtypes, in the context of DNA methylation and gene expression, led to the identification of 178 differentially methylated and 457 differentially downregulated genes (supplemental Table 18). By combining these results, we identified 23 candidate tumor-suppressive genes associated with the IDH1/2-mut subtype, including ZEB2 and MEF2C, crucial regulators of B-cell development34-36 (supplemental Figure 9B,C).
Finally, we searched for IDH1/2 hotspot mutations in the US B-ALL cohort2 (n = 1988) using the St. Jude Cloud database,28 and identified at least 2 patients harboring IDH1 R132C mutations in this cohort (supplemental Table 16). Both patients showed specific gene expression profiles that differed from known subtypes with tSNE analysis, and no subtype-definitive genetic lesions were identified in these patients (supplemental Figure 8A).28
Clinical characteristics and outcomes of novel subtypes
The median ages at diagnosis for CDX2-high and IDH1/2-mut ALL were 36 years (range: 26 to 63) and 44 years (range: 17 to 53), respectively. As we used the same DNA analytical methods described in our recent study on childhood B-ALL,16 we were able to estimate the incidences of CDX2-high and IDH1/2-mut subtypes in Japanese AYA/adults (this study) and children (our recent study). In both cohorts, cases with chromosome 1q gain were considered to have the CDX2-high subtype unless classified into known subtypes, and IDH1/2 mutations were analyzed only for hotspots. We observed that the frequencies of CDX2-high and IDH1/2-mut subtypes in AYA/adults were significantly higher than those estimated in childhood; only 3 cases (0.3%) in the childhood cohort were considered to have CDX2-high subtype, and no cases showed hotspot IDH1/2 mutations (P < .01, both subtypes) (supplemental Figure 10A).16
Clinical outcomes also differed considerably among subtypes. ZNF384, TCF3-PBX1, DUX4, and MEF2D were associated with prolonged survival (5-year OS >70%) (supplemental Figure 10B-E; supplemental Table 19); in contrast, CDX2-high, IDH1/2-mut, and Ph-like subtypes were associated with unfavorable survival (5-year OS <40%) (Figure 4A-E; supplemental Table 19). As age and white-blood-cell (WBC) counts are well-established risk factors in B-ALL, a Cox proportional-hazards model was used to determine whether these subtypes were independent prognostic factors. TCF3-PBX1 and ZNF384 subtypes were identified as prognostic factors associated with favorable OS, independent of age, sex, and WBC counts, in a multivariate model (supplemental Table 20). Likewise, CDX2-high, IDH1/2-mut, and Ph-like subtypes were all associated with decreased OS (Table 2). Interestingly, despite the prognostic impact of these novel subtypes, WBC counts were considerably lower in these subtypes than in other high-risk subtypes, such as Ph-like and KMT2A (supplemental Figure 10F).
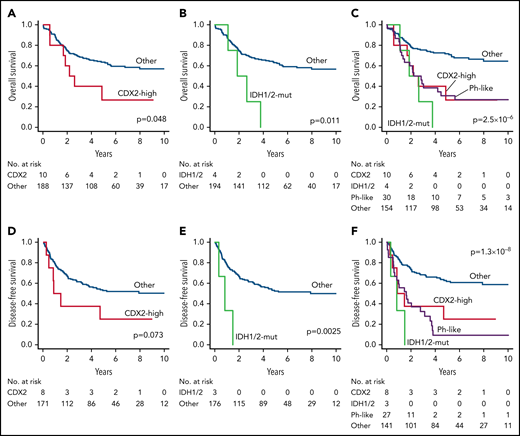
Clinical outcomes of novel subtypes in ALL202-U and ALL202-O studies. (A) Kaplan-Meier survival curves for OS; (A-C) and DFS; (D-F) for cases with and without CDX2-mut subtype (A,D), cases with and without IDH1/2-mut subtype (B,E), and cases with or without indicated subtypes (C,F). The prognostic impact on OS or DFS was evaluated using the log-rank test. Patients undergoing stem-cell transplantation (SCT) were not censored at the time of transplantation and were evaluated with inclusion of the posttransplantation period. CDX2, CDX2-high subtype; IDH1/2, IDH1/2-mut subtype.
Clinical outcomes of novel subtypes in ALL202-U and ALL202-O studies. (A) Kaplan-Meier survival curves for OS; (A-C) and DFS; (D-F) for cases with and without CDX2-mut subtype (A,D), cases with and without IDH1/2-mut subtype (B,E), and cases with or without indicated subtypes (C,F). The prognostic impact on OS or DFS was evaluated using the log-rank test. Patients undergoing stem-cell transplantation (SCT) were not censored at the time of transplantation and were evaluated with inclusion of the posttransplantation period. CDX2, CDX2-high subtype; IDH1/2, IDH1/2-mut subtype.
Risk factors associated with decreased OS
| Univariate | Multivariate | |||||
|---|---|---|---|---|---|---|
| Variables | HR | 95% CI | P | HR | 95% CI | P |
| Subtype | ||||||
| CDX2-high | 2.86 | 1.29-6.33 | .0097 | 3.48 | 1.54-7.86 | .0026 |
| IDH1/2-mut | 4.68 | 1.67-13.09 | .0033 | 4.86 | 1.70-13.91 | .0032 |
| Ph-like | 2.99 | 1.80-4.97 | 2.3 × 10⁻⁵ | 2.04 | 1.16-3.59 | .014 |
| Age ≥40 | 2.07 | 1.33-3.23 | .0013 | 2.13 | 1.34-3.38 | .0013 |
| Male sex | 1.29 | 0.83-2.01 | .27 | 1.41 | 0.88-2.26 | .15 |
| WBC ≥30 000 | 1.86 | 1.18-2.92 | .0074 | 1.81 | 1.07-3.06 | .028 |
References for categorial variables were as follows: cases not assigned to indicated subtypes, aged 39 years or younger, female sex, and WBC of less than 30 000. Patients undergoing stem cell transplantation were not censored at the time of transplantation. CI, confidence interval; HR, hazards ratio; WBC, white blood cells.
Discussion
This study was performed to clarify the genetic basis and transcriptome features of AYA and adults with B-ALL, which can provide a revised taxonomy of this disease (Table 1). The implications of our study are threefold: (1) differences in the distribution of each subtype partially accounted for the difference in the prognosis of B-ALL between AYA/adults and children. In particular, high-risk subtypes (Ph-like, KMT2A, BCL2/MYC, HoL, near-haploid, CDX2-high, and IDH1/2-mut) accounted for 30% of Ph− B-ALL in AYA/adults, whereas they accounted for <10% of cases in the childhood cohort in our previous study16; (2) the ZNF384 subtype in adults/AYA was noticeably more prevalent in our Japanese cohort (20% to 25% of Ph− B-ALL) than in a cohort of Westerners (only 2% to 3% of Ph− B-ALL),2 possibly reflecting ethnic differences; (3) the 2 novel subtypes (CDX2-high and IDH1/2-mut) identified in this study can be useful as decisive prognostic factors indicating poor clinical outcome.
The CDX2-high subtype is characterized by a unique gene expression profile; in particular, high expression of CDX2. Although CDX2 is not expressed in normal hematopoietic cells, previous studies have shown that it is transcriptionally expressed in 80% to 90% of patients with AML and ALL.23,24,37,38 Consistent with these reports, transcription of CDX2 was confirmed in many patients with B-ALL, although its level was only slightly higher than that in normal lymphocytes (Figure 2B). Herein, we identified a novel B-ALL subtype with high expression of the CDX2 protein (Figure 2D, supplemental Figure 4A,B). Significant hypomethylation of CDX2 promoter regions would be one of the mechanisms leading to a high expression of CDX2 in this subtype. The oncogenic activity of CDX2, illustrated by several studies using mouse transplantation models,23-2539 suggests that CDX2 plays a crucial role in leukemic transformation in this subtype. The contribution of the elevated expression of HOX genes to the leukemic transformation of normal hematopoietic progenitor cells, caused by CDX2 overexpression, has been alluded to in some studies,22,23 while other studies mentioned no contribution.21,25,38 Consistent with the observations of the latter group of studies,21,25,38 in this study, HOX family genes were not upregulated in the CDX2-high subtype (Figure 2E). IGF1 signaling might be one of the non-HOX oncogenic pathways activated in this subtype, although it remains uncertain whether CDX2 directly regulates it. In addition to known mechanisms of leukemogenesis, specific expression profiles, recurrent chromosome 1q gain, hypomethylated promoter region of CDX2, and unfavorable clinical outcomes characterize this novel subtype entity.
The IDH1/2-mut subtype is the second novel subtype identified in this study. Although IDH1/2 mutations are known as initiating or early genetic events in brain tumors and AML,29,30,40 only a few anecdotal reports19,41-46 have indicated the presence of IDH1/2 mutations in B-ALL and have been unclear as to the founder effect of IDH1/2 mutations in this disease. A review of these studies revealed that only IDH1 R132C and IDH2 R140Q were recurrent alterations in patients with B-ALL, as observed in our study (supplemental Table 21). Furthermore, genomic analysis of a patient with Maffucci syndrome who developed secondary B-ALL provided a hypothetical model in which leukemia evolved from mesoderm harboring the IDH1 R132C mutation.45 These findings, combined with our observations that IDH1/2 mutations and other founding genetic alterations were mutually exclusive in B-ALL (Figure 1C), and IDH1/2-mut ALL showed specific expression (Figure 1A) and hypermethylation profile (Figure 3E,F), which was clearly distinguishable between this subtype and other B-ALL subtypes, suggest that IDH1 R132C and IDH2 R140Q mutations may represent founding events in B-ALL development. Based on these novel insights, an IDH1 inhibitor (ivosidenib) and IDH2 inhibitor (enasidenib) should be considered for treatment of this subtype.
Our intensive genetic and transcriptomic analyses identified 2 novel subtypes that were previously overlooked due to their rare frequency, especially in childhood. However, there are several limitations of this study. First, we did not carry out in vivo functional analyses of CDX2 and IDH1/2 mutations on the development of B-ALL. The oncogenic capacity of these genes in the context of immature B cells should be investigated. Second, WGS and genome-wide DNA methylation analyses were performed on only a small proportion of the patient samples. The founding genetic lesions, the mechanisms that lead to high-level expression of CDX2, and the biological significance of 1q gain in the CDX2-high subtype need to be further clarified. Finally, our cohort number may be too small for the identification of precise frequencies and prognostic impacts of these novel subtypes.
Screening for these 2 novel subtypes in the clinic will help identify high-risk patients in AYA and adults (Figure 4A-F) who would otherwise be incorrectly assigned to a lower risk category based on low WBC counts. The screening can be performed only by sequencing hotspots of IDH1/2 genes and immunostaining for CDX2. Allogeneic stem cell transplantation is a therapeutic option that may be feasible and effective for patients who are identified with high-risk subtypes. Furthermore, our study revealed novel potential therapeutic targets: FLT3 mutations in the ZNF384 subtype (FLT3 inhibitor),47 and IDH1/2 mutations in the IDH1/2-mut subtype (IDH1/2 inhibitor).48,49 More precise classification of disease subtypes according to our new taxonomy will enable a more precise estimation of prognosis and guide the patients to select more effective treatments, resulting in the overall improvement of the clinical outcomes of AYA and adult B-ALL.
Acknowledgments
The authors thank Mika Fuyama, Kanako Okada, Masumi Hosaka, Tomomi Ishida, and Mayu Mouri for their technical assistance. They also appreciate Shokichi Tsukamoto for collecting sample materials of B-ALL patients. The authors thank all physicians participating in the ALL202-U, ALL202-O, and Ph−B-ALL213 studies for their cooperation. A list of centers and physicians that participated in the ALL202-O and Ph−B-ALL213 studies that provided clinical specimens is provided in the appendices.
This work was supported by Japan Agency for Medical Research (AMED) under grant numbers JP17cm0106525 (to T. Yasuda), JP16ck0106129, JP19ck0106331, JP20ck0106607 (to F.H.), JP19ck0106253, JP20cm0106472 (to M. Sanada) and JP16kk0205005 (to K.H. and S. Ogawa), P-Direct, Ministry of Education, Culture, Sports, Science and Technology of Japan (MEXT) under grant number JP15cm0106055 (to T.N.), JSPS KAKENHI under grant numbers 18K16103 (to T. Yasuda), 18H02835 (to F.H.), 20K08723 (to M. Sanada), Research Grant of the Princess Takamatsu Cancer Research Fund under grant number 16-24820 (to T. Yasuda), Takeda Science Foundation (to T. Yasuda), and Daiichisankyo Foundation of Life Science (to T. Yasuda). This work was also supported by MEXT as “Program for Promoting Researches on the Supercomputer Fugaku” and used computational resources of supercomputer Fugaku provided by the RIKEN Center for Computational Science (Project ID: hp200138).
Authorship
Contribution: T. Yasuda, M. Sanada, Y.H., T.N., and F.H. designed the study; S. Takada, M. Tanaka, S. Ota, N.D., E.Y., A.H., T.M., M. Sumi, S.S., N.T., Y. Nakamura, Y. Katsuoka, E.S., T. Kawamata, H.I., M. Taniwaki, N.A., Y.H., H.K., I.M., Y.M., and F.H. collected patient materials and clinical data from AYA and adult patients with B-ALL; M. Sanada, H.U., and K.H. collected the sequencing data from children with B-ALL; T. Yasuda, M. Sanada, M.K., S.K., H.U., E.I., Y.I.-Y., T. Yamada, T. Kanamori, S. Tsuzuki, Y.S., Y. Nannya, S. Ogawa, and H.M. performed sequencing data analysis; R.N. performed pathological analysis; T. Yasuda and Y. Kuwatsuka performed survival analysis; T. Yasuda, M. Sanada, M.K., S. Tsuzuki, T.N., and F.H. wrote the manuscript; and all authors reviewed the manuscript during its preparation.
Conflict-of-interest disclosure: T. Yasuda received research funding from Chugai Co., Ltd. M. Sanada received research funding from Otsuka Pharmaceutical Co., Ltd., and honoraria from Pfizer Inc., Amgen Inc., Astellas Pharma Inc., and Bristol Myers Squibb. M.K. received research funding from the Kobayashi Foundation for Cancer Research. S. Ota received research funding from Chugai Pharmaceutical Co., Ltd., Kyowa Kirin Co., Ltd., and Asahi Kasei Pharma, and honoraria from Novartis and Bristol Myers Squibb. N.D. received research funding from Astellas Pharma Inc., Celgene Co., Chugai Pharmaceutical Co., Ltd., Daiichi Sankyo Co., Ltd., Eisai Co., Ltd., Kyowa Hakko Kirin Co., Ltd., Otsuka Pharmaceutical Co., Ltd., Daiichi Sankyo Co., Ltd., AbbVie GK, Takeda Pharmaceutical Co., Ltd., Ono Pharmaceutical Co. Ltd., and Bristol Myers Squibb K.K., and an expert testimony fee from Otsuka Pharmaceutical Co., Ltd. E.Y. received research funding from LSI Medience Corporation. E.S. received research funding from Kyowa Hakko Kirin Co., Ltd., Chugai Pharmaceutical Co., Ltd., Eisai Co., Ltd. and Ono Pharmaceutical Co. Ltd.; and honoraria from Pfizer Japan Inc., Bristol-Myers Squibb., Novartis Pharma, Kyowa Hakko Kirin Co., Ltd., Chugai Pharmaceutical Co., Ltd., Janssen Pharmaceutical K.K., Takeda Pharmaceutical Company Ltd., Astellas Pharma Inc., Eisai Co., Ltd., Celgene Corporation, and Otsuka Pharmaceutical Co., Ltd. H.I. received research funding from Chugai Pharmaceutical Co., Ltd.; and honoraria from AbbVie GK, Novartis Pharma, and Janssen Pharmaceutical K.K. Y. Nannya received a consultant fee from and is a member of the advisory committee of Otsuka Pharmaceuticals. S. Ogawa received research funding from Chordia Therapeutics, Inc., Kan Research Laboratory, Inc., Otsuka Pharmaceutical Co., Ltd., Eisai Co., Ltd., and Dainippon-Sumitomo Pharmaceutical, Inc.; consultant fees from Chordia Therapeutics, Inc. and Kan Research Laboratory, Inc.; is a stockholder of RegCell Corporation, Ashahi Genomics, Chordia Therapeutics, Inc.; and is a member of advisory committees of the Japanese Society of Hematology and Japanese Cancer Association. M. Taniwaki received research funding from Astellas Pharma Inc., MSD K.K., Chugai Pharmaceutical Co., Ltd., Sanofi K.K., Daiichi Sankyo Company, Ltd., Kyowa Kirin Co., Ltd., Japan Blood Products Organization, Takeda Pharmaceutical Company Limited, and Otsuka Pharmaceutical Co., Ltd., and honoraria from Bristol-Myers Squibb Company, Chugai Co., Ltd., Celgene Corporation, Otsuka Pharmaceutical Co., Ltd., AstraZeneca PLC, and Astellas Pharma Inc. N.A. received research funding from Chugai Pharmaceutical Co., Ltd., Sumitomo Dainippon Pharma Co., Ltd., Eisai Co., Ltd., and Alexion Pharmaceuticals, Inc.; honoraria from Novartis Pharmaceuticals and Otsuka Pharmaceutical Co., Ltd.; and a consultant fee from Nippon Shinyaku Co., Ltd. Y.H. received honoraria from Kyowa Kirin and Chugai Pharmaceutical. H.K. received research funding from Fujifilm, Kyowa Hakko Kirin Inc., Bristol-Myers Squibb, Otsuka Pharmaceutical, Perseus Proteomics Inc., Daiichi-Sankyo, Abbvie, Cured Co., Astellas Pharma Inc., Chugai Pharmaceutical Co., Zenyaku Kogyo, Nippon Shinyaku Co., Eisai Co., Takeda Pharmaceutical Co., Sumitomo Dainippon Pharma Co., Novartis Pharma, Sanofi K.K., and Pfizer Inc., and honoraria from Bristol-Myers Squibb, Astellas Pharma Inc., and Novartis Pharma. I.M. received research funding from Chugai Pharmaceutical Co., Ltd., Eisai Co., Ltd., Ono Pharmaceutical Co. Ltd., Kyowa Kirin Co., Ltd., Shionogi & Co., Ltd., Sumitomo Dainippon Pharma Co., Ltd., Asahi Kasei Pharma Corporation, Takeda Pharmaceutical Company Ltd., Nippon Shinyaku Co. Ltd., Pfizer Japan Inc., Taiho Pharmaceutical Co., Mitsubishi Tanabe Pharma Corporation Ltd., Nihon Pharmaceutical Co., Ltd., Novartis Pharma KK, Daiichi Sankyo Co. Ltd., MSD K.K., Japan Blood Products Organization, Otsuka Pharmaceutical Co., Ltd., Mundipharma K.K., AbbVie GK., Sanofi K.K., Ayumi Pharmaceutical Corporation, and Eli Lilly Japan K.K., and honoraria from Pfizer Japan Inc., Novartis Pharma KK., Daiichi Sankyo Co. Ltd., Astellas Pharma Inc., Otsuka Pharmaceutical Co., Ltd., Amgen K.K., Bristol-Myers Squibb Company, and Janssen Pharmaceutical K.K. K.H. received research funding from Pfizer Japan Inc.; honoraria from Amgen Inc., Astellas Pharma Inc., Chugai Pharmaceutical Co., Ltd., and Novartis Pharma K.K.; and consultant fees from Kyowa Kirin Co., Ltd., Amgen Inc., Nippon Shinyaku Co. Ltd. T.N. received research funding from Novartis, Daiichi-Sankyo, and Fujifilm, and honoraria from Nipponshinyaku, Otsuka Pharma, Astellas Pharma, and Pfizer. Y.M. received research funding from Sumitomo-Dainippon, and honoraria from Novartis, Bristol-Myers Squib, Sumitomo-Dainippon, Kyowa-Kirin, Abbvie, Daiichi-Sankyo, Takeda, Janssen Pharmaceutical, Astellas, Pfizer, Eizai, Otsuka Pharmaceutical, Celgene, Sanofi, and Mundipharma. F.H. received research funding from Daiichi Sankyo, Chugai Pharmaceutical, and Astellas Pharma, MSD.
Correspondence: Takahiko Yasuda, Clinical Research Center, National Hospital Organization Nagoya Medical Center, 4-1-1, Sannomaru, Naka-Ku Nagoya, Aichi, 460-0001, Japan; e-mail: takahiko.yasuda@nnh.go.jp; and Fumihiko Hayakawa, Division of Cellular and Genetic Sciences, Department of Integrated Health Sciences, Nagoya University Graduate School of Medicine, 1-1-20, Daiko-minami, Higashi-ku, Nagoya, Aichi, 461-0047, Japan; e-mail: bun-hy@med.nagoya-u.ac.jp.
For original data, please contact the corresponding authors. TheA-seq and TC-DNA-seq data that support the findings of this study have been deposited in the DNA Data Bank of Japan (DDBJ) and are accessible through DDBJ accession numbers JGAS000275, JGAS000276, and JGAS000278. Other legacy data used in this study have also been deposited in DDBJ in previous projects under accession number JGAS000047.
The online version of this article contains a data supplement.
There is a Blood Commentary on this article in this issue.
The publication costs of this article were defrayed in part by page charge payment. Therefore, and solely to indicate this fact, this article is hereby marked “advertisement” in accordance with 18 USC section 1734.

This feature is available to Subscribers Only
Sign In or Create an Account Close Modal