

Key Points
Mogamulizumab induces skin rashes in 32% of CTCL patients, associated with higher overall survival.
Overexpression of CXCL9/11, macrophage infiltrate, recruitment of benign T-cell clones, tumor cell elimination were observed in skin rashes.

Abstract
Cutaneous T-cell lymphomas (CTCLs) are rare malignancies involving primarily the skin. Responses to treatment are usually short-lived in advanced CTCL. The determinants of long-term CTCL control are unclear. Mogamulizumab, an anti-human CCR4 antibody that acts by antibody-dependent cell cytotoxicity against CCR4+ CTCL tumor cells and peripheral memory blood regulatory T cells, has been associated with long-lasting remissions and immune adverse events. Here, we reported skin rashes in 32% of 44 patients with CTCL treated with mogamulizumab, associated with significantly higher overall survival (hazard ratio, 0.16; 0.04-0.73; P = .01). Rash occurred in patients with Sézary syndrome and was associated with longer time to progression. These rashes were characterized by a CD163+ granulomatous and/or CD8+ lichenoid skin infiltrate. High-throughput sequencing analysis of T-cell receptor β genes in skin and blood flow cytometry confirmed the depletion of CTCL tumor cells, as well as the recruitment of new reactive T-cell clones in skin at the time of skin rash. CXCL9 and CXCL11, two macrophage-derived chemokines that recruit CXCR3+ T cells to skin, were overexpressed in skin rashes. A higher frequency of TIGIT+ and PD1+ exhausted reactive blood T cells was observed at baseline in patients with rash, and this frequency decreased with mogamulizumab treatment. These data are consistent with mogamulizumab-induced long-term immune CTCL control by activation of the macrophage and T-cell responses in patients with rash.
Introduction
Cutaneous T-cell lymphomas (CTCLs) are a heterogeneous group of malignancies of skin-homing T cells. Mycosis fungoides (MF) and Sézary syndrome (SS) are the most frequent CTCL. Advanced-stage CTCLs are often refractory to therapies, with a median overall survival of 3 years. Although the duration of responses after treatment are usually short in these diseases, some patients experience long-term remissions. The determinants of long-term disease control, and the mechanisms of a putative antitumor immune response in T-cell lymphomas, have been poorly characterized. Mogamulizumab is a defucosylated anti-human CCR4 antibody that increases progression-free survival in relapsed or refractory CTCL.1 Mogamulizumab acts by depletion of CCR4-expressing cells by inducing antibody-dependent cellular cytotoxicity. These CCR4-expressing cells include malignant T cells and peripheral blood memory regulatory T cells.2 Mogamulizumab induces skin rashes in ∼25% of patients.1,3,4 We have previously reported rare cases of long-term remissions of advanced CTCL in patients who developed an autoimmune side effect after mogamulizumab treatment.5-7
These immune side effects, long-lasting remissions without treatment, and mogamulizumab-induced depletion of regulatory T cells led us to hypothesize an efficient activation of the antitumor immune responses, but the physiology of this equilibrium remains unclear. Here, we observed that a significant proportion of mogamulizumab-treated patients developed a skin rash under treatment, followed by a remission of the disease and higher overall survival. Overexpression of CXCL9 and CXCL11 (two macrophage-derived, interferon-inducible chemokines), recruitment of new benign T-cell clones in skin, and gradual elimination of the tumor clone were observed in these patients. Exhausted reactive blood T-cell counts decreased with treatment in these patients. These data provide evidence of the role of the antitumor immune response in malignant T-cell clearance, long-term T-cell lymphoma control, and reveal the key role of macrophages in this process.
Methods
Patients
Adult patients with relapsed or refractory MF or SS after at least 1 systemic treatment were included at the start of mogamulizumab treatment after informed consent was received. CTCL staging was defined according to the international criteria.8,9 Patients were enrolled in the MAVORIC (Mogamulizumab Versus Vorinostat in Previously Treated Cutaneous T-Cell Lymphoma) clinical trial1 or received mogamulizumab after the drug’s European market authorization. This study received the approval of the local ethics committee (CPP 2019-A01158-49) and was conducted in accordance with the principles of the Declaration of Helsinki. This case-control study was conducted at Saint-Louis Hospital between November 2013 and September 2021. Patients receiving mogamulizumab for the treatment of MF or SS were considered eligible, and all eligible patients were included.
Patients received mogamulizumab 1 mg/kg IV injection every week in the first month and every 2 weeks thereafter up to disease progression, complete remission, or occurrence of severe toxicity. No concomitant lymphoma treatment was used except for topical corticosteroids. Blood samples were prospectively collected at the treatment onset, then at day 15, month 1, month 2, and at least every 3 months thereafter. Peripheral blood mononuclear cells were isolated and stored in 10% dimethyl sulfoxide in liquid nitrogen. Plasma samples were stored at −80°C. Lesional skin biopsy specimens were taken at baseline (before onset of treatment with mogamulizumab) and in case of suspicious skin rash or lymphoma progression with a 4-mm punch, and then formalin-fixed and paraffin-embedded (FFPE).
Immunohistochemistry
For each skin biopsy, FFPE tissue sections were immunostained by using anti-CD3 (polyclonal; Dako, Glostrup, Denmark), CD4 (SP35 clone; Roche, Basel, Switzerland), CD7 (CBC.37 clone; Dako), CD8 (C8/144B clone; Dako), CD30 (Ber-H2 clone; Dako), PD1 (NAT105 clone; Abcam, Cambridge, UK), CD163 (10D6 clone; Leica Biosystems, Buffalo Grove, IL), and FoxP3 (236A/E7 clone; Abcam) antibodies and analyzed on a BenchMark ULTRA automated immunostainer (Roche). We determined the percentage of PD1-expressing cells over total lymphoid cells (ie, neoplastic and non‐neoplastic cells) and CD4/CD8 ratio. We counted immunoreactive cells for CD8, CD163, and FOXP3 in 5 high-power fields and calculated the mean number of immunoreactive cells per high-power field (×400 magnification; AxioImagerA.2 microscope; Zeiss, Oberkochen, Germany).
Flow cytometry
Immunophenotype of peripheral blood mononuclear cells was studied as described in the following text at baseline, 3 months after, and at the time of skin rash. Absolute lymphocyte count was determined by using the BD Trucount system (BD Biosciences, Franklin Lakes, NJ).
Eight-color staining was performed on fresh whole blood using the following monoclonal antibodies (mAbs): anti–CD3 APC-H7, –CD4 V500, –CD8 PerCP, –CD45 PerCP, or –CD45 APC-H7, –CD16 PECy7, –CD56 PECy7, –CD26 FITC, –CD7 APC, –CD45RA APC, –CD25 PECy7, –CD127 FITC, and –CCR4 BV421. The anti-KIR3DL2/CD158k mAb termed MOG1-M-K322-13E4 (murine IgG1) was kindly provided by Innate Pharma (Marseille, France). Acquisition was performed by using an FACSCanto II cytometer (BD Biosciences), and data were analyzed by using FACSDiva software (BD Biosciences).
Additional 17-color staining was performed on thawed peripheral blood mononuclear cells and Brilliant Stain Buffer (BD Biosciences), after treatment with DNase I (Thermo Fisher Scientific, Waltham, MA; 80 UI/mL in RPMI 1640 during 30 minutes at 37°C), with the following mAbs (all from BD Biosciences except as noted): anti–CD3 AF700, –CD4 APCH7, –CD8 BV510, –CD158k PE (Innate Pharma, IgG1 clone 13E4), –TCRVβ FITC (Beckman Coulter), –CD26 BV421, –CCR4 PE-CF594, –CD25 BV786, –CD127 BV711, –PD-1 BV711, and –TIGIT PE-Cy7 (BioLegend). Intracellular stainings were performed with the Foxp3/Transcription Factor Staining Buffer Set (eBioscience, Thermo Fisher Scientific) according to the manufacturer’s instructions, using anti–Foxp3 BV421 (BioLegend) mAbs. Acquisition was performed on an LSR Fortessa cytometer (BD Biosciences) after the calibration of each fluorescence intensity using Rainbow Calibration Particles (8 peaks) (BD Biosciences). 7-AAD+ dead cells were excluded. Data were analyzed by using FlowJo LLC software (BD Biosciences).
Sézary cells were identified among KIR3DL2+ and/or TCRVβ+ lymphocytes, after exclusion of CD8+ T cells and CD16+ and/or CD56+ NK cells.10 In case no clone was identifiable by commercially available anti-TCRVβ mAbs, the consistency between the population of CD4+CD26– cells and KIR3DL2+ lymphocytes was controlled. The population of regulatory T cells was gated among CD127loCD25hiCD4+ T cells.
High-throughput sequencing of TCRB gene
TCRB high-throughput sequencing was performed on lesional skin at baseline and at the time of skin rash. DNA was extracted from at least 10 scrolls of FFPE biopsy specimens by using the Maxwell RSC DNA FFPE Plus Kit (Promega, Madison, Wisconsin). TCRB libraries were prepared by using the immunoSEQ Kit (Adaptive Biotechnologies, Seattle, WA) on a minimum of 100 ng of DNA, according to the manufacturer’s instructions, and sequenced on a MiSeq system (Illumina, San Diego, CA) at Saint‐Louis Hospital. High-throughput sequencing TCRB data were analyzed by using an ImmunoSEQ Analyzer (Adaptive Biotechnologies).11
Transcriptomic experiments
Transcriptomic experiments were performed in skin at baseline and at the time of skin rash. Total RNA was extracted from skin biopsy samples by using the RNeasy FFPE kit (Qiagen, Germantown, MD). Quality control assessment such as RNA integrity and concentration was performed by using capillary electrophoresis (Bioanalyzer, Agilent Technologies) and RNA 6000 Pico chips. RNA samples used from human Clariom S hybridization had a median DV200 of 63.5% (minimum, 26%; maximum, 82%). RNA purity was monitored with NanoDrop ND8000, and median R260/280 and R260/230 were 1.78 (1.41-2.14) and 1 (0.71-1.83), respectively. To hybridize Clariom S microarrays, 2 ng of total RNA were amplified according to the Pico in vitro transcription (IVT) protocol. Twelve polymerase chain reaction cycles were conducted at the pre-IVT amplification step as recommended by the supplier. Two distinct quality controls were performed during the preanalytical steps to control the amount and size of amplified complementary RNAs (cRNAs) and amount of labeled DNAs, prior to microarray hybridization. Briefly, a minimum of 81 µg of cRNA was generated after IVT. Due to the fact that RNA was derived from FFPE samples, distribution of cRNA molecules generated from FFPE-derived RNAs ranged from 25 to 200 nt (80.5% of cRNA; 18% of 201-1000 nt). Homogeneous profiles were obtained from FFPE samples. An internal control (MAQC A sample), derived from fresh frozen material, was analyzed in parallel of FFPE samples. As expected, the cRNA profile of the control showed larger fragments (28% of cRNA fragments ranging between 25 and 201 nt, 50% between 201 and 1000 nt, and 22% ranging from 1001 to 8000 nt). Single-stranded DNA was generated with 20 µg of cRNA, and purified DNA was quantified. Median amount of single-stranded DNA was 9.23, and 5.5 µg was used for fragmentation and labeling of all samples. The Clariom S microarrays were hybridized following the supplier recommendations. Primary analysis of raw data was conducted with Expression Console and Transcriptome Analysis Suite (Thermo Fisher Scientific) to monitor distribution of probe intensities, signals of hybridization and wash and stains spike in controls, and to monitor normalized data.
Transcriptomic analysis
The Affymetrix Human Clariom S data set was analyzed as previously described (PMID: 33087502, 33495975, and 33613548). Data were normalized by using quantile normalization. Background corrections were made with antigenomic probes. Only probes targeting exons annotated from FAST DB transcripts (v2018_1) were selected to focus on well-annotated genes in which messenger RNA sequences are in public databases. Poor-quality selected probes (eg, probes labeled by Affymetrix as “cross-hybridizing”) and probes whose intensity signal was too low compared with antigenomic background probes with the same GC content were removed from the analysis. Only probes with a DABG P value ≤.05 in at least one-half of the arrays were considered for statistical analysis. Only genes expressed in at least one compared condition were analyzed.
We performed a paired or unpaired Student t test to compare gene intensities in the different biological replicates depending on comparisons. Genes were considered significantly dysregulated when fold-change (FC) was ≥1.5 and the uncorrected P value was ≤.05. Pathway analyses were performed by using WebGestalt (PMID: 31114916) merging results from upregulated genes only, downregulated genes only, and all dysregulated genes. Pathways and networks were considered significant with P values ≤.05. Deconvolution analysis was performed by using GEDIT (PMID: 33590863) using dedicated signatures (PMID: 23915137). Percentages of cell types from each sample were obtained by using GEDIT12 with the skin transcriptomic signature of Swindell et al.13
Single-cell RNA-sequencing analysis
Publicly available data were accessed from the Gene Expression Omnibus database (accession number GSE128531). These data contain gene expression profiles of skin biopsy specimens from 4 healthy volunteers, 3 tumor-stage MF lesions of different patients, 1 biopsy specimen of an erythrodermic MF patient, and one from a SS patient as described in Gaydosik et al.14 Median age was 64 years (range, 46-83). Biopsy proceedings, library preparation, single-cell RNA-sequencing, and patient characteristics are described elsewhere.14 Briefly, droplet-based sequencing was performed after enzymatic digestion of the tissue samples. A median of 4467 cells (range, 2200-9272) were analyzed per sample.
Data analysis was performed by using SeqGeq (BD Life Sciences, Ashland, OR). After quality control and exclusion of dead cells,15 semi-supervised clustering of cells was performed by using the PhenoGraph package16 and identified by using characteristic marker genes.15 Absolute gene expression and differential gene expression (DEG) were analyzed between cell clusters after applying the Benjamini-Hochberg procedure to control the false discovery rate. To investigate which cell types expressed specifically selected genes, a gating strategy was used, similar to flow cytometry, defining positive cells by having at least 10 copies per cell. DEG was studied between the positive cells and all cells. Results were visualized by using ViolinBox plugin by using raincloud plots and correlation plots.
Survival and statistical analysis
All statistical calculations were performed by using GraphPad Prism version 9 for Mac OS X. Results are reported as mean ± SD or median (interquartile range). Medians between 2 groups were compared by using the Mann-Whitney U test, and medians between 3 groups were compared by using the Kruskal-Wallis test. Proportions were compared by using the Fisher exact test. Correlation coefficients were determined by using the Spearman rank‐order correlation. A two-sided α value <0.05 was considered significant. Overall survival was calculated from the date of biopsy to death from any cause or last follow‐up. The study was closed for analysis on November 1, 2021. Survival curves and times to progression and to next treatment were estimated by using the Kaplan-Meier method, and comparison between curves was performed by using the log‐rank test. Missing data were handled as missing.
Results
Mogamulizumab-associated rashes correlate with mogamulizumab efficacy and increased survival in CTCL
Forty-four patients (9 MF, 35 SS) were enrolled, of whom 14 (32%) developed at least 1 rash during the follow-up. The mean time to the first rash was 100 days after treatment onset (range, 15-336 days) (Tables 1 and 2). Mean age was 66 years (range, 33-87 years). Current stage at baseline was Ia to IIa in 8 patients (18%), IIB in 1 (2%), III in 6 (14%), and IV in 29 (66%). Current skin involvement, measured by using mSWAT (Modified Severity-Weighted Assessment Tool), was 85 (range, 0-200). Patients had received a mean number of 4 (range, 1-9) previous systemic treatment lines. The most frequent previous treatments were bexarotene (34%), histone deacetylase inhibitor (25%), and chemotherapy (25%). The only significant baseline differences between patients who developed a rash and patients who did not was the treated disease (100% of patients with rash had SS vs 70% of patients without rash; P = .04), time from diagnosis (shorter in patients with rash associated with mogamulizumab [RAM]; P = .02), and number of previous systemic treatment lines (lower in patients with RAM; P = .04). At the time of skin rash, most patients presented with erythematous papules and plaques (72%), and 36% had associated autoimmune adverse events (vitiligo, alopecia areata, thyroiditis, and hepatitis) (Table 2). Mogamulizumab was withdrawn in 10 cases and re-introduced in 6 cases. Four patients developed a second skin rash after treatment rechallenge.
Baseline characteristics of the patients
| Characteristic | All patients (N = 44) | Patients with RAM (n = 14) | Patients without RAM (n = 30) | P |
|---|---|---|---|---|
| Age, y | 65.8 [33-87] | 67.8 [33-83] | 65 [33-87] | .33 |
| Sex | .52 | |||
| Male | 23 (52) | 6 (43) | 17 (57) | |
| Female | 21 (48) | 8 (57) | 13 (43) | |
| ECOG performance status | .06 | |||
| 0 | 28 (64) | 12 (86) | 16 (53) | |
| 1 | 10 (23) | 0 (0) | 10 (33) | |
| 2 | 2 (4) | 0 (0) | 2 (7) | |
| 3 | 1 (2) | 0 (0) | 1 (3) | |
| NA | 3 (7) | 2 (14) | 1 (3) | |
| Disease type | .04 | |||
| MF | 9 (20) | 0 (0) | 9 (30) | |
| SS | 35 (80) | 14 (100) | 21 (70) | |
| mSWAT | 85 [0-200] | 74 [13.5-174] | 90 [0-200] | .52 |
| LDH, UI/L | 372 [181-603] | 384.5 [253-589] | 365 [181-603] | .50 |
| No. of previous treatment lines | 5.2 [1-11] | 4 [1-10] | 5.8 [1-11] | .19 |
| No. of previous systemic treatment lines | 4 [1-9] | 3 [1-6] | 4 [1-9] | .04 |
| Time from diagnosis, d | 1393 [142-41 632] | 762 [238-41 423] | 1904 [142-41 632] | .02 |
| Latest treatment before mogamulizumab | .35 | |||
| Bexarotene | 15 (34) | 7 (50) | 8 (27) | |
| Interferon | 2 (4) | 0 (0) | 2 (7) | |
| Methotrexate | 1 (2) | 1 (7) | 0 (0) | |
| HDAC inhibitor | 11 (25) | 3 (21) | 8 (27) | |
| Conventional chemotherapy | 11 (25) | 3 (21) | 8 (27) | |
| Brentuximab vedotin | 2 (4) | 0 (0) | 2 (7) | |
| Lacutamab (anti-KIR3DL2) | 2 (4) | 0 (0) | 2 (7) |
Data are presented as mean [range] or No. (%) among patients.
Bold in P value column indicates P < .05.
ECOG, Eastern Cooperative Oncology Group; HDAC, histone deacetylase; LDH, lactate dehydrogenase; NA, not available.
Clinical and histologic characteristics of MARs
| RAM | |
|---|---|
| No. of rash episodes/patient (n = 14 patients) | |
| 1 | 10 (71) |
| 2 | 4 (29) |
| Mean time to first skin rash, d (n = 14 patients) | 100 [15-336] |
| Rash CTCAE grade (n = 18 rashes) | |
| 1 | 4 (22) |
| 2 | 11 (61) |
| 3 | 2 (11) |
| NA | 1 (6) |
| Clinical presentation (n = 18 rashes) | |
| Papules or plaques | 13 (72) |
| Macules without papules or plaques | 5 (28) |
| Facial edema | 5 (28) |
| Mucosal involvement | 3 (17) |
| Erythroderma | 2 (11) |
| Scaling of the scalp | 2 (11) |
| Pustules | 1 (6) |
| Histopathologic patterns (n = 18 rashes) | |
| Granulomatous | 10 (56) |
| Lichenoid | 9 (50) |
| Psoriasiform/spongiotic | 13 (72) |
| Immunohistochemical analysis (n = 18 rashes) | |
| Intraepidermal CD8+ T cells | 13 (72) |
| CD4+/CD8+ T-cell ratio | 3.5 [0.25-10] |
| PD1+ cells (% lymphoid cells) | 28.9 [0-80] |
| Associated findings (n = 14 patients) | |
| Pruritus | 6 (43) |
| Fever | 2 (14) |
| Elevated serum creatinine | 1 (7) |
| Autoimmune disease (vitiligo, alopecia areata, autoimmune hepatitis, autoimmune thyroiditis) | 5 (36) |
| Management (n = 18 rashes) | |
| Hospital admission | 1 (6) |
| Class III topical steroids | 12 (67) |
| Class IV topical steroids | 4 (22) |
| Antihistamines | 2 (11) |
| No specific treatment | 1 (6) |
| Discontinuation of mogamulizumab (n = 18 rashes) | |
| No | 8 (44) |
| Yes, temporarily | 6 (33) |
| Yes, permanently | 4 (22) |
| Recurrence after rechallenge (n = 6 rechallenges) | 4 (66) |
Data are presented as No. (%) among patients or as mean [range]. CTCAE, Common Terminology Criteria for Adverse Events; NA, not available.
The best overall response was partial or complete response in 25 patients (57%). Time to next treatment was significantly longer in patients who developed a RAM compared with patients who did not (P = .01). Time to progression was also significantly longer in patients with RAM compared with patients with no RAM (P = .01), and this comparison held true when taking into account SS patients only (P = .04) (Table 3). We present an example of a SS patient who developed a RAM (Figure 1A) associated with a polyclonal T-cell infiltrate in the skin (Figure 1B) and complete remission without treatment 18 months after (Figure 1C). The number of Sézary cells evaluated by blood flow cytometry decreased sharply between baseline and the time of skin rash (Figure 1D). Atypical lymphoid cells were observed in skin biopsy samples in a minority of patients with rash (Table 2). The tumor clone frequency in skin was significantly reduced in skin compared with baseline (n = 14) and further reduced at the time of the second rash in 3 evaluable patients (Figure 1E). This was not observed in patients treated with mogamulizumab who did not present with a rash. Altogether, these results suggest that skin rash is associated with a reduction of the tumor burden in patients treated with mogamulizumab. Consistent with this hypothesis, there was a significantly longer overall survival in patients who developed a rash compared with patients who did not (P = .008) (Figure 1F). This remained true when considering only patients with SS (P = .02).
Response to mogamulizumab and follow-up data in the 44 study patients
| All patients (N = 44) | SS patients with RAM* (n = 14) | Patients without RAM (n = 30) | P (RAM vs no RAM) | MF patients (n = 9) | SS patients (n = 35) | SS patients without RAM (n = 21) | P (SS – RAM vs no RAM) | |
|---|---|---|---|---|---|---|---|---|
| BOR in skin | ||||||||
| Progression | 8 (18) | 2 (14) | 6 (20) | .41 | 2 (22) | 6 (17) | 4 (19 | 1 |
| Stable disease | 10 (23) | 3 (21) | 7 (23) | 3 (33) | 7 (20) | 4 (19) | ||
| PR | 22 (50) | 9 (64) | 13 (43) | 3 (33) | 19 (54) | 10 (53) | ||
| CR | 4 (9) | 0 (0) | 4 (13) | 1 (11) | 3 (9) | 3 (14) | ||
| PR + CR | 26 (59) | 9 (64) | 17 (57) | 4 (44) | 22 (63) | 13 (62) | ||
| BOR in blood in SS patients | ||||||||
| Progression | 1 (3) | 0 (0) | 1 (3) | .65 | NA | 1 (3) | 1 (3) | .50 |
| Stable disease | 1 (3) | 0 (0) | 1 (3) | 1 (3) | 1 (3) | |||
| PR | 15 (40) | 7 (50) | 8 (27) | 15 (40) | 8 (27) | |||
| CR | 18 (54) | 7 (50) | 11 (37) | 18 (54) | 11 (37) | |||
| PR + CR | 33 (94) | 14 (100) | 19 (63) | 33 (94) | 19 (63) | |||
| BOR overall (skin and blood) | ||||||||
| Progression | 9 (20) | 2 (14) | 7 (23) | .33 | 2 (22) | 7 (20) | 5 (24) | .74 |
| Stable disease | 10 (23) | 3 (21) | 7 (23) | 3 (33) | 7 (20) | 4 (19) | ||
| PR | 21 (48) | 9 (64) | 12 (40) | 3 (33) | 18 (54) | 9 (43) | ||
| CR | 4 (9) | 0 (0) | 4 (13) | 1 (11) | 3 (9) | 3 (14) | ||
| PR + CR | 25 (57) | 9 (64) | 16 (53) | 4 (44) | 21 (60) | 12 (57) | ||
| Time to BOR | 333 [15-2121] | 453 [21-1893] | 273 [15-2121] | .19 | 120 [35-284] | 382 [15-2121] | 332 [15-2121] | .34 |
| Follow-up duration, d | 681 [23-2223] | 887 [118-2223] | 605 [23-2096] | .93 | 413 [24-978] | 768 [23-2223] | 688 [23-2096] | .98 |
| Duration of mogamulizumab, d | 449 [7-2357] | 490 [57-2047] | 430 [7-2357] | .39 | 170 [7-631] | 521 [14-2357] | 542 [14-2357] | 1 |
| Still under mogamulizumab at last follow-up | 3 (7) | 1 (7) | 2 (7) | 1 | 0 (0) | 3 (9) | 2 (10) | 1 |
| Time to next treatment, d | 434 [23-2567] | 1650 [127-2482] | 215 [23-2567] | .01 | 158 [24-942] | 652 [23-2567] | 365 [23-2567] | .06 |
| Time to progression, d | 353 [7-2567] | 1650 [120-2482] | 181 [7-2567] | .01 | 113 [7-942] | 444 [18-2567] | 341 [18-2567] | .04 |
Data are presented as No. (%) among patients or as mean (range).
BOR, best overall response; CR, complete response; HDAC, histone deacetylase; HSCT, hematopoietic stem cell transplantation; PR, partial response.
All patients with RAM were SS patients.
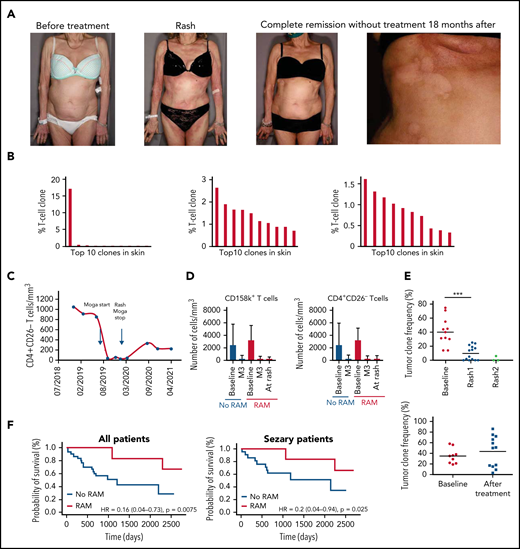
MARs correlate with mogamulizumab efficacy and increased survival in CTCL. (A) Clinical pictures of a patient with MAR before mogamulizumab (far left), at the time of MAR 7 months later (center-left), and in complete remission without treatment after rash (center-right) with close-up on hypopigmented macules consistent with vitiligo minor 18 months after onset of the treatment (far right). (B) Histogram of the top ten T-cell clone frequencies in skin in this patient before mogamulizumab (dominant T-cell clone, left), at the time of MAR 7 months later (middle, polyclonal pattern), and in complete remission without treatment after rash (right, polyclonal pattern) by high-throughput sequencing data of T-cell receptor gene β in skin. (C) Flow cytometry of peripheral blood T cells in this patient showing complete blood remission at the time of rash and 18 months later (<250 CD4+CD26– T cells/mm3). (D) Flow cytometry of peripheral blood CD158k+ (left) and CD4+CD26– T cells (right) in patients treated with mogamulizumab with and without rash showing a sharp decrease in the blood tumor burden (as measured by the absolute number of CD158k+ and CD4+CD26– T cells) at the time of rash (if any) and 3 months after onset of the treatment in both groups. (E) Tumor clone frequencies in patients with rash (upper panel) and no rash (lower panel) at baseline, at the time of first and second rashes, and at baseline and during follow-up, respectively, by high-throughput sequencing of T-cell receptor gene β in skin showing a significant decrease in the skin tumor burden at the time of the first rash; further decrease at the time of the second rash is noted in patients with rash. (F) Kaplan-Meier curves of overall survival in mogamulizumab-treated CTCL patients with (red) and without(blue) rash (upper panel) and in the subgroup of patients with SS (lower panel). ***P < .001. HR, hazard ratio; M3, month 3.
MARs correlate with mogamulizumab efficacy and increased survival in CTCL. (A) Clinical pictures of a patient with MAR before mogamulizumab (far left), at the time of MAR 7 months later (center-left), and in complete remission without treatment after rash (center-right) with close-up on hypopigmented macules consistent with vitiligo minor 18 months after onset of the treatment (far right). (B) Histogram of the top ten T-cell clone frequencies in skin in this patient before mogamulizumab (dominant T-cell clone, left), at the time of MAR 7 months later (middle, polyclonal pattern), and in complete remission without treatment after rash (right, polyclonal pattern) by high-throughput sequencing data of T-cell receptor gene β in skin. (C) Flow cytometry of peripheral blood T cells in this patient showing complete blood remission at the time of rash and 18 months later (<250 CD4+CD26– T cells/mm3). (D) Flow cytometry of peripheral blood CD158k+ (left) and CD4+CD26– T cells (right) in patients treated with mogamulizumab with and without rash showing a sharp decrease in the blood tumor burden (as measured by the absolute number of CD158k+ and CD4+CD26– T cells) at the time of rash (if any) and 3 months after onset of the treatment in both groups. (E) Tumor clone frequencies in patients with rash (upper panel) and no rash (lower panel) at baseline, at the time of first and second rashes, and at baseline and during follow-up, respectively, by high-throughput sequencing of T-cell receptor gene β in skin showing a significant decrease in the skin tumor burden at the time of the first rash; further decrease at the time of the second rash is noted in patients with rash. (F) Kaplan-Meier curves of overall survival in mogamulizumab-treated CTCL patients with (red) and without(blue) rash (upper panel) and in the subgroup of patients with SS (lower panel). ***P < .001. HR, hazard ratio; M3, month 3.
Mogamulizumab-associated rashes are characterized by macrophage and CD8 T-cell infiltration with a peculiar histologic and gene expression pattern
Histopathologic examination of 18 skin rash biopsy samples revealed a variably associated granulomatous pattern in 56%, lichenoid pattern in 50%, and psoriasiform/spongiotic pattern in 72% (Figure 2A-C). Intra-epidermal CD8+ T cells were present in 72% of cases. Immunostaining analyses showed a significant and continuous increase of CD163+ cells per high-power field at first and second rash compared with baseline (baseline, 114 ± 34; first rash, 178 ± 39; and second rash, 487 ± 217; P = .0005). This was the same for CD8+ T cells (baseline, 31 ± 19; first rash, 92.5 ± 42; and second rash, 177.5 ± 75; P = .0001), whereas FOXP3+ regulatory T cells did not decrease significantly (Figure 2A-C).
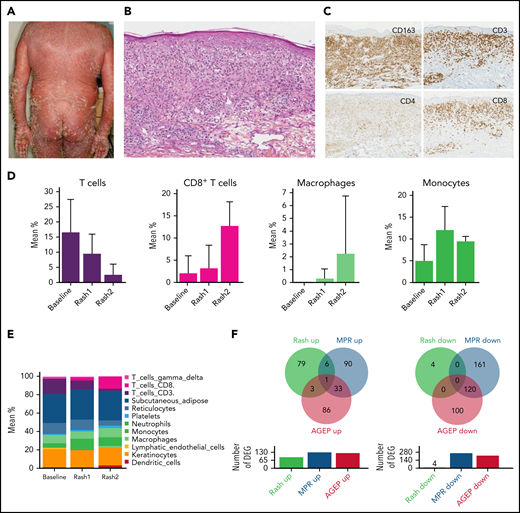
MARs are characterized by macrophage and CD8 T-cell infiltration with a peculiar histologic and gene expression pattern. (A) Clinical picture of a representative patient with MAR. (B) Histopathology of a lesional biopsy specimen of MAR. Magnification ×200; hematoxylin-eosin stain. Granulomatous infiltrate of the upper and mid dermis. (C) Immunohistochemistry (CD3, CD4, CD8, and CD163) on a lesional skin biopsy specimen of MAR. Magnification ×200.The infiltrate comprises macrophages (CD163) and a predominance of CD8 T cells, including intraepidermal CD8 T cells. (D) Histograms of T cell, CD8 T cell, macrophage, and monocyte mean percentages in skin at baseline, first rash, and second rash. (E) Histograms of cell populations: mean percentages in skin at baseline, first rash, and second rash. (F) Venn diagrams of differentially expressed genes (DEG) in MARs compared with MPRs and AGEP.
MARs are characterized by macrophage and CD8 T-cell infiltration with a peculiar histologic and gene expression pattern. (A) Clinical picture of a representative patient with MAR. (B) Histopathology of a lesional biopsy specimen of MAR. Magnification ×200; hematoxylin-eosin stain. Granulomatous infiltrate of the upper and mid dermis. (C) Immunohistochemistry (CD3, CD4, CD8, and CD163) on a lesional skin biopsy specimen of MAR. Magnification ×200.The infiltrate comprises macrophages (CD163) and a predominance of CD8 T cells, including intraepidermal CD8 T cells. (D) Histograms of T cell, CD8 T cell, macrophage, and monocyte mean percentages in skin at baseline, first rash, and second rash. (E) Histograms of cell populations: mean percentages in skin at baseline, first rash, and second rash. (F) Venn diagrams of differentially expressed genes (DEG) in MARs compared with MPRs and AGEP.
Deconvolution analyses of the transcriptomic profiles in skin revealed that the mean percentage of total CD3+ T cells decreased between baseline, first rash, and second rash (P = .002), whereas the percentage of CD8+ T cells increased (P = .02). There was also a marked increase in the percentage of macrophages and monocytes in the first rash 1 (P = .001) and the second rash (P = .002) vs baseline (Figure 2D-E).
To further understand the mechanism of mogamulizumab-associated rash (MAR), we compared the DEG in MAR vs baseline with those of 2 different drug skin reactions: acute generalized exanthematous pustulosis (AGEP) and maculopapular rash (MPR) vs normal human skin. There were very few common upregulated genes in MAR and AGEP (n = 4) and MAR and MPR (n = 7), whereas AGEP and MPR shared 34 upregulated genes. Consistently, no downregulated gene was shared between MAR and AGEP or MAR and MPR, whereas AGEP and MPR shared 120 downregulated genes (Figure 2F). These results suggest that mogamulizumab-induced rashes have a distinctive pathophysiology involving CD8 T cells and cells of the monocyte/macrophage lineage.
CXCL9 and 11, two macrophage-derived chemokines, are upregulated in the skin of MARs
A total of 93 genes were significantly dysregulated in MAR skin vs baseline (89 upregulated genes and 4 downregulated genes; FC > 1.5, P < .05). The most downregulated gene was CCR4, the molecular target of mogamulizumab (FC = 4.1; P = 8.10−5), which could reflect the elimination of CCR4-expressing cells (including tumor cells). The 3 most upregulated genes were the two type I interferon-induced chemokines, CXCL11 (FC = 3.2; P = 4.10−3) and CXCL9 (FC = 2.9; P = 5.10−3), and IFI44L (P = 2.9, P = .01), an interferon-stimulated gene (Figure 3A). Of note, the top 10 upregulated genes in MAR included FCGR1A (encoding the Fc γ receptor CD64) and FCGR2C (encoding the Fc γ receptor CD32), notably expressed by macrophages and involved in phagocytosis. Several genes associated with the exocytosis of cytotoxic T-cell granules were also upregulated (GZMK, KLRC4, NKG7, and GZMA), as well as genes encoding the HLA class II molecules HLA-DPB1, HLA-DQA1, HLA-DMA and HLA-DRB6.
![Upregulation of CXCL9 and CXCL11 in MARs and evidence that these chemokines are macrophage derived in CTCL skin. (A) Volcano plot of differentially expressed genes in total skin at the time of skin rash compared with baseline showing upregulation of CXCL9, CXCL11, and IFI44L and downregulation of CCR4 in CTCL of 14 patients treated with mogamulizumab. (B) T-stochastic neighbor embedding (t-SNE) of single-cell RNA expression data showing the main cell populations in the skin and the expression of CXCL9, CXCL10, and CXCL11, mainly by macrophages, and CXCR3 by lymphocytes in patients with CTCL. (C) Coexpression matrix displayed as heatmap, confirming the expression of CXCR3 by cells that express lymphocyte markers and CXCL9 by cells that express macrophage markers. (D) Normalized expression values of CXCR3, CXCL9, and CXCL11 displayed according to cell type. (E) Raincloud plot displaying expression levels of CXCR3 by CD8 T cells and CXCL9 and CXCL11 by macrophages, listed by patient (healthy donor [HD] vs tumor-stage MF [TMF], erythrodermic MF [EMF], or SS). (F) Cell–cell communication pathways between the main cell compartments in advanced CTCL skin highlighting the antitumoral lymphocyte response and the key factors from the tumor microenvironment.](https://ash.silverchair-cdn.com/ash/content_public/journal/blood/139/12/10.1182_blood.2021013341/3/m_bloodbld2021013341f3a.png?Expires=1769123502&Signature=q9sbP9iJfx9-UBAfty3WycbAW63GdDHDkuyptsg1u4-jzbHqWm6rIyRMo3p-Nf3Jlc~JjUulzaSkRro854wJAdeDCKZXu34eDG6AyAcyAo0VLPA6L9F10bSlwyYezcISNbx~i2eLOnhJDLk5boh095sbjjeVEuvg7XiL~E0IW5PTggc6Ws5WeIYHTnEPt1TN176jGJ5UuDxOuz8KzT0yTBeMyU~kl1OMC2nyk1EfVbY1t~3jTO2atSNVvcGzP34OUe9JsE8mQ4FMa9etCrdGZWOdLUYqP~3cslGLI6~6rFWhseOH17q5mmMCYRIq9qm7Xu3WIDZJRWT3mrUu6Go4SA__&Key-Pair-Id=APKAIE5G5CRDK6RD3PGA)
![Upregulation of CXCL9 and CXCL11 in MARs and evidence that these chemokines are macrophage derived in CTCL skin. (A) Volcano plot of differentially expressed genes in total skin at the time of skin rash compared with baseline showing upregulation of CXCL9, CXCL11, and IFI44L and downregulation of CCR4 in CTCL of 14 patients treated with mogamulizumab. (B) T-stochastic neighbor embedding (t-SNE) of single-cell RNA expression data showing the main cell populations in the skin and the expression of CXCL9, CXCL10, and CXCL11, mainly by macrophages, and CXCR3 by lymphocytes in patients with CTCL. (C) Coexpression matrix displayed as heatmap, confirming the expression of CXCR3 by cells that express lymphocyte markers and CXCL9 by cells that express macrophage markers. (D) Normalized expression values of CXCR3, CXCL9, and CXCL11 displayed according to cell type. (E) Raincloud plot displaying expression levels of CXCR3 by CD8 T cells and CXCL9 and CXCL11 by macrophages, listed by patient (healthy donor [HD] vs tumor-stage MF [TMF], erythrodermic MF [EMF], or SS). (F) Cell–cell communication pathways between the main cell compartments in advanced CTCL skin highlighting the antitumoral lymphocyte response and the key factors from the tumor microenvironment.](https://ash.silverchair-cdn.com/ash/content_public/journal/blood/139/12/10.1182_blood.2021013341/3/m_bloodbld2021013341f3b.png?Expires=1769123502&Signature=rpmyvISM0fy1aNVZMHo4rC4dVh-dy0pcRcbEQ3uAIOfu2yCrGgXIhxlIHE0wYcNJUh4sVrhB0JSfXzqZxoOlA9l1hJgmWVdGdUB~wJlMMdCSUvnIIQpC61tS4HCbPrzMYOkAaIQD5O80LsWZuFhRG7sj2G8fsjSKC8WXeyTL~SFCFT-X6EZ3fKX1mz--36nzeepp2Rm2frvcWI6jZD8PyGUEOXneMdD0THhYcLJSHcxwhIhgSkPNu7aVXbENEnqHdGXEU1Mpq~DbHLbfKGtESyGJu9htIsI-k2DS1VaEtB13NOGFABVr2Wm1sUkGMpRnVc4nYJTwbeZE223mxnZhfQ__&Key-Pair-Id=APKAIE5G5CRDK6RD3PGA)
Upregulation of CXCL9 and CXCL11 in MARs and evidence that these chemokines are macrophage derived in CTCL skin. (A) Volcano plot of differentially expressed genes in total skin at the time of skin rash compared with baseline showing upregulation of CXCL9, CXCL11, and IFI44L and downregulation of CCR4 in CTCL of 14 patients treated with mogamulizumab. (B) T-stochastic neighbor embedding (t-SNE) of single-cell RNA expression data showing the main cell populations in the skin and the expression of CXCL9, CXCL10, and CXCL11, mainly by macrophages, and CXCR3 by lymphocytes in patients with CTCL. (C) Coexpression matrix displayed as heatmap, confirming the expression of CXCR3 by cells that express lymphocyte markers and CXCL9 by cells that express macrophage markers. (D) Normalized expression values of CXCR3, CXCL9, and CXCL11 displayed according to cell type. (E) Raincloud plot displaying expression levels of CXCR3 by CD8 T cells and CXCL9 and CXCL11 by macrophages, listed by patient (healthy donor [HD] vs tumor-stage MF [TMF], erythrodermic MF [EMF], or SS). (F) Cell–cell communication pathways between the main cell compartments in advanced CTCL skin highlighting the antitumoral lymphocyte response and the key factors from the tumor microenvironment.
Upregulation of CXCL9 and CXCL11 in MARs and evidence that these chemokines are macrophage derived in CTCL skin. (A) Volcano plot of differentially expressed genes in total skin at the time of skin rash compared with baseline showing upregulation of CXCL9, CXCL11, and IFI44L and downregulation of CCR4 in CTCL of 14 patients treated with mogamulizumab. (B) T-stochastic neighbor embedding (t-SNE) of single-cell RNA expression data showing the main cell populations in the skin and the expression of CXCL9, CXCL10, and CXCL11, mainly by macrophages, and CXCR3 by lymphocytes in patients with CTCL. (C) Coexpression matrix displayed as heatmap, confirming the expression of CXCR3 by cells that express lymphocyte markers and CXCL9 by cells that express macrophage markers. (D) Normalized expression values of CXCR3, CXCL9, and CXCL11 displayed according to cell type. (E) Raincloud plot displaying expression levels of CXCR3 by CD8 T cells and CXCL9 and CXCL11 by macrophages, listed by patient (healthy donor [HD] vs tumor-stage MF [TMF], erythrodermic MF [EMF], or SS). (F) Cell–cell communication pathways between the main cell compartments in advanced CTCL skin highlighting the antitumoral lymphocyte response and the key factors from the tumor microenvironment.
CXCL9 and CXCL11 have previously been associated with CTCL remission17 and were shown to be 2 tumor-associated macrophage-derived chemokines required for effective antitumor immunity.18-20
Single-cell analysis revealed that CXCL9 and CXCL11 were produced by the macrophages as shown by their high expression levels in this cluster (Figure 3B) and correlation with CD163 expression (Figure 3C) and observed by normalized expression levels in each main cell type (Figure 3D). The examination of DEG between CXCL9-positive cells and total skin cells was consistent with this hypothesis, as several hallmark genes of macrophages (LYZ, HLA-DRA, AIF1, MMP9, CD68, CD163, and FCGR2A) were upregulated in CXCL9-positive cells (Figure 3C,E). The same observations were made for CXCL11-positive cells (HLA-DRA, AIF1, FCGR2A, and CD68). We thus hypothesized that macrophage-derived CXCL9 and CXCL11 recruited CXCR3-expressing reactive T cells in the tumor microenvironment at the time of skin rash. CXCR3 is the main receptor of CXCL9 and CXCL11 and attracts T cells to inflamed skin.21 The analysis of CXCR3 expression by human CTCL skin cells showed that CXCR3 was mainly expressed by effector lymphocytes (Figure 3B-C). CXCR3 expression correlated with CD8A and CD8B expression (Figure 3C). CXCR3-positive cells also expressed a significant number of genes produced by effector lymphocytes such as granulysin. Comparing expression levels at the patient level, we observed that those patients having higher expression of CXCL9 and CXCL11 by their macrophages had more CD8 T cells in the tumor microenvironment (Figure 3E). By detailed analysis of cell–cell communication pathways, CXCL9 and CXCL10 were found to be key players of macrophage–lymphocyte mediators in the context of CTCL (Figure 3F).
Activation of immune responses in patients with MARs
To gain insight into how mogamulizumab induces sustained remissions and clearance of the tumor clone, we studied immune homeostasis in the blood of patients with CTCL at baseline and during follow-up. At baseline, compared with patients without rash, patients with rash had significantly higher percentages (Figure 4A) and absolute numbers (data not shown) of PD1-positive and TIGIT-positive benign (KIR3DL2- and TCRVβ) CD4 T cells (P < .05) that decreased at the time of skin rash and at 3 months. This denotes the presence of exhausted benign CD4 T cells at baseline in patients with MAR and could reflect a mogamulizumab-induced activation of the immune response. Consistent with this hypothesis, the 2 most enriched pathways by gene set enrichment analysis of DEG in skin were the interferon-α and interferon-γ responses (Figure 4B). Reactome analysis revealed the enrichment of the immune system, cytokine signaling and interferon signaling pathways suggesting a T helper 1 cell polarization in the tumor microenvironment (Figure 4C). High-throughput sequencing of T-cell receptor β locus in skin at the time of rash showed the recruitment of numerous benign T-cell clones in skin (in red), which expanded at the time of the second rash. In all patients, the T-cell skin infiltrate mostly comprised new T-cell clones that had entered the skin between baseline and time of skin rash. The tumor T-cell clone (in blue) decreased to <25% of skin T cells in all but 2 patients (Figure 4D). This finding supports the hypothesis of CXCL9- and CXCL11-induced recruitment of putative antitumor T cells in skin.
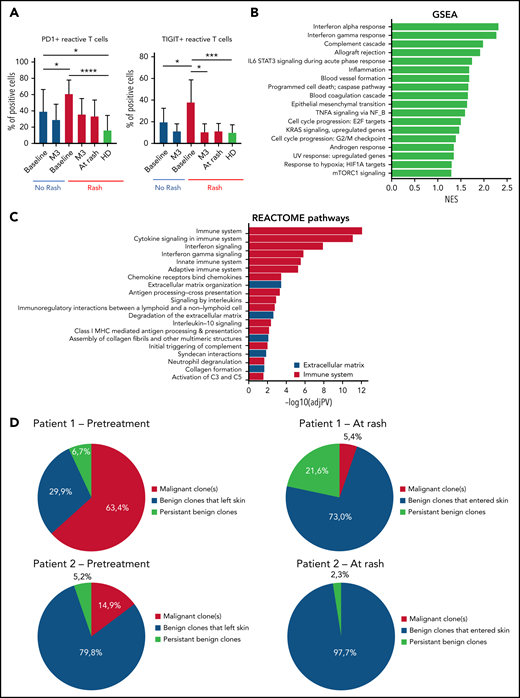
Activation of the immune responses in patients with MARs. (A) Flow cytometry percentages of PD1+ and TIGIT+ reactive CD4 T cells of the peripheral blood at baseline/rash/3 months (M3) in patients with and without rash. (B) Gene set enrichment analysis (GSEA) of differentially expressed genes in lesional skin of MARs compared with baseline. (C) Reactome pathway analysis of differentially expressed genes in lesional skin of MARs compared with baseline. (D) High-throughput sequencing data in skin of 2 representative patients at baseline and at the time of skin rash. The results show the recruitment of new benign T-cell clones in skin at the time of rash (all 14 patients were analyzed). *P < .05, **P < .01, ***P < .001, ****P < .0001. HD, healthy donor; IL-6, interleukin 6; mTORC1, mammalian target of rapamycin complex 1; NES, normalized enrichment score; TNFA, tumor necrosis factor alpha.
Activation of the immune responses in patients with MARs. (A) Flow cytometry percentages of PD1+ and TIGIT+ reactive CD4 T cells of the peripheral blood at baseline/rash/3 months (M3) in patients with and without rash. (B) Gene set enrichment analysis (GSEA) of differentially expressed genes in lesional skin of MARs compared with baseline. (C) Reactome pathway analysis of differentially expressed genes in lesional skin of MARs compared with baseline. (D) High-throughput sequencing data in skin of 2 representative patients at baseline and at the time of skin rash. The results show the recruitment of new benign T-cell clones in skin at the time of rash (all 14 patients were analyzed). *P < .05, **P < .01, ***P < .001, ****P < .0001. HD, healthy donor; IL-6, interleukin 6; mTORC1, mammalian target of rapamycin complex 1; NES, normalized enrichment score; TNFA, tumor necrosis factor alpha.
Discussion
Long-term immune control of the disease has previously been observed after cell therapy such as allogeneic stem cell transplantation in T-cell lymphomas.22-25 Long-lasting remissions without treatment have also been observed after mogamulizumab treatment and immune side effects leading to mogamulizumab withdrawal.5 Mogamulizumab induced best responses in SS compared with MF.1 In our series, MARs were observed only in patients with SS, consistent with other reports showing higher frequencies of MAR in SS compared with MF,26 consistent with a difference in the pathophysiology of the 2 diseases. The mechanism of these putative antitumor immune responses was still unclear. The lower efficacy of mogamulizumab in MF also remains to be elucidated. Studies have noted the absence of antibody-cell cytotoxicity effectors in skin, and the absence of recirculation of MF tumor cells in the blood, to explain the lower efficacy of therapeutic antibodies in MF compared with SS.27 Antitumor T-cell clones have previously been found in the skin of patients with SS.28 Here, we showed that skin rashes were associated with overexpression of the macrophage-derived CXCL9 and CXCL11 chemokines, recruitment of CD163+ macrophages and reactive CD8+ T cells in the skin, gradual elimination of the CD4+ tumor T-cell clone, and long-term overall survival. Consistent with these observations, the presence of benign T cells in CTCL skin has previously been associated with the T helper 1 cell–recruiting chemokines CXCL9, CXCL10, and CXCL11 after therapy.17 Our results thus emphasize the crucial role of macrophages in the induction of an antitumor immune response in this disease. Macrophages could be involved in malignant T-cell clearance by direct antibody-dependent cell phagocytosis, as suggested by the overexpression of genes encoding the Fc γ receptors CD32 and CD64 in MAR and/or by the recruitment of CD8 T cells. Phagocytosis of antibody-coated tumor cells could also enhance cross-presentation of tumor antigens and activate CD8 T cells, as previously shown in vitro in myeloma.29 The upregulation of genes associated with the exocytosis of cytotoxic T-cell granules in the skin of patients with MAR is consistent with this hypothesis.
In other preclinical and clinical studies in human cancer, a CXCL9-expressing, tumor-associated myeloid population was present in tumors before treatment with immune checkpoint inhibitors and predicted a favorable outcome.19 Tumor-associated macrophages were key regulators of anti–PD-L1 mediated CD8 T cell–dependent immunity. Emerging data suggest that expression of the chemokine CXCL9 by tumor-associated macrophages regulates the recruitment and positioning of CXCR3-expressing stem-like CD8 T cells that underlie clinical responses to anti–PD-L1 treatment.30 Lichenoid rashes with infiltration of CD8 T cells, similar to those observed with mogamulizumab by us and others,3 have been observed in cancer patients treated with immune checkpoint inhibitors.31 In adult patients with T-cell leukemia/lymphoma treated with mogamulizumab, CCR4+ T-cell depletion was associated with CD8 T-cell proliferation and diversification, which were significantly greater in patients with skin-related adverse events than in those without them.32
The significantly lower number of systemic treatment lines and shorter time from diagnosis in patients with RAM compared with patients without RAM in our study is also consistent with a global better immune status in patients with RAM at baseline, and putative potent antitumor immune response. Finally, the upregulation of interferon-stimulated genes in skin of patients with MAR, associated with a better prognosis, is consistent with the efficacy of interferon-α in CTCL,33 as well as topical Toll-like receptors agonists such as imiquimod34 and resiquimod,35 which could be used in combination with mogamulizumab to enhance the antitumor immune response. Systemically administered Toll-like receptor agonists have also been used in CTCL.36
In summary, our data are consistent with macrophage-derived CXCL9 and CXCL11 production in skin, recruitment of CXCR3-expressing newly emerged T-cell clones with a T helper 1 cell polarization in the tumor microenvironment, and MAR correlated with gradual tumor clone eradication and long-term overall survival in mogamulizumab-treated patients with CTCL.
Acknowledgments
The authors thank the patients enrolled in the present study and their families.
This study has been partially supported by a grant from Kyowa Kirin.
The sponsor had no influence on the study design and interpretation of data presented here. Any views, opinions, findings, or recommendations expressed in this material are solely of the authors and do not necessarily reflect those of ESMO.
Authorship
Contribution: D.D., M.R., C.C., H.L.B., P.d.l.G., A.M.-C., H.M.-T., and M. Battistella analyzed the data; A.d.M., G.D., and M. Battistella wrote the manuscript; M. Boisson, M.R., C.C., H.L.B., and P.d.l.G. performed the experiments; C.R.-W., M. Bagot, and A.d.M. enrolled the patients; and all authors critically reviewed the manuscript.
Conflict-of-interest disclosure: G.D. was supported by ESMO. M. Bagot has attended Kyowa Kirin advisory boards. The remaining authors declare no competing financial interests.
Correspondence: Maxime Battistella, Pathology Department, INSERM U976 “Human Immunology, Pathophysiology and Immunotherapy”, Saint-Louis Hospital, 1 ave Claude Vellefaux, 75010 Paris, France; e-mail: maxime.battistella@aphp.fr.
The publication costs of this article were defrayed in part by page charge payment. Therefore, and solely to indicate this fact, this article is hereby marked “advertisement” in accordance with 18 USC section 1734.

This feature is available to Subscribers Only
Sign In or Create an Account Close Modal