

TO THE EDITOR:
Multiple myeloma (MM) comprises a plasma-cell neoplasia associated with severe suppression of the cellular immune system and reduced immunoglobulin production.1,2 Owing to the disease and continuous therapies, most patients with MM lack normal plasma and B cells; hence, they are susceptible to severe infections. In line with that, the first US study on coronavirus disease 2019 (COVID-19) in MM patients reported mortality rates of almost 20%.3 As soon as the first vaccines against severe acute respiratory syndrome coronavirus 2 (SARS-CoV-2) became available, cancer patients were immunized with high priority.4-6 However, diminished humoral responses to different vaccines in patients with B-cell malignancies have been reported.7,8 Regarding the exceptional collective of patients with MM, a highly variable but impaired serological response to SARS-CoV-2 vaccination has recently been observed.9-14 Even lower serological immunization success rates were associated with concomitant therapy.12-14 Although the immune response after SARS-CoV-2 vaccination may also be mediated by T-cell-dependent mechanisms, there are no detailed data on the T-cell immune response after patients with MM had been vaccinated.15 Therefore, we have initiated a single-center observational study monitoring clinical features, immune cell status, serological and T-cell response after SARS-CoV-2 immunization.
Here, we report on the SARS-CoV-2-specific T-cell response following 2 doses of the BNT162b2 vaccine in a clinically well-defined cohort of patients with MM and address its correlation with serological response as well as immunological parameters before and after vaccination and in the context with the current therapy. Overall, 77 patients with MM and 24 controls were included in this interim analysis (supplemental Tables 1 and 2, available on the Blood Web site). The timespan between priming and second vaccination ranged from around 21 days (35 patients and 12 controls) to around 42 days (42 patients and 12 controls). Analysis of SARS-CoV-2 spike-binding immunoglobulin G (IgG) antibody levels after the second dose (median time, 21 days) revealed relatively lower median IgG levels (191.4 vs 1520.3 BAU/mL, P < .001; Figure 1A) and neutralization titers (NTs) against the SARS-CoV-2 wild-type (WT) strain (1:20 vs 1:80, P = .006; Figure 1B) and the α-variant B.1.1.7 (B.1.1.7) (1:10 vs 1:40, P < .001; Figure 1C) of patients with MM compared with healthy controls. Generating NTs against both strains was significantly impaired by concomitant MM therapy, but not by maintenance (Figure 1D,E). IgG and NT levels correlated well, and despite a trend toward lower NTs for B.1.1.7, no significant differences for WT and B.1.1.7 NTs could be observed (Figure 1F). Because NTs ≥1:20 are considered protective against SARS-CoV-2, patients with MM with NTs ≥1:20 were defined as serological responders, whereas patients with NTs <1:20 were defined as serological nonresponders.16,17 By receiver-operator curve (ROC) analysis, we identified IgG levels ≥143.5 BAU/mL to correspond with WT NTs of ≥1:20. Nonresponders displayed older age (70 vs 64 years, P = .028) and frequently received MM therapy (50.5% vs 19.5%, P = .011; supplemental Tables 1 and 5). Patients receiving lenalidomide maintenance or immunomodulatory drug-based therapy trended toward higher response rates without statistical significance because of low sample size or multidrug combinatorial treatment.
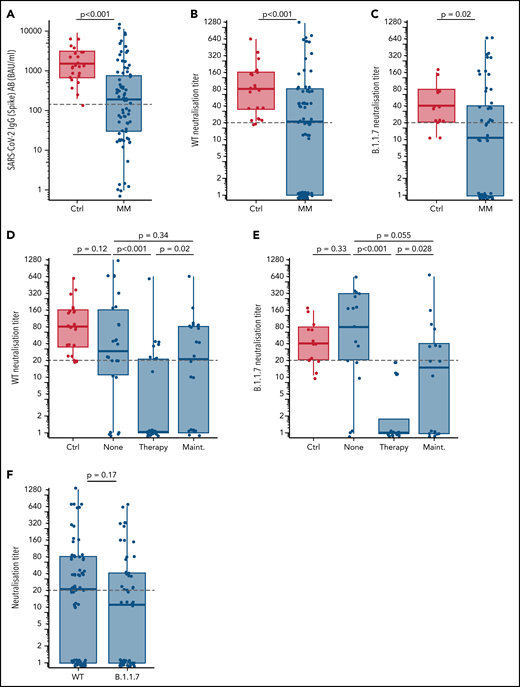
Serological response after two doses of mRNA SARS-CoV-2 vaccination. (A) SARS-CoV-2 (Spike) antibody (AB) levels stratified for healthy controls (Ctrl) vs patients with multiple myeloma (MM) (≥8.52-11 360 BAU/mL considered as positive). The gray dashed line denotes the spike IgG cutoff of 143.5 BAU/mL corresponding to a WT neutralization titer ≥1:20 as determined by ROC analysis. WT neutralization titers stratified for healthy controls vs patients with MM (B) and healthy controls in comparison with different therapy status (none, on therapy, and on maintenance) of patients with MM (D). B.1.1.7 neutralization titers stratified for healthy controls vs patients with MM (C) and healthy controls in comparison with different therapy status of patients with MM (E). (F) Comparison of neutralization titers against WT and B.1.1.7. Gray lines in panels B-F denote a neutralization titer ≥1:20 corresponding to adequate protective neutralization capacity. P values are corrected for multiple testing with the Benjamini-Hochberg method.
Serological response after two doses of mRNA SARS-CoV-2 vaccination. (A) SARS-CoV-2 (Spike) antibody (AB) levels stratified for healthy controls (Ctrl) vs patients with multiple myeloma (MM) (≥8.52-11 360 BAU/mL considered as positive). The gray dashed line denotes the spike IgG cutoff of 143.5 BAU/mL corresponding to a WT neutralization titer ≥1:20 as determined by ROC analysis. WT neutralization titers stratified for healthy controls vs patients with MM (B) and healthy controls in comparison with different therapy status (none, on therapy, and on maintenance) of patients with MM (D). B.1.1.7 neutralization titers stratified for healthy controls vs patients with MM (C) and healthy controls in comparison with different therapy status of patients with MM (E). (F) Comparison of neutralization titers against WT and B.1.1.7. Gray lines in panels B-F denote a neutralization titer ≥1:20 corresponding to adequate protective neutralization capacity. P values are corrected for multiple testing with the Benjamini-Hochberg method.
Further, T-cell response is induced by BNT162b2 and natural SARS-CoV-2 infection and plays a central role in shielding infection.18 However, it has been reported that SARS-CoV-2-specific T-cell responses were disturbed in cancer patients.19 Therefore, emphasis on T-cell responses in B-cell-deficient patients after vaccination is essential.
First, we analyzed immune cell subsets of MM patients’ peripheral blood before priming and after second vaccination and their correlation with serological responsiveness. Overall, patients with MM showed decreased CD19+ B-cell and CD4+ T-cell counts. Interestingly, no differences between serological responders and nonresponders were observed for CD3+ and CD8+ T-cell subsets and their activation state, whereas we observed a significantly lower median of CD19+ B-lymphocytes/µL of nonresponders compared with serological responders before and after vaccination. A significantly lower median of CD4+ T cells was further observed in serological nonresponders following the second vaccination (supplemental Figure 1).
Additionally, the functional T-cell response after 2 doses of SARS-CoV-2 vaccination was analyzed via enzyme-immunospot assay (ELISpot) in a subcohort of 38 patients with MM and 14 healthy controls (supplemental Table 4). Stimulation was performed with the receptor-binding domain (RBD), the S2-protein (S2), and CEF/CEFT control peptides to quantify spot forming units (SFUs) as parameter of vaccination-induced T-cell responsiveness (Figure 2A-C,E). ROC analysis revealed 55 SFUs per 3 × 10⁵ peripheral blood mononuclear cells (PBMCs) as threshold of a positive T-cell response with reasonable test sensitivity and false-positive rate (specificity >95% [95.5%] with sensitivity >50% [53.8%]; Figure 2D). Further, we used this cutoff to define T-cell responders and nonresponders: 44.2% (n = 23) of all investigated individuals reached ≥55 SFUs per 3 × 10⁵ PBMCs, whereas patients with MM displayed a lower probability of T-cell response compared with healthy controls (34.2% vs 71.4%, P = .037; supplemental Table 4). The RBD-specific response was impaired in patients with MM in contrast to healthy controls (P = .019; Figure 2A) and the response to S2, which is well conserved between different coronaviruses and less specific for SARS-CoV-2, displayed no significant differences (Figure 2B). Patients with MM showed a comparable response to healthy controls after CEF/CEFT control peptide stimulation (Figure 2C). Bivariate representation of serologic response and T-cell response levels showed that serologic responders of patients with MM often exhibited higher SFU compared with serologic nonresponders. However, some serologic MM nonresponders also achieved SFU counts above the threshold of 55 SFU per 3 × 10⁵ PBMCs (supplemental Figure 2A-F). No positive correlation was observed between T-cell and serologic responses in patients with MM (Figure 2F). In contrast, most healthy controls displayed high T-cell and serologic response values (Figure 2A-C). Here, response to S2 stimulation displayed a certain correlation with serologic response (supplemental Figure 2G). However, no independent factors contributing to impaired T-cell responses in patients with MM could be identified via multivariate logistic regression (Figure 2G).
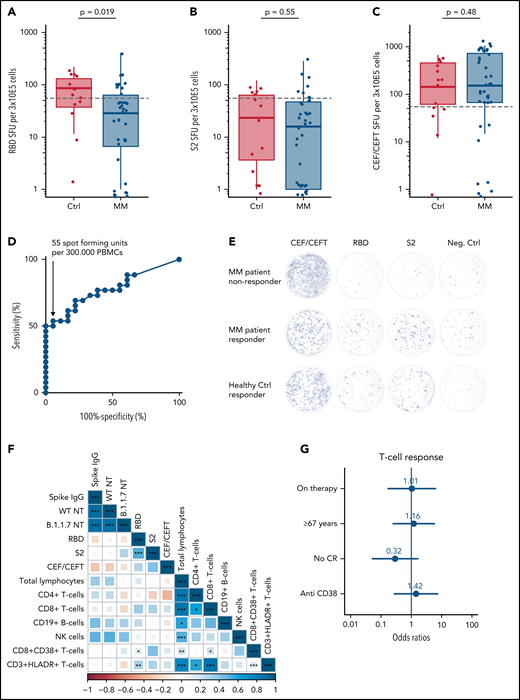
T-cell response after 2 doses of SARS-CoV-2 vaccination. (A) Receptor-binding domain (RBD)-specific spot-forming units (SFUs) per 3 × 10⁵ peripheral blood mononuclear cells (PMBCs) stratified for healthy controls (Ctrl) vs patients with MM for quantification of IFN-γ-mediated T-cell response. (B) S2-specific SFUs and (C) CEF/CEFT-specific SFUs per 3 × 10⁵ PBMCs stratified for Ctrls vs patients with MM. SFUs in the negative control were subtracted from all RBD, S2, and CEF/CEFT-peptide treated conditions to normalize for unspecific IFN-γ secretion. Dashed horizontal lines indicate cutoff, determined by ROC analysis for T-cell response (D). The graph shows the tests sensitivity plotted against the specificity (100% − proportion of false positives) measured by the IFN-γ response of healthy individuals before and after SARS-CoV-2 vaccination (T1 and T3) upon stimulation with S2 and RBD peptides (area = 0.7767; 95% confidence interval, 0.6431-0.9121, P = .002). We selected a cutoff value of 55 SFU per 3 × 10⁵ PBMCs because this value still yields a specificity >95% (95.5%), whereas the sensitivity is >50% (53.8%). (E) Representative images of IFN-γ ELISpot from patients with MM who did or did not respond in comparison with a healthy control who responded to the vaccination. (F) Spearman correlation matrix for levels of serologic response, T-cell response, and prevaccination immune cell status. The color axis corresponds to the Spearman correlation coefficient for each correlation. P values are reported as *<.05, **<0.01, ***<.001. (G) Multivariate logistic regression analysis for factors affecting achievement of T-cell response with numeric report of the odds ratio (OR) and P values <.05 are indicated with *.
T-cell response after 2 doses of SARS-CoV-2 vaccination. (A) Receptor-binding domain (RBD)-specific spot-forming units (SFUs) per 3 × 10⁵ peripheral blood mononuclear cells (PMBCs) stratified for healthy controls (Ctrl) vs patients with MM for quantification of IFN-γ-mediated T-cell response. (B) S2-specific SFUs and (C) CEF/CEFT-specific SFUs per 3 × 10⁵ PBMCs stratified for Ctrls vs patients with MM. SFUs in the negative control were subtracted from all RBD, S2, and CEF/CEFT-peptide treated conditions to normalize for unspecific IFN-γ secretion. Dashed horizontal lines indicate cutoff, determined by ROC analysis for T-cell response (D). The graph shows the tests sensitivity plotted against the specificity (100% − proportion of false positives) measured by the IFN-γ response of healthy individuals before and after SARS-CoV-2 vaccination (T1 and T3) upon stimulation with S2 and RBD peptides (area = 0.7767; 95% confidence interval, 0.6431-0.9121, P = .002). We selected a cutoff value of 55 SFU per 3 × 10⁵ PBMCs because this value still yields a specificity >95% (95.5%), whereas the sensitivity is >50% (53.8%). (E) Representative images of IFN-γ ELISpot from patients with MM who did or did not respond in comparison with a healthy control who responded to the vaccination. (F) Spearman correlation matrix for levels of serologic response, T-cell response, and prevaccination immune cell status. The color axis corresponds to the Spearman correlation coefficient for each correlation. P values are reported as *<.05, **<0.01, ***<.001. (G) Multivariate logistic regression analysis for factors affecting achievement of T-cell response with numeric report of the odds ratio (OR) and P values <.05 are indicated with *.
Concisely, patients with MM displayed a reduced T-cell response after 2 doses of SARS-CoV-2 vaccination compared with healthy controls. Previously, it was shown that CD8+ T cells might drive recovery from COVID-19 when humoral immunity is compromised.20 To better understand the distribution of SARS-CoV-2-specific T-cell subpopulations, we performed additional fluorescence-activated cell sorting analyses in a subcohort of patients and healthy controls. Here, we observed limited increase in interferon-γ (IFN-γ) and interleukin-2 presenting CD3+ T cells in patients with MM compared with healthy controls after SARS-CoV-2-specific peptide stimulation (supplemental Figure 2H). This observation was largely determined by lower frequencies of IFN-γ+ or interleukin-2+-secreting CD4+ T cells, whereas the frequency of respective CD8+ T cells after stimulation did not differ between patients and healthy controls (supplemental Figure 2I-P). These data are in line with our observation that the MM population is characterized by reduced CD4+ and normal CD8+ T-cell counts (supplemental Figure 1C,D).
Taken together, T-cell responses to RBD were significantly diminished in patients with MM compared with healthy controls, with only 34.2% of patients developing T-cell-derived immune response. T-cell response rates among serological responders (44.1%) vs nonresponders (44.4%) did not differ significantly. Regarding T-cell subset distribution, we identified reduced levels of SARS-CoV-2-specific IFN-γ+CD4+ but not of IFN-γ+CD8+ T cells in patients with MM.
In conclusion, we identified reduced serological and T-cell responses in patients with MM compared with healthy controls. Although more data with longer follow-up are expected from our longitudinal observational study, our data support the design of trials for repetitive boost vaccinations in immunocompromised patients, whenever possible in larger transnational consortia studies.8
In general, we urge for vaccination in all eligible individuals. Otherwise, there is an increasing risk of avoidable and potentially persistent infections and the evolution of novel virus strains with escape mutations to current vaccines and their spread into the communities.21-25 In cases where it is unknown whether an immunocompromised patient has achieved sufficient immunity to dominant variants, we recommend advising the patients to follow the rules established for nonvaccinated patients.
Acknowledgments
The authors thank all treating physicians and technical staff involved in patient care and data acquisition. The authors thank Franziska Kalensee for excellent technical and experimental support, Birgit Wilde for her administrative support, as well as Heinfried H. Radeke, Martina Herrero San-Juan, Thomas Wölfel, and Catherine Wölfel for their valuable support with the ELISpot analysis. The authors thank all patients and healthy donors for their participation in this study.
This study has been performed with support of the “Corona Fund” of the Goethe University Frankfurt (E.U. and M.A.R.), of the German Research Foundation DFG (E.U., J.C., and A.S. as members of the SFB/CRC/IRTG 1292), and of the HMWK (E.U.; “Sondervermögen Hessisches Ministerium für Wissenschaft und Kunst”).
Authorship
Contribution: J.C.E., J.C., A.S., E.W., H.H,. and M.W. performed experiments; J.C.E., J.C., A.S., M.A.R., S.W., and H.B. analyzed data; I.v.M., E.U., and J.C.E. designed the study; I.v.M. and E.U. directed the study; J.C.E. and S.W. performed statistical analysis; I.v.M., E.U., J.C.E., J.C., R.D., H.F.R., S.C., O.B., H.S., and B.S. discussed the results and interpreted the data together with all coauthors; and J.C.E., I.v.M., and E.U. wrote the manuscript with contributions from all authors.
Conflict-of-interest disclosure: S.C. has received honorarium for serving on a clinical advisory board for BioNTech. I.v.M. received honoraria for advising Pfizer, Sanofi, BMS, GSK, Amgen, Janssen, Takeda, and AstraZeneca. The remaining authors declare no competing financial interests.
Correspondence: Ivana von Metzler, Medizinische Klinik II, Universitätsklinik Frankfurt am Main, Theodor-Stern-Kai 7, 60590 Frankfurt, Germany; e-mail: Ivana.Metzler@kgu.de.
The online version of this article contains a data supplement.
There is a Blood Commentary on this article in this issue.

This feature is available to Subscribers Only
Sign In or Create an Account Close Modal