

Key Points
CUX1 recruits the histone methyltransferase EHMT2 to sites of DNA damage to promote γH2AX focus formation and DNA damage repair.
Loss of CUX1 drives clonal hematopoiesis following chemotherapy and predisposes mice to an aggressive t-MN.

Abstract
Therapy-related myeloid neoplasms (t-MNs) are high-risk late effects with poorly understood pathogenesis in cancer survivors. It has been postulated that, in some cases, hematopoietic stem and progenitor cells (HSPCs) harboring mutations are selected for by cytotoxic exposures and transform. Here, we evaluate this model in the context of deficiency of CUX1, a transcription factor encoded on chromosome 7q and deleted in half of t-MN cases. We report that CUX1 has a critical early role in the DNA repair process in HSPCs. Mechanistically, CUX1 recruits the histone methyltransferase EHMT2 to DNA breaks to promote downstream H3K9 and H3K27 methylation, phosphorylated ATM retention, subsequent γH2AX focus formation and propagation, and, ultimately, 53BP1 recruitment. Despite significant unrepaired DNA damage sustained in CUX1-deficient murine HSPCs after cytotoxic exposures, they continue to proliferate and expand, mimicking clonal hematopoiesis in patients postchemotherapy. As a consequence, preexisting CUX1 deficiency predisposes mice to highly penetrant and rapidly fatal therapy-related erythroleukemias. These findings establish the importance of epigenetic regulation of HSPC DNA repair and position CUX1 as a gatekeeper in myeloid transformation.
Introduction
A devastating sequela of the use of chemotherapy and/or irradiation is the development of a secondary malignancy. Therapy-related myeloid neoplasms (t-MNs) are blood cancers that develop as a consequence of genotoxic treatments for several conditions, most commonly cancer. t-MNs are associated with high-risk karyotypes, chemoresistance,1 and poor survival.2 As cancer survivors are a growing population,3 the incidence of t-MN is expected to rise. Treatment and prevention of this long-term side effect is of increasing importance.
Historically, t-MN was thought to be primarily driven by exposure to DNA-damaging agents and subsequent mutations in hematopoietic stem and progenitor cells (HSPCs). More recently, the etiology of this disease has been appreciated to also include inherited genetic predisposition, therapy-induced changes in the bone marrow microenvironment, and the selection of preexisting, somatically mutated hematopoietic stem cells (HSCs).4 The latter phenomenon, termed clonal hematopoiesis of indeterminate potential (CHIP), is linked to an elevated risk of t-MNs.5,6 This association evokes a model wherein clonal populations harboring certain mutations have a fitness advantage in the setting of chemotherapy and/or irradiation, outcompete wild-type counterparts, and transform. Somatic mutations have been found across a variety of genes and in a high percentage of healthy individuals,7 yet only some progress to either de novo or therapy-related malignancy.8 Mutations in epigenetic regulators, such as DNMT3A and TET2, are frequent in CHIP in healthy older adults.9,10 In contrast, DNA damage response (DDR) genes, such as TP53, are more commonly mutated in CHIP following cytotoxic therapy.11 Despite these patterns, which CHIP mutations confer the highest risk of transformation for either therapy-related or de novo disease is incompletely understood.
Monosomy 7 and del(7q) are adverse-risk cytogenetic abnormalities found in a variety of hematopoietic disorders including pediatric and adult myelodysplastic syndrome (MDS) and acute myeloid leukemia (AML).12-15 Most striking is the prevalence of −7/del(7q) in t-MNs, where it occurs in up to 49% of cases, and particularly those associated with exposure to alkylating agents.1 −7 and del(7q) are detected in CHIP and can be initiating events in transformation.16-19 However, the pathogenesis of −7/del(7q) in t-MNs remains unclear.
We identified CUX1 as a haploinsufficient tumor-suppressor gene encoded on 7q22.1.20,21 In addition to CUX1 loss through −7/del(7q), CUX1-inactivating mutations occur in CHIP, myeloid malignancies, and solid tumors.5,9,22-25 Furthermore, CUX1 mutations independently carry a poor prognosis in myeloid malignancies.25-27 CUX1 is a nonclustered HOX family transcription factor that is ubiquitously expressed and regulates critical cellular processes such as proliferation and differentiation in disparate cell types.20,28,29 To identify the role of CUX1 in hematopoiesis, we generated 2 doxycycline-inducible, short hairpin RNA (shRNA)-based transgenic CUX1-knockdown mouse lines. CUX1-knockdown mice develop MDS and MDS/myeloproliferative neoplasm (MPN).20 Thus, loss of this single 7q gene is sufficient to cause de novo myeloid malignancies.
In this study, we report that CUX1-knockdown mice are profoundly predisposed to alkylating agent–induced t-MNs. Mechanistically, we reveal a novel role for CUX1 in epigenetic regulation of the local DDR. Correspondingly, insufficient CUX1 disrupts DNA damage–induced epigenetic changes, leading to attenuated DNA damage focus formation and sustained DNA breaks. Our work illustrates the paradigm that preexisting somatic mutations are selected for and transform post–alkylating agent exposure and underscores the influence of defective DDR in t-MN susceptibility.
Methods
Colocalization
Colocalization was determined using code written to implement the intensity correlation analysis method developed by Li et al.30,31 Regions of interest corresponding to individual nuclei were segmented, cropped, and saved as intensity matrices. Corresponding matrices were transformed into colocalization scores. Pixels were considered to be colocalized if the intensity in a given pixel was above the mean intensity for an image in both channels. We reported the fraction of pixels within a given nuclear region of interest that was colocalized. This method is insensitive both to the amount of staining present in an image and variations in intensity between cells or regions of an image.
DDR treatments
The EHMT1 inhibitor UNC0642 (Selleck Chemicals) was used at a concentration of 10 nM in culture for the indicated length of time. Irradiation was induced by exposure to a 60Co source. Dosage rates varied between 10.5 and 9.1 cGy/s. Nonirradiated (NIR) samples were mock irradiated. N-ethyl-N-nitrosourea (ENU; Sigma) was dissolved in 10% ethanol (95%) and 90% phosphate-buffered saline and administered intraperitoneally (100 mg/kg). Etoposide (Sigma) was dissolved in dimethyl sulfoxide. Daunorubicin (Selleck Chemicals) was dissolved in water. Cisplatin was purchased from The University of Chicago pharmacy.
Bone marrow transplants
For competitive bone marrow transplants, 2 × 10⁶ red blood cell (RBC)-depleted cells were transplanted, with 20% Renilla luciferase (Ren), Cux1mid, or Cux1low cells and 80% wild-type competitor (C57BL/6, CD45.1) transplanted retro-orbitally into lethally irradiated (γ-irradiation, 8.5 Gy) C57BL/6 (CD45.1) recipient mice. Doxycycline (Dox) was given after transplant, and ENU was administered (100 mg/kg) intraperitoneally at week 5, with a second dose following 9 days later.
Results
CUX1 loss impairs EHMT2 recruitment to DNA breaks and disrupts DNA damage–induced histone methylation
CUX1 has been shown to accumulate at sites of DNA damage in nonhematopoietic cells,32 suggesting a direct and localized effect on DNA repair. We first verified this recruitment 1 hour postirradiation in MCF7 human breast cancer cells using ground state depletion (GSD) superresolution imaging of CUX1 colocalization with γH2AX, a marker of double-strand breaks (DSBs)33 (supplemental Figure 1A, available on the Blood Web site). We next determined whether this finding extended to hematopoietic cells using human K562 chronic myelogenous leukemia cells. We used GSD imaging and Förster resonance energy transfer (FRET) between γH2AX (donor) and CUX1 (acceptor) fluorophores (Figure 1A). One hour postirradiation, FRET was observed (Figure 1B), indicating that CUX1 is rapidly recruited to sites of DNA damage in hematopoietic cells.
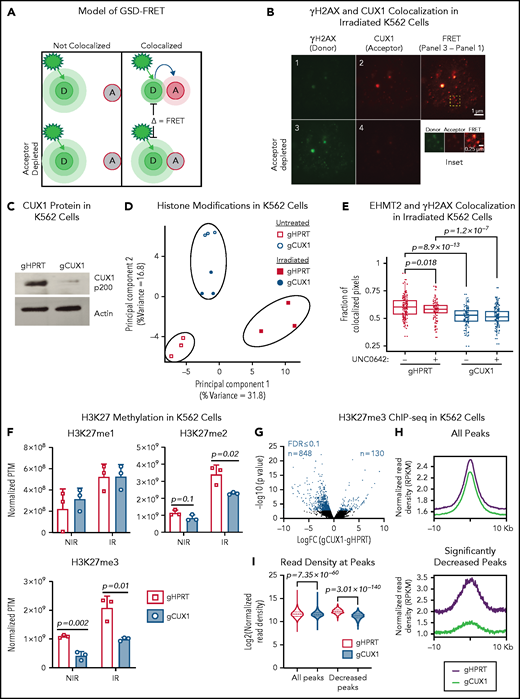
CUX1 loss impairs EHMT2 recruitment to DNA breaks and disrupts DNA damage–induced histone methylation changes. (A) Model of GSD-FRET. Target proteins are identified with antibodies tagged with either a donor (D) or acceptor (A) fluorophore. An image is taken using the donor excitation maxima. If the donor fluorophore is not near an acceptor fluorophore, the donor will emit all energy at the donor emission wavelength (left panel, top). If the donor is colocalizing with the acceptor fluorophore, some of the donor emission energy will be transferred to the acceptor, in proportion to the proximity to the acceptor (right panel, top). The samples are then bleached at the acceptor wavelength, and the bleached acceptors are no longer able to absorb energy. The samples are then reimaged at the donor excitation wavelength. Any increase in donor brightness in the second image compared with the first image is proportional to the energy that was previously transferred to the acceptor, or FRET (bottom right). If the molecules were not colocalizing, there will be no change in donor emission intensity, and no FRET (bottom left). (B) GSD-FRET analysis of colocalization between anti-γH2AX (donor) and anti-CUX1 (acceptor) in K562 cells. Scale bar, 1 μm. Bottom row images are following depletion of the acceptor fluorophore. Scale bar, 0.25 μm. Inset, representative FRET. Scale bar, 0.25 μm. Images shown are representative of results from 3 independent experiments. (C) Representative immunoblot for CUX1 protein in gHPRT and gCUX1 K562 cells (n = 3). (D) Principal component analysis of the histone posttranslational matrix (PTM) generated with EpiProfile analysis of histone PTMs in irradiated and mock-irradiated gHPRT and gCUX1 K562 cells. Histones were extracted 1 hour following irradiation (6 Gy). Results shown are derived from analysis of 3 independent samples. (E) Immunofluorescence imaging for EHMT2 and γH2AX colocalization 1 hour after irradiation (6 Gy). Colocalization was quantified in gHPRT and gCUX1 K562 cells after irradiation with or without the addition of an EHMT2 inhibitor, UNC0642, 60 minutes prior to irradiation. The fraction of colocalized pixels was calculated per nucleus. Results shown are a composite of 4 independent experiments. Significance was determined with a Student t test between indicated samples. (F) EpiProfile analysis of H3K27 methylation in irradiated and mock-irradiated gHPRT and gCUX1 K562 cells. Histones were extracted 1 hour following irradiation (6 Gy). Significance was determined with a Student t test between indicated samples. Results shown are derived from analysis of 3 independent samples. (G) ChIP-seq of H3K27me3 in K562 cells. Volcano plot showing differentially occupied ChIP-seq sites (n = 2) between clonal gHPRT and gCUX1 K562 cell lines. Each point is the average of 2 replicates. DiffBind was used to identify significantly differentially occupied sites. Red points indicate significance ≤10% FDR. (H) The panels depict a smooth line fit to the average column-wise read density for all differentially bound sites across the 20-kb window. Top panel, all H3K27me3 sites; bottom, only H3K27me3 sites significantly decreased in gCUX1 cells (10% FDR) (binomial P value = 7.35 × 10−60). (I) The normalized read density is quantified at all H3K27me3 sites and at H3K27me3 sites lost in gCUX1 cells. A Mann-Whitney test was used to determine significance. IR, irradiation RPKM, reads per kilobase mapped reads.
CUX1 loss impairs EHMT2 recruitment to DNA breaks and disrupts DNA damage–induced histone methylation changes. (A) Model of GSD-FRET. Target proteins are identified with antibodies tagged with either a donor (D) or acceptor (A) fluorophore. An image is taken using the donor excitation maxima. If the donor fluorophore is not near an acceptor fluorophore, the donor will emit all energy at the donor emission wavelength (left panel, top). If the donor is colocalizing with the acceptor fluorophore, some of the donor emission energy will be transferred to the acceptor, in proportion to the proximity to the acceptor (right panel, top). The samples are then bleached at the acceptor wavelength, and the bleached acceptors are no longer able to absorb energy. The samples are then reimaged at the donor excitation wavelength. Any increase in donor brightness in the second image compared with the first image is proportional to the energy that was previously transferred to the acceptor, or FRET (bottom right). If the molecules were not colocalizing, there will be no change in donor emission intensity, and no FRET (bottom left). (B) GSD-FRET analysis of colocalization between anti-γH2AX (donor) and anti-CUX1 (acceptor) in K562 cells. Scale bar, 1 μm. Bottom row images are following depletion of the acceptor fluorophore. Scale bar, 0.25 μm. Inset, representative FRET. Scale bar, 0.25 μm. Images shown are representative of results from 3 independent experiments. (C) Representative immunoblot for CUX1 protein in gHPRT and gCUX1 K562 cells (n = 3). (D) Principal component analysis of the histone posttranslational matrix (PTM) generated with EpiProfile analysis of histone PTMs in irradiated and mock-irradiated gHPRT and gCUX1 K562 cells. Histones were extracted 1 hour following irradiation (6 Gy). Results shown are derived from analysis of 3 independent samples. (E) Immunofluorescence imaging for EHMT2 and γH2AX colocalization 1 hour after irradiation (6 Gy). Colocalization was quantified in gHPRT and gCUX1 K562 cells after irradiation with or without the addition of an EHMT2 inhibitor, UNC0642, 60 minutes prior to irradiation. The fraction of colocalized pixels was calculated per nucleus. Results shown are a composite of 4 independent experiments. Significance was determined with a Student t test between indicated samples. (F) EpiProfile analysis of H3K27 methylation in irradiated and mock-irradiated gHPRT and gCUX1 K562 cells. Histones were extracted 1 hour following irradiation (6 Gy). Significance was determined with a Student t test between indicated samples. Results shown are derived from analysis of 3 independent samples. (G) ChIP-seq of H3K27me3 in K562 cells. Volcano plot showing differentially occupied ChIP-seq sites (n = 2) between clonal gHPRT and gCUX1 K562 cell lines. Each point is the average of 2 replicates. DiffBind was used to identify significantly differentially occupied sites. Red points indicate significance ≤10% FDR. (H) The panels depict a smooth line fit to the average column-wise read density for all differentially bound sites across the 20-kb window. Top panel, all H3K27me3 sites; bottom, only H3K27me3 sites significantly decreased in gCUX1 cells (10% FDR) (binomial P value = 7.35 × 10−60). (I) The normalized read density is quantified at all H3K27me3 sites and at H3K27me3 sites lost in gCUX1 cells. A Mann-Whitney test was used to determine significance. IR, irradiation RPKM, reads per kilobase mapped reads.
We next assessed the transcriptional role for CUX1 in the DDR. It has been reported that CUX1 transcriptionally upregulates expression of DDR genes, including ATM and ATR, in MCF7 cells and mouse embryonic fibroblasts.34 However, we did not observe decreased ATM or ATR transcripts in RNA-sequencing (RNA-seq) data from either K562 cells or human CD34+ HSPCs after knockdown of CUX120,35 (supplemental Figure 1B). We then explored other known functions of CUX1 that could impact the local DDR. CUX1 has been reported to regulate CDKN1A transcription via the recruitment of the histone methyltransferase EHMT2 (G9a).36 In addition to regulating transcription,36-38 EHMT2 promotes DSB repair by stabilizing activated ATM, necessary for downstream repair factor recruitment.39,40 We therefore hypothesized that CUX1 regulates DNA repair at the epigenetic level via EHMT2. To initially test this model, we used clustered regularly interspaced short palindromic repeats (CRISPR)/CRISPR-associated protein 9 (Cas9) to target CUX1 (gCUX1) or HPRT (gHPRT) as a control in K562 cells (Figure 1C). We assayed global histone posttranslational modifications 1 hour following irradiation in these cells using mass spectrometry.41 Known histone modifications induced by irradiation, including dimethylation of H3K36 (fold-change 1.8; q = 0.13)42 and acetylation of H3K18 (fold-change = 4.1; q = 0.001),43 were appropriately increased in gHPRT cells following irradiation (supplemental Table 1), indicating that we detected relevant irradiation-induced modifications. Principal component analysis of the histone posttranslational modification matrix showed that although irradiation induced changes in histone modifications in gHPRT cells (principal component 1, 31.8% of variance), these changes did not occur in gCUX1 cells, and irradiated and unirradiated gCUX1 samples clustered together, separately from gHPRT cells (principal component 2, 16.8% of variance) (Figure 1D). These results indicate that: (1) CUX1-deficient cells have aberrant epigenetic marks at the basal state and (2) CUX1 is necessary for DNA damage–induced histone alterations following irradiation.
To test whether CUX1 recruits EHMT2 to sites of DNA damage, we imaged irradiated gHPRT and gCUX1 cells. Although EHMT2 colocalized with γH2AX in gHPRT control cells (as previously reported44 ), this colocalization was significantly reduced in gCUX1 cells (Figure 1E). As an additional control, we treated cells with the EHMT2 inhibitor, UNC0642.45 The addition of UNC0642 to gHPRT cells reduced EHMT2-γH2AX colocalization to the extent seen in gCUX1 cells. The inhibitor did not, however, further decrease EHMT2-γH2AX colocalization in gCUX1 cells, suggesting that CUX1 acts upstream of EHMT2 recruitment (Figure 1E). We confirmed the role of CUX1 in EHMT2 localization to DSBs by GSD-FRET. In agreement with the immunofluorescence data, we found significantly decreased EHMT2-γH2AX interaction in gCUX1 cells, without changes in EHMT2 protein levels (supplemental Figure 1C-D). Overall, we find that CUX1 is required for the recruitment of EHMT2 to sites of DNA damage.
Best recognized for dimethylating H3K9, EHMT2 can also catalyze the mono- and dimethylation of H3K27.46-48 EHMT2 also promotes H3K27 trimethylation through direct interaction with EZH2, a member of the polycomb repressive complex 2 (PRC2).49 H3K27 and H3K9 methylation both play important roles in the early DDR.40,44,50 To determine whether impaired EHMT2 recruitment in CUX1-deficient cells attenuates damage-induced histone methylation, we examined our proteomics data. H3K9me2 was among the 10 most upregulated marks following irradiation in gHPRT cells (fold-change, 9.23). H3K9me2 and H3K9me3 were decreased postirradiation in gCUX1 chromatin, although this did not achieve statistical significance (P = .11; P = .13; supplemental Figure 1E). H3K9me1 was increased after irradiation in both gHPRT and gCUX1 cells, with significantly more H3K9me1 in gCUX1 cells (supplemental Figure 1E). As methylation of H3K9 to form H3K9me2/3 is upregulated in DDR,51 increased H3K9me1 could be due to a failure to convert H3K9me1 to H3K9me2/3 after irradiation in gCUX1 cells. On the other hand, H3K27me2 and H3K27me3 levels were significantly lower in gCUX1 cells compared with gHPRT cells, whereas H3K27me1 was upregulated appropriately after irradiation. Although the H3K27me2 phenotype was largely damage-dependent, H3K27me3 was significantly decreased both in irradiated and unirradiated gCUX1 cells (Figure 1F). In summary, global DNA damage–induced H3K9 and H3K27 methylation is disrupted by CUX1 loss, with more significant perturbation of H3K27 di- and trimethylation.
Given that H3K27me3 was decreased in both untreated and irradiated gCUX1 cells, we next determined the basal level of H3K27me3 by chromatin immunoprecipitation (ChIP) sequencing (ChIP-seq). Differential analysis revealed 848 loci with significantly decreased H3K27me3 in gCUX1 K562 cells compared with just 130 sites that gained H3K27me3 (10% false discovery rate [FDR]). H3K27me3 occupancy was also significantly decreased across all peaks (Figure 1G-I; supplemental Table 2). This global decrease in H3K27me3 in unirradiated gCUX1 cells corroborates our proteomics data and suggests that CUX1 loss impairs H3K27 methylation. The expression of H3K27 methyltransferases or demethylases was not altered by CUX1 knockdown in CD34+ HSPCs or K562 cells (supplemental Figure 2A-B).20,35,52 This finding implicates a nontranscriptional role for CUX1 in steady-state and DNA damage–induced H3K27me2/3 deposition.
CUX1 is necessary for DNA repair and focus formation
We next investigated whether the global decreases in H3K9 and H3K27 methylation seen after irradiation in CUX1-deficient cells were due to a loss of methylation specifically at sites of DNA damage. To investigate DSB-proximal histone methylation, we used immunofluorescence imaging to quantify methylation within γH2AX foci. Following irradiation, H3K9me1, H3K9me2, and H3K9me3 were significantly decreased at γH2AX foci in gCUX1 cells, although differences in total H3K9me1/2/3 were not detectable by western blot (supplemental Figure 2C-D). H3K27 monomethylation was increased, whereas H3K27 di- and trimethylation were significantly decreased at γH2AX foci after irradiation in gCUX1 K562 cells compared with gHPRT cells (Figure 2A). Inhibition of EHMT2 using UNC0642 in gHPRT cells recapitulated the loss of CUX1, with significantly decreased H3K27me2 and H3K27me3 within γH2AX foci (Figure 2A). Thus, CUX1 is necessary for H3K9me1/2/3 and H3K27me2/3 deposition at sites of DNA damage.
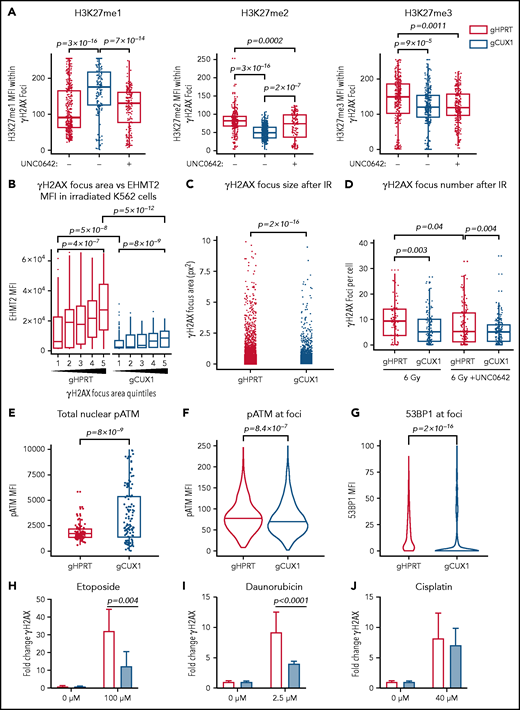
CUX1 is necessary for DNA repair and focus formation. K562 cells were irradiated (6 Gy) and imaged 1 hour postirradiation. (A) Cells were imaged for antibodies targeting γH2AX and H3K27 methylation. H3K27me1/2/3 mean fluorescent intensity (MFI) was quantified within each γH2AX foci. (B) γH2AX foci size was quantified and broken into quintiles by size, with Q1 containing the smallest foci, and Q5 the largest. The size of individual γH2AX foci was determined using a custom ImageJ macro. EHMT2 intensity was quantified by MFI within each γH2AX foci quintile. (C) γH2AX foci size in gHPRT and gCUX1 cells (D) Mean number of γH2AX foci per cell following irradiation with and without UNC0642. (E) The intensity of total pATM (MFI) per nucleus was quantified after irradiation. (F) The intensity of pATM within γH2AX foci. (G) The intensity of 53BP1 within γH2AX foci. The median is shown, and a Mann-Whitney test was performed. (H-J) γH2AX was measured by flow cytometry in gHPRT and gCUX1 cells after 6 hours of mock treatment, etoposide (H), daunorubicin (I), or cisplatin (J). A Mann-Whitney test was performed. All plots are compiled from data derived from 3 independent biological replicates.
CUX1 is necessary for DNA repair and focus formation. K562 cells were irradiated (6 Gy) and imaged 1 hour postirradiation. (A) Cells were imaged for antibodies targeting γH2AX and H3K27 methylation. H3K27me1/2/3 mean fluorescent intensity (MFI) was quantified within each γH2AX foci. (B) γH2AX foci size was quantified and broken into quintiles by size, with Q1 containing the smallest foci, and Q5 the largest. The size of individual γH2AX foci was determined using a custom ImageJ macro. EHMT2 intensity was quantified by MFI within each γH2AX foci quintile. (C) γH2AX foci size in gHPRT and gCUX1 cells (D) Mean number of γH2AX foci per cell following irradiation with and without UNC0642. (E) The intensity of total pATM (MFI) per nucleus was quantified after irradiation. (F) The intensity of pATM within γH2AX foci. (G) The intensity of 53BP1 within γH2AX foci. The median is shown, and a Mann-Whitney test was performed. (H-J) γH2AX was measured by flow cytometry in gHPRT and gCUX1 cells after 6 hours of mock treatment, etoposide (H), daunorubicin (I), or cisplatin (J). A Mann-Whitney test was performed. All plots are compiled from data derived from 3 independent biological replicates.
EHMT2 was reported to be required for sustained retention of activated, phosphorylated ATM (pATM) at DSBs for signal amplification and foci spreading.39 To determine whether CUX1 is required for EHMT2-mediated focus formation or spreading, we quantified the relationship between EHMT2 accumulation and γH2AX foci size 1 hour after irradiation. In gHPRT cells, EHMT2 accumulation correlates with increasing foci size, suggesting that EHMT2 recruitment is permissive for foci spreading (Figure 2B). This correlation was maintained in gCUX1 cells, with increasing foci size corresponding to increased EHMT2, albeit with markedly decreased overall recruitment of EHMT2 (Figure 2B). This led us to hypothesize that γH2AX foci would be smaller and less numerous in gCUX1 cells. Indeed, 1 hour after irradiation, loss of CUX1 led to significantly smaller γH2AX foci (Figure 2C), and decreased foci numbers (Figure 2D). Similarly, treating gHPRT cells with UNC0642 led to decreased foci numbers, reducing γH2AX foci to the level seen in gCUX1 cells. UNC0642 treatment did not further reduce foci counts in gCUX1 cells (Figure 2D). These data indicate that CUX1 is necessary early in the repair process, upstream of H2AX phosphorylation and propagation.
To determine whether decreased γH2AX foci size in gCUX1 cells was due to a failure to retain pATM at breaks, we performed immunofluorescence imaging for pATM after irradiation. ATM activation did occur in gCUX1 cells, with total nuclear pATM mean fluorescent intensity (MFI) elevated compared with gHPRT cells (Figure 2E). However, pATM was not retained at foci. pATM intensity within γH2AX foci was reduced in gCUX1 cells compared with gHPRT cells after irradiation (Figure 2F). As pATM retention at breaks is necessary for γH2AX foci spreading and downstream activation of DDR factors,53 we next examined repair factor recruitment. Both H3K27me2/350 and EHMT240 have been independently reported to be required for efficient recruitment of 53BP1. We therefore performed imaging for 53BP1 and found decreased 53BP1 intensity at γH2AX foci in irradiated gCUX1 cells (Figure 2G). We investigated whether these findings extended to chemotherapy-induced DNA damage using 3 classes of chemotherapies linked to t-MNs: etoposide, a topoisomerase II inhibitor; daunorubicin, an anthracycline; and cisplatin, a platinum-based cross-linking agent.1,54 We found significantly diminished γH2AX in gCUX1 cells compared with gHPRT cells following daunorubicin and etoposide treatments (Figure 2H-I). Following cisplatin treatment, γH2AX was slightly, but not significantly, decreased in gCUX1 cells compared with gHPRT (Figure 2J). In summary, CUX1-deficient cells fail to recruit EHMT2 to breaks and deposit H3K27me2/3, leading to decreased γH2AX focus formation and spreading, decreased local pATM, and decreased 53BP1 recruitment at sites of DNA damage.
CUX1-deficient HSPCs have an impaired DDR and unrepaired DNA damage in vivo
To determine whether the DNA repair defects in CUX1-deficient K562 cells in vitro are also present in primary CUX1-deficient hematopoietic cells in vivo, we used our Dox-inducible shRNA transgenic mouse models.20 Cux1mid and Cux1low lines express distinct shRNAs targeting Cux1 and have 58% and 42% residual Cux1 messenger RNA expression , respectively, in hematopoietic lineage-negative/Sca-1+/Kit+ cells (LSKs).20 Littermates expressing an shRNA targeting Ren were used as controls (Ren). We first assessed whether CUX1-deficient HSPCs exhibit reduced γH2AX focus formation. In agreement with our human cell line data, we found that CUX1-deficient HSPCs showed attenuated phosphorylation of H2AX following irradiation. This was true in both LSKs and lineage-negative cells (Figure 3A). After 6 hours, Ren γH2AX foci levels returned to baseline and were not significantly different from Cux1mid and Cux1low.
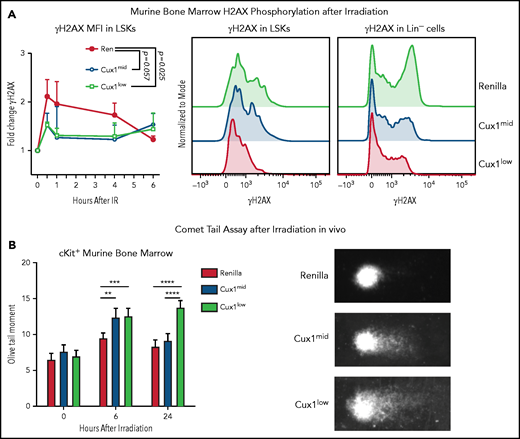
CUX1-deficient HSPCs have an impaired DNA damage response and unrepaired DNA damage in vivo. (A) Bone marrow (BM) was collected from Ren, Cux1mid, and Cux1low mice after treatment with Dox for 7 days. The cells were irradiated ex vivo (2 Gy) and γH2AX induction was measured by intracellular flow cytometry at 30 minutes, 1 hour, 4 hours, and 6 hours after irradiation. LSK cells were gated, and γH2AX MFI was normalized to the 0-hour timepoint from each experiment. Representative histograms of γH2AX staining 1 hour after irradiation in LSKs and total lineage-negative cells are shown. Plot is the result of 3 independent biological replicates. Data are shown as mean ± standard deviation (SD) with P values from a 2-way analysis of variance (ANOVA). (B) Ren, Cux1mid, and Cux1low mice were treated with Dox for 7 days and subsequently irradiated in vivo (6 Gy). Bone marrow was collected at 6 and 24 hours postirradiation, and Kit+ cells were isolated for a neutral comet assay. Representative images are shown (right). Mean ± standard error of the mean (SEM) is shown for 3 biological replicates. Mann-Whitney test, *P < .05; **P < .01; ***P < .001; ****P < .0001.
CUX1-deficient HSPCs have an impaired DNA damage response and unrepaired DNA damage in vivo. (A) Bone marrow (BM) was collected from Ren, Cux1mid, and Cux1low mice after treatment with Dox for 7 days. The cells were irradiated ex vivo (2 Gy) and γH2AX induction was measured by intracellular flow cytometry at 30 minutes, 1 hour, 4 hours, and 6 hours after irradiation. LSK cells were gated, and γH2AX MFI was normalized to the 0-hour timepoint from each experiment. Representative histograms of γH2AX staining 1 hour after irradiation in LSKs and total lineage-negative cells are shown. Plot is the result of 3 independent biological replicates. Data are shown as mean ± standard deviation (SD) with P values from a 2-way analysis of variance (ANOVA). (B) Ren, Cux1mid, and Cux1low mice were treated with Dox for 7 days and subsequently irradiated in vivo (6 Gy). Bone marrow was collected at 6 and 24 hours postirradiation, and Kit+ cells were isolated for a neutral comet assay. Representative images are shown (right). Mean ± standard error of the mean (SEM) is shown for 3 biological replicates. Mann-Whitney test, *P < .05; **P < .01; ***P < .001; ****P < .0001.
To assess whether CUX1 is required for break repair, in addition to break recognition, we performed neutral comet assays to measure DSBs in HSPCs.55 Following a single dose of whole-body irradiation, Cux1mid and Cux1low HSPCs show significantly elevated levels of DSBs 6 hours postirradiation (Figure 3B). The unrepaired breaks persisted 24 hours after irradiation in Cux1low HSPCs (Figure 3B). Thus, CUX1 deficiency leads to unrepaired DNA damage in HSPCs in vivo following irradiation. We find that, in both a human hematopoietic cell line and primary mouse HSPCs, CUX1 is required for recognition and resolution of DNA damage.
CUX1-deficient cells upregulate genes involved in proliferation and DNA repair
To further assess a potential transcriptional mechanism for disrupted γH2AX focus formation, we performed RNA-seq of Ren and Cux1low HSCs (Lin−/Kit+/Sca1+/CD135−) after 5 days of Dox (supplemental Table 3). By RNA-seq, Cux1 transcripts were ∼50% decreased in Cux1low HSCs (Figure 4A). We identified 3323 differentially expressed genes (FDR, <5%): 1827 genes were upregulated after CUX1 knockdown and 1496 genes were downregulated (Figure 4B-C). As in human CD34+ HSPCs and K562 cells, CUX1 knockdown did not lead to decreased gene expression of H3K27 methyltransferases or increased transcription of demethylases (supplemental Figure 3A). Gene-set enrichment analysis56 showed that Cux1 knockdown drives proliferative signatures, including genes activated by E2F and MYC and genes involved in G2/M checkpoint progression (Figure 4D). We did not find genes regulating the DDR decreased (fold-change less than −0.5) after Cux1 knockdown and, in fact, we found an upregulation of “DNA Repair” and “UV Response Up” gene sets, possibly reflecting a compensatory mechanism for unresolved damage. In agreement with CD34+ HSPCs and K562 data, transcription of Atm and Atr were unchanged (supplemental Figure 3B). RNA-seq data from shCUX1 K562 cells also showed upregulation of proliferation and DNA repair pathways (Figure 4E).35 The results from RNA-seq of Ren and Cux1low HSPCs, demonstrating enrichment of proliferative signatures at baseline, are consistent with the previously reported RNA-seq in human CD34+ HSPCs, and the hypercellular bone marrow and decreased quiescence detected in Cux1low mice at baseline.20 Thus, CUX1 knockdown in primary murine HSCs leads to upregulation of proliferation and DDR pathways.
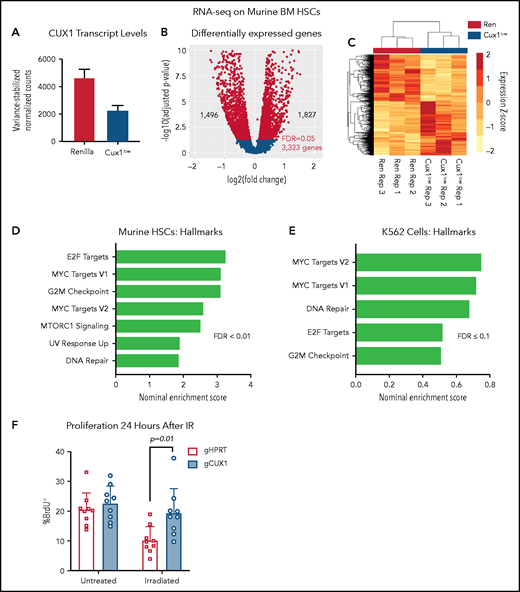
UX1-deficient cells upregulate expression of genes involved in proliferation and DNA repair. (A) Ren and Cux1low mice were treated with Dox for 5 days, and HSCs (lineage-negative/cKit+/Sca1+/CD135−) were sorted for RNA-seq, for a total of 3 biological replicates. Cux1 transcript levels (excluding Casp isoforms) by RNA-seq are shown. (B) Volcano plot showing gene-expression changes in HSCs by RNA-seq after CUX1 knockdown. Blue color indicates differentially expressed genes with an FDR <5%. (C) A heatmap clustering the samples by the 3323 differentially expressed genes. The z score is indicated by the box color (scale on right). (D-E) Gene-set enrichment analysis (GSEA) using the “Hallmarks” gene set from the MSig Database56 of murine HSCs (D) and shRen and shCUX1 K562 cells (E)(previously published RNA-seq).35 Hallmark gene sets involved in proliferation and DNA damage repair with an FDR ≤0.1 are shown. Nominal enrichment score (NES) is plotted. (F) Twenty-four hours after irradiation (6 Gy) or mock irradiation, proliferation was assessed in gHPRT and gCUX1 K562 cells via BrdU incorporation 1 hour before analysis. Mean ± SD is shown for 3 biological replicates. Significance was determined with a Student t test between indicated samples.
UX1-deficient cells upregulate expression of genes involved in proliferation and DNA repair. (A) Ren and Cux1low mice were treated with Dox for 5 days, and HSCs (lineage-negative/cKit+/Sca1+/CD135−) were sorted for RNA-seq, for a total of 3 biological replicates. Cux1 transcript levels (excluding Casp isoforms) by RNA-seq are shown. (B) Volcano plot showing gene-expression changes in HSCs by RNA-seq after CUX1 knockdown. Blue color indicates differentially expressed genes with an FDR <5%. (C) A heatmap clustering the samples by the 3323 differentially expressed genes. The z score is indicated by the box color (scale on right). (D-E) Gene-set enrichment analysis (GSEA) using the “Hallmarks” gene set from the MSig Database56 of murine HSCs (D) and shRen and shCUX1 K562 cells (E)(previously published RNA-seq).35 Hallmark gene sets involved in proliferation and DNA damage repair with an FDR ≤0.1 are shown. Nominal enrichment score (NES) is plotted. (F) Twenty-four hours after irradiation (6 Gy) or mock irradiation, proliferation was assessed in gHPRT and gCUX1 K562 cells via BrdU incorporation 1 hour before analysis. Mean ± SD is shown for 3 biological replicates. Significance was determined with a Student t test between indicated samples.
Based on the impaired DDR in both CUX1-deficient K562 cells (Figure 2C-D) and murine HSPCs (Figure 3A), we predicted that CUX1-deficient cells proliferate despite unrepaired damage. To test this, we irradiated gHPRT and gCUX1 K562 cells and measured 5-bromo-2′-deoxyuridine (BrdU) incorporation 24 hours later. gHPRT cells exhibited reduced proliferation following irradiation-induced DNA damage, whereas gCUX1 cells did not (Figure 4F). There was not a significant difference in apoptosis between irradiated gHPRT and gCUX1 cells (supplemental Figure 3C). In summary, we find that CUX1-deficient cells continue to proliferate in the presence of DNA damage.
Cux1low cells proliferate and expand following DNA-damaging alkylating agents
In patients, certain mutations provide HSPCs a fitness advantage in the context of chemotherapy, enabling those clones to expand.11,57 We hypothesized that CUX1 deficiency would similarly provide a selective advantage under the pressure of chemotherapy. As alkylating agents are the most common chemotherapy exposure preceding t-MNs,4 we used ENU, an alkylating agent well-characterized in mouse models to recapitulate chemotherapy in vivo.58-61 We performed mixed bone marrow chimera experiments, with Ren, Cux1mid, or Cux1low donor bone marrow (CD45.2+) and wild-type competitor bone marrow (CD45.1+) (Figure 5A). Upon addition of ENU, Cux1low cells exhibited a significantly increased contribution to the peripheral blood compared with either untreated Cux1low or ENU-treated Ren cells (Figure 5B). At autopsy, ENU-treated Cux1low cells constituted a significantly higher percentage of the LSKs and myeloid progenitors in the bone marrow and spleen (Figure 5C-D). Unlike Cux1low, Cux1mid cells did not expand after ENU in these experiments, which is consistent with the generally milder phenotypes observed in Cux1mid mice that increase with age.20 In summary, Cux1low HSPCs have a competitive advantage following ENU.
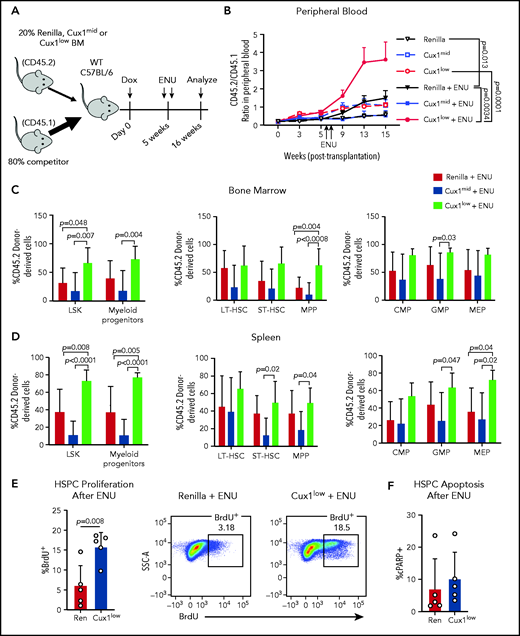
Cux1low cells aberrantly proliferate and expand following DNA-damaging alkylating agents. (A) Bone marrow from Ren, Cux1mid, and Cux1low mice was transplanted at a 1:4 ratio with competitor bone marrow, and recipients were treated continuously with Dox beginning the day of transplant. Two doses of ENU (100 mg/kg) were administered 9 days apart, starting 5 weeks after transplant. (B) The contributions of Ren (n = 9), Cux1mid (n = 8), and Cux1low (n = 9) cells to the peripheral blood were monitored by flow cytometry. The ratio of Ren, Cux1mid, or Cux1low cells (CD45.2) to competitor cells (CD45.1) is shown. The mean ± SEM is shown. A mixed-effects analysis with the Geisser-Greenhouse correction is shown. Two independent biological replicates were performed (n = 4-5 mice per replicate per genotype). (C-D) At 16 weeks, the mice were euthanized and the contributions of Ren, Cux1mid, and Cux1low (CD45.2) to the hematopoietic stem and progenitor populations were measured by flow cytometry in the bone marrow (C) and spleen (D). LSK cells and myeloid progenitors (Lin−/Sca1−/c-Kit+) are shown (left). LSK cells were further gated for long-term HSCs (LT-HSC; CD150+/CD48−), short-term HSCs (ST-HSC; CD48−/CD150−), and multipotent progenitors (MPP; CD48+/CD150−) (center). Within the progenitor population, cells were separated into common myeloid progenitors (CMP; CD34+/CD16/32low), granulocyte-monocyte progenitor (GMP; CD34+/CD16/32high), and megakaryocyte-erythroid progenitors (MEP; CD34−/CD16/32−) (right). The mean ± SD and P values from a 1-way ANOVA comparison are shown. Two independent biological replicates were performed. (E) Proliferation was measured in Ren and Cux1low mice after ENU administration. Mice were given 2 doses of ENU, 9 days apart. Six hours after the second dose of ENU, BrdU was administered. BrdU+ cells were measured by flow cytometry 12 hours after BrdU injection in the bone marrow HPSC population (Lin−). Representative flow plots are shown. The mean ± SD and Student t test P value is shown. (F) Apoptosis was measured in the same cells by flow cytometry using antibodies for cleaved poly (ADP-ribose) polymerase (cPARP). Three independent biological replicates were performed. SSC-A, side scatter area; WT, wild type.
Cux1low cells aberrantly proliferate and expand following DNA-damaging alkylating agents. (A) Bone marrow from Ren, Cux1mid, and Cux1low mice was transplanted at a 1:4 ratio with competitor bone marrow, and recipients were treated continuously with Dox beginning the day of transplant. Two doses of ENU (100 mg/kg) were administered 9 days apart, starting 5 weeks after transplant. (B) The contributions of Ren (n = 9), Cux1mid (n = 8), and Cux1low (n = 9) cells to the peripheral blood were monitored by flow cytometry. The ratio of Ren, Cux1mid, or Cux1low cells (CD45.2) to competitor cells (CD45.1) is shown. The mean ± SEM is shown. A mixed-effects analysis with the Geisser-Greenhouse correction is shown. Two independent biological replicates were performed (n = 4-5 mice per replicate per genotype). (C-D) At 16 weeks, the mice were euthanized and the contributions of Ren, Cux1mid, and Cux1low (CD45.2) to the hematopoietic stem and progenitor populations were measured by flow cytometry in the bone marrow (C) and spleen (D). LSK cells and myeloid progenitors (Lin−/Sca1−/c-Kit+) are shown (left). LSK cells were further gated for long-term HSCs (LT-HSC; CD150+/CD48−), short-term HSCs (ST-HSC; CD48−/CD150−), and multipotent progenitors (MPP; CD48+/CD150−) (center). Within the progenitor population, cells were separated into common myeloid progenitors (CMP; CD34+/CD16/32low), granulocyte-monocyte progenitor (GMP; CD34+/CD16/32high), and megakaryocyte-erythroid progenitors (MEP; CD34−/CD16/32−) (right). The mean ± SD and P values from a 1-way ANOVA comparison are shown. Two independent biological replicates were performed. (E) Proliferation was measured in Ren and Cux1low mice after ENU administration. Mice were given 2 doses of ENU, 9 days apart. Six hours after the second dose of ENU, BrdU was administered. BrdU+ cells were measured by flow cytometry 12 hours after BrdU injection in the bone marrow HPSC population (Lin−). Representative flow plots are shown. The mean ± SD and Student t test P value is shown. (F) Apoptosis was measured in the same cells by flow cytometry using antibodies for cleaved poly (ADP-ribose) polymerase (cPARP). Three independent biological replicates were performed. SSC-A, side scatter area; WT, wild type.
We tested whether the blunted DDR in Cux1low cells (Figure 3A) leads to a failure to halt proliferation post-DNA damage, as seen in gCUX1 K562 cells (Figure 4F). Cux1low HSPCs showed increased BrdU incorporation in the 24 hours following ENU compared with controls, whereas untreated cells did not show a significant difference (Figure 5E; supplemental Figure 3D). There was no change in apoptosis (Figure 5F). Thus, we conclude that CUX1 deficiency drives a fitness advantage under the selective pressure of chemotherapy, characterized by persistent proliferation following DNA-damaging agents.
CUX1-deficient mice develop t-MNs after alkylator chemotherapy exposure
Recent studies suggest that, in many patients, preexisting mutant HSPCs expand and transform to t-MNs after chemotherapy.6,57,62 Therapy-induced CHIP is enriched for DDR genes.11,57 Thus, we investigated the link between defective DDR in CUX1-deficient cells and t-MN susceptibility. We treated Ren, Cux1mid, and Cux1low mice with Dox for 1 month, followed by chemotherapy (ENU, 100 mg/kg) (Figure 6A). A small number (n = 2 of 12; 17%) of the ENU-treated control mice developed lymphoid disease, consistent with a prior report,59 but the majority of Ren mice had a normal lifespan. In the absence of chemotherapy, Cux1mid mice spontaneously develop MDS but do not have decreased survival.20 In contrast, ENU-exposed Cux1mid mice have a significantly shortened lifespan (median survival, 160 days). Untreated Cux1low mice succumb to MDS/MPNs (275 days).20 Upon exposure to ENU, Cux1low survival time is reduced by more than one-half (median survival, 124 days) (supplemental Figure 4A). We used the Bethesda criteria to identify myeloid disease after alkylator chemotherapy.63 None of the Ren mice treated with ENU developed a t-MN, consistent with prior work.59 In stark contrast, 38% (3 of 8; P = .049) of Cux1mid and 83% (10 of 12; P < .0001) of Cux1low mice developed myeloid disease, whereas the remaining presented with lymphoid disease (Figure 6B; supplemental Figure 4B). Of note, Cux1low mice had accelerated onset (P = .002) and increased penetrance (P = .035) of t-MNs compared with Cux1mid. These results demonstrate that CUX1 deficiency sensitizes mice to t-MNs in a dosage-dependent manner.
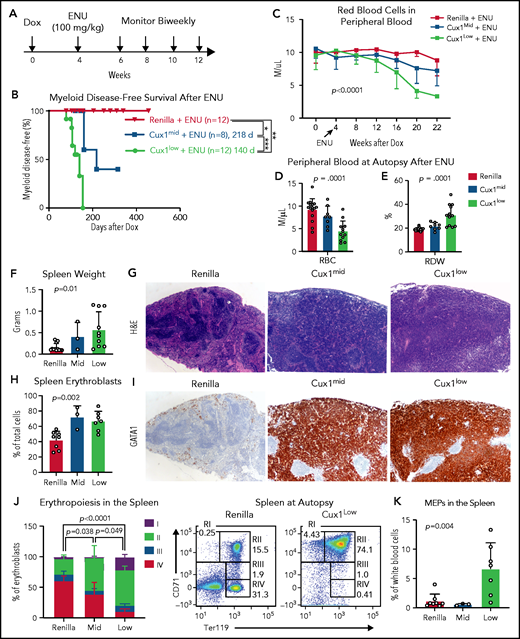
CUX1-deficient mice develop t-MNs after alkylator chemotherapy exposure. (A) Cux1mid, Cux1low, and littermate Ren mice were treated continuously with Dox to induce CUX1 knockdown. At 1 month, mice were treated with an alkylating agent, ENU (100 mg/kg). Peripheral blood was monitored on a biweekly basis. (B) Kaplan-Meier plot showing significantly increased myeloid disease incidence for Cux1mid (n = 8) and Cux1low (n = 12) mice treated with ENU compared with Ren mice treated with ENU (n = 12). Results are shown from 2 independent experiments (n = 4-6 mice per replicate). **P < .01, ***P < .001, log-rank test . Median survival is shown. (C) Complete blood count analysis showing decreased RBC counts following ENU treatment in Cux1mid and Cux1low mice compared with Ren. The mean plus or minus SD is shown. A mixed-effects analysis with the Geisser-Greenhouse correction was performed. (D-E) Red blood cell count (RBC) (D) and red cell distribution width (RDW) (E) from complete blood count analysis at autopsy. (F) The spleen weight at autopsy is shown for Ren, Cux1mid, and Cux1low mice. (G) Representative images from Ren, Cux1mid, and Cux1low spleens stained with hematoxylin and eosin (H&E) are shown; original magnification, ×40. (H) Erythroblasts (CD71+ or Ter119+) in the spleen quantified as a percentage of total cells. (I) Representative Ren, Cux1mid, and Cux1low spleens stained for an immature erythroid marker, anti-GATA1. Original magnification, ×40. The mean ± SD and 1-way ANOVA P values are shown. (J) RI-RIV erythroid precursor populations quantified as a percentage of erythroblasts in the spleen. The mean ± SD is shown, and P values were calculated using a 2-way ANOVA. Representative flow plots for the erythroblast markers CD71 and Ter119 are shown. (K) MEPs in the spleen, as a percentage of white blood cells. The mean ± SD and 1-way ANOVA P values are shown. Panels F-K represent mice that develop nonlymphoid disease after ENU for Cux1mid (n = 3) and Cux1low mice (n = 10). *P < .05; **P < .01; ***P < .001; ****P < .0001.
CUX1-deficient mice develop t-MNs after alkylator chemotherapy exposure. (A) Cux1mid, Cux1low, and littermate Ren mice were treated continuously with Dox to induce CUX1 knockdown. At 1 month, mice were treated with an alkylating agent, ENU (100 mg/kg). Peripheral blood was monitored on a biweekly basis. (B) Kaplan-Meier plot showing significantly increased myeloid disease incidence for Cux1mid (n = 8) and Cux1low (n = 12) mice treated with ENU compared with Ren mice treated with ENU (n = 12). Results are shown from 2 independent experiments (n = 4-6 mice per replicate). **P < .01, ***P < .001, log-rank test . Median survival is shown. (C) Complete blood count analysis showing decreased RBC counts following ENU treatment in Cux1mid and Cux1low mice compared with Ren. The mean plus or minus SD is shown. A mixed-effects analysis with the Geisser-Greenhouse correction was performed. (D-E) Red blood cell count (RBC) (D) and red cell distribution width (RDW) (E) from complete blood count analysis at autopsy. (F) The spleen weight at autopsy is shown for Ren, Cux1mid, and Cux1low mice. (G) Representative images from Ren, Cux1mid, and Cux1low spleens stained with hematoxylin and eosin (H&E) are shown; original magnification, ×40. (H) Erythroblasts (CD71+ or Ter119+) in the spleen quantified as a percentage of total cells. (I) Representative Ren, Cux1mid, and Cux1low spleens stained for an immature erythroid marker, anti-GATA1. Original magnification, ×40. The mean ± SD and 1-way ANOVA P values are shown. (J) RI-RIV erythroid precursor populations quantified as a percentage of erythroblasts in the spleen. The mean ± SD is shown, and P values were calculated using a 2-way ANOVA. Representative flow plots for the erythroblast markers CD71 and Ter119 are shown. (K) MEPs in the spleen, as a percentage of white blood cells. The mean ± SD and 1-way ANOVA P values are shown. Panels F-K represent mice that develop nonlymphoid disease after ENU for Cux1mid (n = 3) and Cux1low mice (n = 10). *P < .05; **P < .01; ***P < .001; ****P < .0001.
At the time of euthanasia for disease, most Cux1mid and Cux1low mice did not show changes in total peripheral blood white blood cell counts. However, myeloid skewing was evident by increased frequency of peripheral blood granulocytes and platelets in Cux1low mice, with similar trends in Cux1mid (supplemental Figure 4C-D). B cells (B220+) were significantly decreased, and T cells (CD3e−) were largely unchanged (supplemental Figure 4D). In Cux1low mice, myeloid cells were expanded in the spleen and bone marrow, with Cux1mid mice trending in the same direction (supplemental Figure 4E-F). Thus, post-ENU, Cux1mid, and Cux1low mice display myeloid hyperplasia.
In distinction to the MDS and MDS/MPN observed in CUX1-deficient mice,20 ENU-treated CUX1-deficient mice develop acute erythroleukemia. Following ENU, RBC counts declined in Cux1mid and Cux1low mice (Figure 6C-D). This anemia was accompanied by an elevated RBC distribution width (RDW) (Figure 6E). Both Cux1mid and Cux1low mice display splenomegaly with a total effacement of splenic architecture (Figure 6F-G). The splenomegaly in Cux1mid and Cux1low mice was primarily driven by a marked expansion of erythroid precursors in the spleen, illustrated by intense and pervasive GATA1 immunohistochemical staining (Figure 6H-I). Normally, GATA1 predominates in scattered early erythroid forms, as seen in Ren spleens (Figure 6I). In erythroleukemia, GATA1 staining is uniformly intense, whereas other AML subtypes remain negative.64 CUX1 knockdown led to decreased mature erythroblasts (RIV, orthochromatophilic, CD71−/Ter119+) in the spleen and bone marrow. The expanded erythroblast population in the spleen was mainly composed of immature RI (proerythroblasts, CD71+/Ter119mid) and RII (basophilic, CD71+/Ter119+) populations. The RI population was also increased in the bone marrow (Figure 6J; supplemental Figure 4G). We observed infiltration of these immature erythroid populations in nonhematopoietic tissues, including the liver, with varying penetrance (supplemental Figure 5A-B). Cux1low mice, but not Cux1mid mice, had significant expansion of megakaryocyte-erythroid progenitors (MEPs; Lin−/CD34−/FcγRlow/Kit+/Sca-1−) in the spleen (Figure 6K). The anemia, dramatic expansion of immature erythroid precursors, infiltration into the liver, and rapid onset of disease led us to characterize the disease in both Cux1mid and Cux1low mice as a therapy-related erythroleukemia.63 Of note, erythroleukemia in patients is often associated with prior chemotherapy as well as −7/del(7q).65,66 In summary, we find CUX1 deficiency predisposes mice to an aggressive t-MN, specifically an erythroleukemia.
Restoration of CUX1 prevents the development of a t-MN
The evidence that CUX1 regulates the DDR led us to investigate whether CUX1 loss leads to additional mutations that drive transformation. We found that, in primary patient samples, CUX1 mutations were associated with a higher mutational burden in myeloid neoplasms (Figure 7A). We next asked whether these mutations were driving transformation, or whether CUX1 had additional tumor-suppressive roles. If the former, we reasoned that CUX1 deficiency at the time of DNA damage should be sufficient to acquire mutations and transform. To test this, we administered ENU to Dox-treated Ren and Cux1low mice, then restored Cux1 expression 30 days later via Dox withdrawal. Restoring Cux1 prevented myeloid transformation, rescued erythroid differentiation, and prevented splenomegaly and anemia (Figure 7B-F). Thus, although the impaired DDR allows for proliferation despite damage (Figures 4F and 5E), sustained CUX1 knockdown is required for the development of a t-MN. This is consistent with the known roles for CUX1 in hematopoietic differentiation and proliferation.20,21
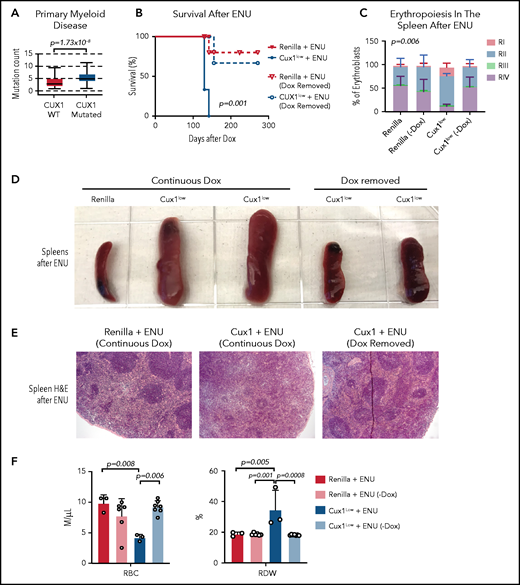
Sustained CUX1 loss is required for the development of t-MNs. Restoration of CUX1 prevents t-MNs. (A) Mutational burden in primary samples from patients with CUX1-wild type (n = 1731) and CUX1 mutations or deep deletions (n = 35). Samples are from patients with myeloid neoplasms, including AML, MDS, MPN, and MDS/MPN. AACR GENIE Cohort v9.088 (B) Ren and Cux1low mice were treated with Dox and ENU as in Figure 6. One month after ENU, Dox was removed and CUX1 expression restored in a cohort of Ren (n = 6) and Cux1low (n = 7) mice (dashed lines). A cohort of Ren (n = 3) and Cux1low (n = 3) mice continued to receive Dox (solid lines). Ren mice were euthanized when Cux1low mice showed signs of disease. (C) RI-RIV erythroid precursor populations quantified as a percentage of erythroblasts in the spleen. The mean ± SD is shown, and P values were calculated using a 2-way ANOVA. (D) Representative images of spleens at autopsy from Ren and Cux1low mice at autopsy. (E) Representative images from Ren and Cux1low spleens stained with H&E are shown; original magnification, ×40. (F) RBC count and RDW from complete blood count analysis at autopsy. The mean ± SD and 1-way ANOVA comparison P values are shown.
Sustained CUX1 loss is required for the development of t-MNs. Restoration of CUX1 prevents t-MNs. (A) Mutational burden in primary samples from patients with CUX1-wild type (n = 1731) and CUX1 mutations or deep deletions (n = 35). Samples are from patients with myeloid neoplasms, including AML, MDS, MPN, and MDS/MPN. AACR GENIE Cohort v9.088 (B) Ren and Cux1low mice were treated with Dox and ENU as in Figure 6. One month after ENU, Dox was removed and CUX1 expression restored in a cohort of Ren (n = 6) and Cux1low (n = 7) mice (dashed lines). A cohort of Ren (n = 3) and Cux1low (n = 3) mice continued to receive Dox (solid lines). Ren mice were euthanized when Cux1low mice showed signs of disease. (C) RI-RIV erythroid precursor populations quantified as a percentage of erythroblasts in the spleen. The mean ± SD is shown, and P values were calculated using a 2-way ANOVA. (D) Representative images of spleens at autopsy from Ren and Cux1low mice at autopsy. (E) Representative images from Ren and Cux1low spleens stained with H&E are shown; original magnification, ×40. (F) RBC count and RDW from complete blood count analysis at autopsy. The mean ± SD and 1-way ANOVA comparison P values are shown.
Discussion
t-MN remains an inherently treatment-resistant cancer. Although identifying novel drug targets is of paramount importance, equal, if not greater, emphasis should be placed on prevention. The field is now equipped with emerging biomarkers, including germline risk alleles and somatic CHIP mutations. Determining how these genetic changes interact with environmental exposures is the missing link in understanding and preventing the evolution of t-MNs. Here, we show that preexisting CUX1-deficient HSPCs cells fail to recognize and repair DNA damage, expand, and transform to a t-MN. Based on this, we speculate that CUX1 mutations and −7/del(7q) are biomarkers for t-MN risk.
EHMT2 plays a key role in the DDR through methylation of histones and MDC1 to promote pATM stabilization and downstream repair factor recruitment.39,40,67 Nevertheless, the factor responsible for recruiting EHMT2 to DSBs was unknown.39,49 Here, we report a novel function for CUX1 in this role. CUX1 deficiency phenocopies loss of EHMT2 in several regards, including decreased pATM stabilization at foci without impaired ATM activation.39 In agreement with the reports of roles for EHMT2 and H3K27me3 in nonhomologous end joining,40,50 we observe that CUX1 loss impairs histone methylation and 53BP1 recruitment. Intriguingly, it has been reported that reduced H3K27me2/3 at sites of DNA damage leads to reduced 53BP1 binding and nonhomologous end joining, but increased binding of FANCD2.50 These findings position CUX1 as an early player in the DDR, possibly involved in repair pathway choice.
Another possibility is that CUX1 and EZH2 mutations cooperate to drive t-MN. Of 7q genes, only CUX1, EZH2, and LUC7L2 mutations are associated with shorter survival, and, interestingly, these mutations are not mutually exclusive.68 Unlike Cux1, Ezh2 loss alone does not lead to myeloid neoplasms in mice.69 These mutations may synergize, similar to the effect of −7 or long deletions of 7q.
A common theme manifesting in t-MNs is the importance of intact DNA repair machinery. Twenty-one percent of t-MN patients harbor inherited mutations in DDR genes.70 CHIP mutations in DDR genes are particularly associated with t-MN.11,57,70-73 TP53 is a well-described example of this paradigm, in the contexts of both inherited and CHIP mutations.61,74 However, TP53 inactivation accounts for <30% of t-MN patients.70,75 Furthermore, defective DDR may not be sufficient to cause t-MNs. For instance, Tp53+/− mice do not have increased incidence of alkylator-induced myeloid disease.76-78 Mutations acquired through ineffective DNA repair also do not seem to be a driving force in tumorigenesis, as tumor-suppressor genes with known roles in DNA damage, such as TP53, are not associated with a higher mutational burden.79 This is supported by our data showing that, although CUX1 mutations are associated with a higher mutational burden, sustained CUX1 deficiency is still required for transformation to a t-MN. Although this increased mutational burden is consistent with a prior report on a small number of patients,26 future studies substantiating this increased mutational burden in larger, more uniform populations of patients are warranted. By nature of its role in multiple facets of tumorigenesis, that is, differentiation, proliferation, and DNA repair, CUX1 may be a particularly potent tumor suppressor and driver of t-MNs. This is supported by the protective effect of restoring CUX1 in t-MN development, presenting a possible therapeutic avenue.
It is noteworthy that the HSC DDR declines with age,80-83 as do CUX1 levels.84,85 The combination may be particularly oncogenic; that is, with age, CUX1 levels drop past a critical threshold that is eventually permissive for clonal expansion and transformation. This may explain the reduced clonal expansion by Cux1mid HSPCs following therapy (Figure 5). The Cux1mid mice model, a milder knockdown of CUX1 and, indeed, myeloid transformation, is only seen after aging20 or therapy (Figure 6). This may partly explain why −7/del(7q) myeloid malignancies increase with age.1,4,86 By identifying a critical gene associated with clonal selection and transformation, our work paves the way for identifying patients at risk for t-MNs.
Acknowledgments
The authors thank Michelle Le Beau, Angela Stoddart, Madhavi Senagolage, and Stephen Arnovitz for critical reading of the manuscript. The authors are grateful for the services and assistance provided by the following University of Chicago core facilities supported by the Cancer Center Support Grant (P30 CA014599): Christine Labno and The University of Chicago’s Integrated Light Microscopy Core Facility, Pieter Faber and the High Throughput Genomics Core Facility (RRID: SCR_019196), David Leclerc in the Flow Cytometry Facility (RRID: SCR_017760), and the Human Tissue Resource Center (RRID:SCR_019199). The authors also thank Chuanhong Liao in the Biostatistics Laboratory for special assistance and services, as well as The University of Chicago Center for Research Informatics and Animal Resources Center. The authors thank Michelle Le Beau and Le Beau laboratory members for sharing advice, reagents, and resources. The authors acknowledge the American Association for Cancer Research (AACR) and its financial and material support in the development of the AACR Project Genomics Evidence Neoplasia Information Exchange (GENIE) registry, as well as members of the consortium for their commitment to data sharing.
This work was supported, in part, by the American Cancer Society Research Scholar Grant (M.E.M.), the American Society of Hematology Junior Faculty Scholar Award (M.E.M.), the National Institutes of Health (National Heart, Lung, and Blood Institute grant HL142782 and National Cancer Institute grant CA231880 [M.E.M.]; National Cancer Institute grant R21CA213247 [S.J.K.]), the Brinson Foundation (M.E.M.), and Robin and Matthew Patinkin and The University of Chicago Cancer Research Foundation Women’s Board (M.E.M.). M.K.I. was supported by National Institutes of Health, National Cancer Institute grant F30CA232673 and The University of Chicago Medical Scientist Training Program (National Institute of General Medical Sciences grant T32GM007281). J.L. was supported by Multidisciplinary Training Program in Cancer Research (MTCR) grant T32 CA009594 from the National Institutes of Health, National Cancer Institute. Interpretations are the responsibility of the study authors. The visual abstract was created with BioRender.com.
Authorship
Contribution: M.K.I. designed and performed experiments, interpreted data, and wrote the manuscript; J.L. performed experiments and edited the manuscript; N.A. performed experiments and provided conceptual and technical advice; B.H. performed experiments; S.K. performed western blots and CHIP-seq; J.K. performed the CHIP-seq analysis; T.C.M. performed western blots; D.W. prepared the proteomics samples and did initial PTM analysis using EpiProfile; S.K.G. performed hematopathologic analyses and edited the manuscript; S.J.K. interpreted data and edited the manuscript; and M.E.M. conceived the experiments, interpreted data, and edited the manuscript.
Conflict-of-interest disclosure: S.J.K. received a research grant from AbbVie, receives royalties from Millipore, and has ownership of Cell IDx, OncoSenescence, Transnostics, and BioFluid Technologies. The remaining authors declare no competing financial interests.
Correspondence: Megan E. McNerney, Department of Pathology, University of Chicago, 5128 Knapp Center for Biomedical Discovery, 900 East 57th St, Chicago, IL 60637; e-mail: megan.mcnerney@uchospitals.edu.
The data reported in this article have been deposited in the Gene Expression Omnibus87 database (accession number GSE154674).
The authors will respond to requests for data e-mailed to the corresponding author.
The online version of this article contains a data supplement.
There is a Blood Commentary on this article in this issue.
The publication costs of this article were defrayed in part by page charge payment. Therefore, and solely to indicate this fact, this article is hereby marked “advertisement” in accordance with 18 USC section 1734.

This feature is available to Subscribers Only
Sign In or Create an Account Close Modal