

Key Points
GAB1 upregulation in an intraclonal subpopulation of peripheral blood CLL cells leads to tonic AKT activity and increased homing capacity.
FoxO1-GAB1-pAKT axis can be targeted therapeutically by novel GAB1 inhibitors, alone or in combination with BTK inhibition.

Abstract
Recirculation of chronic lymphocytic leukemia (CLL) cells between the peripheral blood and lymphoid niches plays a critical role in disease pathophysiology, and inhibiting this process is one of the major mechanisms of action for B-cell receptor (BCR) inhibitors such as ibrutinib and idelalisib. Migration is a complex process guided by chemokine receptors and integrins. However, it remains largely unknown how CLL cells integrate multiple migratory signals while balancing survival in the peripheral blood and the decision to return to immune niches. Our study provided evidence that CXCR4/CD5 intraclonal subpopulations can be used to study the regulation of migration of CLL cells. We performed RNA profiling of CXCR4dimCD5bright vs CXCR4brightCD5dim CLL cells and identified differential expression of dozens of molecules with a putative function in cell migration. GRB2–associated binding protein 1 (GAB1) positively regulated CLL cell homing capacity of CXCR4brightCD5dim cells. Gradual GAB1 accumulation in CLL cells outside immune niches was mediated by FoxO1-induced transcriptional GAB1 activation. Upregulation of GAB1 also played an important role in maintaining basal phosphatidylinositol 3-kinase (PI3K) activity and the “tonic” AKT phosphorylation required to sustain the survival of resting CLL B cells. This finding is important during ibrutinib therapy, because CLL cells induce the FoxO1-GAB1-pAKT axis, which represents an adaptation mechanism to the inability to home to immune niches. We have demonstrated that GAB1 can be targeted therapeutically by novel GAB1 inhibitors, alone or in combination with BTK inhibition. GAB1 inhibitors induce CLL cell apoptosis, impair cell migration, inhibit tonic or BCR-induced AKT phosphorylation, and block compensatory AKT activity during ibrutinib therapy.
Introduction
Chronic lymphocytic leukemia (CLL) cell recirculation to and from immune niches has been proposed as a feature of CLL biology,1-7 although it has not been entirely experimentally proven. Inside the immune niches, CLL cells obtain various prosurvival and proproliferative signals leading to activation of the B-cell receptor (BCR), phosphatidylinositol 3-kinase (PI3K)/AKT, and NFκB pathways.2,8-11 Inhibiting CLL cell homing to immune niches represents an important mechanism of action for BCR inhibitors and a possible therapeutic strategy.12-14 One proposed model for the study of CLL cell recirculation is to use CXCR4/CD5 intraclonal subpopulations. It has been postulated that CXCR4dimCD5bright cells represent a proliferative fraction of cells that have recently exited the microenvironment, whereas CXCR4brightCD5dim cells correspond to resting cells circulating in peripheral blood for an extended time before they return back to the immune niches.1-7 CLL cell migration to immune niches is known to be regulated by selectin CD62L15,16 ; integrin VLA417,18 ; and chemokine receptors, such as CXCR4, CXCR5, and CCR7 that guide cells toward gradients of ligands.10,17,19-23 Migration is a highly complex process, and CXCR4 levels in CLL subpopulations were shown to reflect the history of microenvironmental interactions, since binding of SDF1 chemokine to CXCR4 leads to its lower levels on the CLL cell surface, whereas CXCR4 upregulation sensitizes cells to SDF1-guided migration.1-7,20 However, it remains largely unknown how precisely CLL cells integrate multiple migratory signals while balancing survival in peripheral blood and the decision to return to the immune niches. It has been described that CLL cells or normal B cells outside the immune niches can use “tonic” PI3K activation24-28 or autonomous BCR signaling to sustain their survival29 ; however, factors regulating this or their interplay with homing capacity are largely unclear. It is also unclear whether PI3K activation plays a role in adaptation/resistance to BCR signaling inhibition and impaired homing during ibrutinib therapy.30 We hypothesized that analyzing the “resting” nonproliferative CXCR4brightCD5dim cells could help to understand the factors determining the return of these cells to immune niches and/or factors that balance the survival of peripheral blood CLL cells. This may have implications for CLL cell adaption to therapeutic inhibition of homing by BCR inhibitors.
In this study, we have shown that the CXCR4brightCD5dim cell subpopulation has a higher capacity to home into immune niches. Analysis of this subpopulation revealed differential expression of dozens of migration-related genes, including upregulation of GAB1, which is known to act as a migration regulator in nonimmune cells.31,32 However, its role in lymphocyte migration is unknown. It has been demonstrated that GAB1 serves as an adaptor protein that integrates signals from different receptors and affects signaling cascades, such as PI3K/AKT,33-35 MAPK/extracellular signal-regulated kinase (ERK),36-38 PLCγ,39 and Crk/CrkL.40 The results of our study show that GAB1 positively affects CLL cell migration in response to various chemoattractants. Gradual GAB1 accumulation in CLL cells outside immune niches is mediated by FoxO1-induced transcriptional activation of the GAB1 gene. We also found that GAB1 upregulation has a role in maintaining the basal tonic AKT phosphorylation required to sustain CLL cell survival. This is important during ibrutinib therapy since CLL cells induce the FoxO1-GAB1-pAKT axis in this context, which can be targeted therapeutically by the GAB1 inhibitors tested in this study.
Methods
CLL samples and cell lines
The study was approved by the institutional review board, and samples were obtained with written informed consent. CLL samples were purified to contain ≥95% of CD5+19+ cells (see supplemental Methods, available on the Blood Web site). MEC1 and HS5 cell lines were obtained from the German Collection of Microorganisms and Cell Cultures GmbH, and American Type Culture Collection, respectively, and the OSU-CLL was a gift from John Byrd (The Ohio State University, Columbus, OH).41
Gene expression
For RNAseq analysis, freshly isolated CLL cells were sorted according to CXCR4/CD5 expression (purity ≥99.9%), as described previously.7 Libraries were prepared using the TruSeq Stranded messenger mRNA (mRNA) LT Sample Prep Kit (Illumina) and sequenced with the NextSeq 500/550 High Output v2.5 Kit (supplemental Methods).
Migration assays and cell treatments
Cells transfected with siRNA against GAB1, or GAB1/FoxO1 knockout (KO) cells, or control cells were labeled with carboxyfluorescein succinimidyl ester (CFSE) or FarRed CellTrace dye (Thermo Fisher Scientific) or were traced with a plasmid encoding GFP or Azurite, and an equal number of the cells was mixed in a 1:1 ratio (validated by flow cytometry) and injected into the tail vein of NSG mice.42 For a description of the in vitro competitive migration assay, see the supplemental Methods. Cells were treated with ibrutinib (1 µM), MK-2206 2HCl (1 µM), AS1842856 (0.5 µM), plerixafor (5 µg/mL; all from Selleckchem), or GAB1 pleckstrin homology (PH) domain–targeting inhibitors (GAB-001, GAB-004).43 The cells were treated by goat F(ab′)2 anti-human IgM (10 μg/mL; Southern Biotech), SDF1, or CXCL13 (Peprotech), as described previously.2,44,45
Statistical analysis
Apart from NGS analysis (supplemental Methods), all statistical analyses were performed with Prism v8.0.1 (GraphPad). Values of P < .05 were considered significant.
Results
GAB1 is accumulated in CXCR4brightCD5dim intraclonal CLL cell subpopulation
CXCR4/CD5 cell subpopulations have been suggested as a model distinguishing cells ready to reenter immune niches (CXCR4brightCD5dim) vs recent emigrants from lymph nodes (CXCR4dimCD5bright).1-7 We aimed to first test each subpopulation’s migration potential in NSG mice; however, labeling cells with an anti-CXCR4 antibody could affect their responsiveness to the CXCR4 ligand SDF1. To overcome this problem, we used CD5 and forward scatter area (FSC-A reflecting cell size) for cell sorting, because lower FSC-A is typical for CXCR4brightCD5dim and higher FSC-A for the CXCR4dimCD5bright subpopulation (supplemental Figure 1). Subsequently, the sorted subpopulations were stained with 2 cell-tracing dyes, and their 1:1 mixture was injected into the tail vein of NSG mice for a 4-hour competitive migration analysis. In line with the model, the CXCR4brightCD5dim CLL cell subpopulation migrated significantly more into the spleen from the peripheral blood than the CXCR4dimCD5bright cells (Figure 1A). CLL cell migration into bone marrow or the liver was the same, and the number of CLL cells infiltrating these organs was low (supplemental Figure 2), as reported previously.46 The higher CXCR4brightCD5dim cell migration was also confirmed in an in vitro Transwell cell migration assay toward SDF1 (CXCL12), CXCL13, or conditioned medium (CM) derived from primary human mesenchymal stromal cells (CMhMSC; supplemental Figure 2). This finding suggested that it is possible to identify homing-related genes by analyzing CXCR4/CD5 subpopulations. We further performed transcription analysis (RNA sequencing [RNAseq]) of the CXCR4dimCD5bright vs the CXCR4brightCD5dim cell subpopulations (a sorting strategy for CXCR4/CD5 subpopulation in Figure 1B, as detailed previously2,7 ). This process identified 1372 differentially expressed genes in CXCR4/CD5 subpopulations (fold change, >1.5; P < .001). The CXCR4brightCD5dim cells were characterized by BCR/NFκB signature gene downregulation (eg, MYC, CD83, FOS, CCND2, BCL2A1, DUSP2, CCL3, and CLL4), corresponding to a resting nonactivated B-cell phenotype (for the list of genes and principal component analysis, see supplemental Figure 3 and 4; supplemental Table 2). The differentially expressed mRNAs included 147 genes annotated in databases as migration-related (Figure 1C; fold change, >1.5; P < .001; supplemental Table 3), and Gene Ontology analysis confirmed a significant enrichment of migration/adhesion–related genes (supplemental Table 4). Several such randomly selected genes were validated by real-time quantitive polymerase chain reaction (qPCR; supplemental Figure 5). Among these putative migration-related genes, we noticed a GAB1 upregulation (∼1.8-fold) in CXCR4brightCD5dim cells compared with CXCR4dimCD5bright cells. In a previous study, we showed that higher GAB1 levels are associated with shorter overall survival in CLL,35 and GAB1 was identified as a migration regulator in epithelial and muscle cells31,32 and regulator of BCR responsiveness.33-35 The higher GAB1 levels in CXCR4brightCD5dim were confirmed by real-time qPCR at the mRNA level (Figure 1D) and by flow cytometry and immunoblot analysis at the protein level (Figure 1E-G; supplemental Figure 6). On the contrary, GAB1 was downmodulated in CLL cells exposed to microenvironmental signals, such as stromal cell coculture or BCR activation (see below). Altogether, this shows that GAB1 expression is induced in CXCR4brightCD5dim CLL cells that have a relatively increased homing capacity.

Accumulation of GAB1 in CXCR4brightCD5dim intraclonal CLL cell subpopulation. (A) Competitive migration of CXCR4/CD5 CLL cell subpopulation into the spleen of NSG mice and their relative retention in the blood (migration continued for 4 hours, n = 6). Cells were sorted according to FCS-A and CD5 (FCSdimCD5dim correspond to CXCR4brightCD5dim cells and FCSbrightCD5bright correspond to CXCR4dimCD5bright cells; for cell-sorting strategy, see supplemental Figure 1). CXCR4 labeling was not used for cell sorting because it would block CXCR4 interaction with SDF1. One blood sample was excluded from the analysis for technical reasons. (B) Representative gating strategy for CLL cells sorted according to CXCR4/CD5 expression (each subpopulation gated as ∼5% of cells). This sorting, directly based on CXCR4/CD5 labeling, was used for RNAseq profiling and all experiments other than migration assays. (C) Heat map of differentially expressed genes in CXCR4/CD5 subpopulations (fold change, >1.5; P < .001; n = 10), subsequently overlapped with a database of migration-related genes (GO:0016477).47 Lower expression is indicated in blue, higher expression in yellow. Gene names marked in bold were validated by real-time qPCR (see Figure 1D and supplemental Figure 5). Lists of top differentially expressed genes, differentially expressed migration-related genes, and Gene Ontology Term analysis are provided in supplemental Tables 2-4. For the volcano plot, sample correlation, and principal component analysis, see supplemental Figures 3 and 4. For patient characteristics, see supplemental Table 1. (D) Validation of GAB1 mRNA expression (real-time qPCR) in primary CLL samples sorted according to CXCR4/CD5 expression (n = 8). (E) Intracellular flow cytometry staining for GAB1 protein in CXCR4/CD5 subpopulations (n = 22). Normalized mean fluorescence intensity (MFI) was calculated as the ratio between the sample and control sample stained only with a secondary antibody. (F) Representative immunoblot from primary CLL samples sorted according to CXCR4/CD5 expression (purity >99.9%). (G) Densitometric quantification of relative GAB1 protein level analyzed by immunoblot (for individual immunoblots, see Figure 3G and supplemental Figure 6A; for densitometric quantification of other proteins, see supplemental Figure 6B-C).
Accumulation of GAB1 in CXCR4brightCD5dim intraclonal CLL cell subpopulation. (A) Competitive migration of CXCR4/CD5 CLL cell subpopulation into the spleen of NSG mice and their relative retention in the blood (migration continued for 4 hours, n = 6). Cells were sorted according to FCS-A and CD5 (FCSdimCD5dim correspond to CXCR4brightCD5dim cells and FCSbrightCD5bright correspond to CXCR4dimCD5bright cells; for cell-sorting strategy, see supplemental Figure 1). CXCR4 labeling was not used for cell sorting because it would block CXCR4 interaction with SDF1. One blood sample was excluded from the analysis for technical reasons. (B) Representative gating strategy for CLL cells sorted according to CXCR4/CD5 expression (each subpopulation gated as ∼5% of cells). This sorting, directly based on CXCR4/CD5 labeling, was used for RNAseq profiling and all experiments other than migration assays. (C) Heat map of differentially expressed genes in CXCR4/CD5 subpopulations (fold change, >1.5; P < .001; n = 10), subsequently overlapped with a database of migration-related genes (GO:0016477).47 Lower expression is indicated in blue, higher expression in yellow. Gene names marked in bold were validated by real-time qPCR (see Figure 1D and supplemental Figure 5). Lists of top differentially expressed genes, differentially expressed migration-related genes, and Gene Ontology Term analysis are provided in supplemental Tables 2-4. For the volcano plot, sample correlation, and principal component analysis, see supplemental Figures 3 and 4. For patient characteristics, see supplemental Table 1. (D) Validation of GAB1 mRNA expression (real-time qPCR) in primary CLL samples sorted according to CXCR4/CD5 expression (n = 8). (E) Intracellular flow cytometry staining for GAB1 protein in CXCR4/CD5 subpopulations (n = 22). Normalized mean fluorescence intensity (MFI) was calculated as the ratio between the sample and control sample stained only with a secondary antibody. (F) Representative immunoblot from primary CLL samples sorted according to CXCR4/CD5 expression (purity >99.9%). (G) Densitometric quantification of relative GAB1 protein level analyzed by immunoblot (for individual immunoblots, see Figure 3G and supplemental Figure 6A; for densitometric quantification of other proteins, see supplemental Figure 6B-C).
GAB1 increases CLL cell migration
We hypothesized that GAB1 upregulation in a CXCR4brightCD5dim subpopulation may contribute to the return of the CLL cells to the immune niches. To examine cell homing, we created a GAB1 KO MEC1 cell line, using CRISPR-Cas9 technology (Figure 2A). The wild-type MEC1 (MEC1WT) and MEC1GAB1-KO cell lines were labeled with 2 cell-tracing dyes mixed in a 1:1 ratio, and injected into the tail vein of NSG mice (Figure 2B). The result revealed that MEC1GAB1-KO cells were significantly retained in peripheral blood and were relatively less able (∼30% reduction) to migrate to the spleen than were the control cells (Figure 2C). Bone marrow or liver infiltration by MEC1WT vs MEC1GAB1-KO did not differ, and the number of MEC1 cells infiltrating these organs was low (Figure 2C; immunohistology in supplemental Figure 7). Similarly, silencing GAB1 by siRNA in CLL cells impaired their migration to the spleens of NSG mice (Figure 2D; immunohistology in supplemental Figure 8; silencing efficiency in supplemental Figure 9). B-cell migration is known to be regulated by several chemokines, such as SDF1 and CXCL13, produced by cells in immune niches.10,21-23 Indeed, we confirmed their presence in the bone marrow of patients with CLL, production by primary human bone marrow mesenchymal stromal cells, or the human stromal cell line HS5, and in the tissues of NSG mice (supplemental Figure 10). Treating MEC1WT cells with SDF1, CXCL13, or CMhMSC led to rapid (within minutes) GAB1 phosphorylation at activating tyrosines Y307 and Y627 (Figure 2E), suggesting that GAB1 is involved in response to multiple soluble factors. Indeed, in vitro MEC1GAB1-KO cell migration toward SDF1, CXCL13, or CMhMSC was impaired compared with MEC1WT cells (Figure 2F). Similar data were obtained when GAB1 was silenced by siRNA in MEC1 cells, and CM from HS5 cells was used as an attractant (supplemental Figure 11). The specific CXCR4 inhibitor plerixafor largely blocked the GAB1 phosphorylation induced by recombinant SDF1 (CXCR4 ligand) but did not block the phosphorylation induced by the CM, also confirming that signaling by multiple soluble factors involves GAB1 activation (supplemental Figure 11). In primary CLL cells, silencing GAB1 by small interfering RNA (siRNA) also reduced phosphorylation of kinases activated after cell stimulation with SDF1, CXCL13, or CMhMSC (Figure 2G; supplemental Figure 12A) and impaired migration toward SDF1, CXCL13, or CMhMSC in vitro, compared with cells transfected with the negative control (Figure 2H). Cell viability and CXCR4 levels were not affected by siRNA against GAB1 (supplemental Figure 12B-C). Moreover, MEC1GAB1-KO cells failed to properly polymerize F-actin (a process required for effective migration) after stimulation with CM from HS5 cells (supplemental Figure 13A). MEC1GAB1-KO cell motility speed was significantly (P < .001) lower than MEC1WT (supplemental Figure 13B). GAB1 KO also impaired other migration-related characteristics of the cells, as assessed by holographic microscopy (supplemental Table 5). Altogether, findings suggest that GAB1 sensitizes CLL cells to homing signals and influences the related cytoskeletal organization.
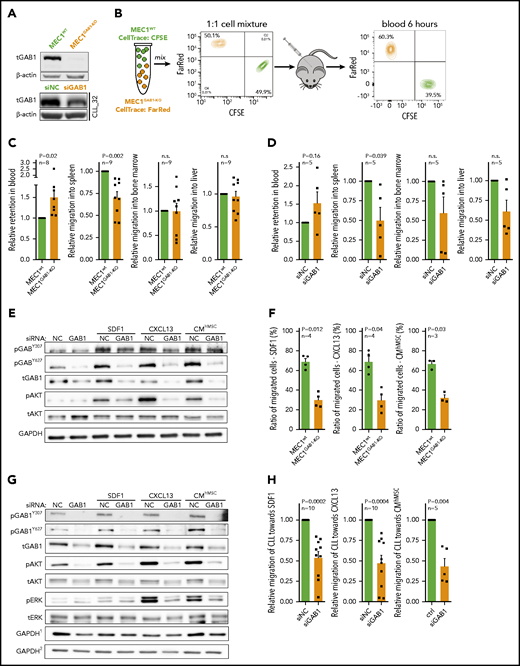
GAB1 increases CLL cell homing capacity. (A) Representative immunoblot for MEC1WT and MEC1 cells genetically engineered for GAB1 KO, using CRISPR/Cas9 (MEC1GAB1-KO) cells (top); primary CLL cells transfected with siRNA against GAB1 (siGAB1) or with the control (siNC; bottom), cells were harvested after 48 hours posttransfection. (B) In vivo competitive migration assay of MEC1WT vs MEC1GAB1-KO. Cells were stained with CFSE or FarRed CellTrace dye, and incubated overnight. The next day, an equal number of CFSE- and FarRed–stained cells (each 50 × 106) were mixed in 1:1 ratio (validated by flow cytometry), and injected into the NSG mice via the tail vein. Organ infiltration was analyzed by gating on human CFSE/FarRed+ cells. The plot depicts the CFSE/FarRed+ MEC1 cells present in peripheral blood of NSG mice. (C) Mice (n = 9) from the experiment described in panel B were euthanized 6 hours after cell transplantation, and blood, spleen, bone marrow, and liver were analyzed by flow cytometry to detect the presence of viable CFSE+ or FarRed+ cells. The amount of MEC1 cells in each examined organ site is presented as relative migration of CFSE+ vs FarRed+ cells. (D) An in vivo competitive migration assay of primary CLL cells (n = 5) transfected with siRNA against GAB1 (siGAB1) or negative control (siNC). After 48 hours, cells were stained with Sytox Blue and sorted for viable cells, and 10 × 106 of cells from each condition were processed as described in panel B. In vivo migration continued for 4 hours, and blood, spleen, bone marrow, and liver were analyzed by flow cytometry to detect the presence of viable CFSE+ or FarRed+ cells. A small aliquot of sorted cells was assayed by immunoblot to confirm GAB1 silencing (supplemental Figure 9). (E) Representative immunoblots of MEC1 cells transfected with siRNA against GAB1 (siGAB1) or the control (siNC). After 48 hours, the cells were treated for 10 minutes with SDF1 (250 ng/mL), CXCL13 (500 ng/mL), or CM (100%) produced by primary human mesenchymal stromal cells (CMhMSC). (F) An in vitro competitive migration assay of MEC1WT vs MEC1GAB1-KO cells (n = 4) stained as described in panel B. Migration toward SDF1 (250 ng/mL), CXCL13 (500 ng/mL), and CMhMSC continued for 6 hours. (G) Representative immunoblots of primary CLL cells treated for 5 minutes with SDF1 (100 ng/mL), CXCL13 (250 ng/mL), or CMhMSC. The immunoblot contained 2 endogenous controls (GAPDH) marked by the index at top, because for technical reasons, pGAB1Y627, tGAB1, tAKT, and tERK (loading control GAPDH1) were analyzed on the first gel and the remaining proteins (loading control GAPDH2) on the second gel (identical protein loading and conditions). (H) In vitro competitive migration assay of primary CLL cells transfected by siRNA against GAB1 (siGAB1) or control siRNA (siNC). Cells were stained as described in panel B and loaded onto a Transwell 48 hours after transfection. Migration continued for 6 hours toward SDF1 (100 ng/mL), CXCL13 (250 ng/mL), or CMhMSC (n = 10 for SDF1 and CXCL13; n = 5 for CMhMSC).
GAB1 increases CLL cell homing capacity. (A) Representative immunoblot for MEC1WT and MEC1 cells genetically engineered for GAB1 KO, using CRISPR/Cas9 (MEC1GAB1-KO) cells (top); primary CLL cells transfected with siRNA against GAB1 (siGAB1) or with the control (siNC; bottom), cells were harvested after 48 hours posttransfection. (B) In vivo competitive migration assay of MEC1WT vs MEC1GAB1-KO. Cells were stained with CFSE or FarRed CellTrace dye, and incubated overnight. The next day, an equal number of CFSE- and FarRed–stained cells (each 50 × 106) were mixed in 1:1 ratio (validated by flow cytometry), and injected into the NSG mice via the tail vein. Organ infiltration was analyzed by gating on human CFSE/FarRed+ cells. The plot depicts the CFSE/FarRed+ MEC1 cells present in peripheral blood of NSG mice. (C) Mice (n = 9) from the experiment described in panel B were euthanized 6 hours after cell transplantation, and blood, spleen, bone marrow, and liver were analyzed by flow cytometry to detect the presence of viable CFSE+ or FarRed+ cells. The amount of MEC1 cells in each examined organ site is presented as relative migration of CFSE+ vs FarRed+ cells. (D) An in vivo competitive migration assay of primary CLL cells (n = 5) transfected with siRNA against GAB1 (siGAB1) or negative control (siNC). After 48 hours, cells were stained with Sytox Blue and sorted for viable cells, and 10 × 106 of cells from each condition were processed as described in panel B. In vivo migration continued for 4 hours, and blood, spleen, bone marrow, and liver were analyzed by flow cytometry to detect the presence of viable CFSE+ or FarRed+ cells. A small aliquot of sorted cells was assayed by immunoblot to confirm GAB1 silencing (supplemental Figure 9). (E) Representative immunoblots of MEC1 cells transfected with siRNA against GAB1 (siGAB1) or the control (siNC). After 48 hours, the cells were treated for 10 minutes with SDF1 (250 ng/mL), CXCL13 (500 ng/mL), or CM (100%) produced by primary human mesenchymal stromal cells (CMhMSC). (F) An in vitro competitive migration assay of MEC1WT vs MEC1GAB1-KO cells (n = 4) stained as described in panel B. Migration toward SDF1 (250 ng/mL), CXCL13 (500 ng/mL), and CMhMSC continued for 6 hours. (G) Representative immunoblots of primary CLL cells treated for 5 minutes with SDF1 (100 ng/mL), CXCL13 (250 ng/mL), or CMhMSC. The immunoblot contained 2 endogenous controls (GAPDH) marked by the index at top, because for technical reasons, pGAB1Y627, tGAB1, tAKT, and tERK (loading control GAPDH1) were analyzed on the first gel and the remaining proteins (loading control GAPDH2) on the second gel (identical protein loading and conditions). (H) In vitro competitive migration assay of primary CLL cells transfected by siRNA against GAB1 (siGAB1) or control siRNA (siNC). Cells were stained as described in panel B and loaded onto a Transwell 48 hours after transfection. Migration continued for 6 hours toward SDF1 (100 ng/mL), CXCL13 (250 ng/mL), or CMhMSC (n = 10 for SDF1 and CXCL13; n = 5 for CMhMSC).
FoxO1 serves as a transcriptional activator of GAB1
To reveal potential GAB1 expression regulators, we identified 20 annotated48 transcription factors significantly differentially expressed in CXCR4/CD5 subpopulations (Figure 3A; supplemental Table 6). We further studied FoxO1 as a potential GAB1 regulator because of the presence of multiple putative evolutionary conserved binding sites upstream from the GAB1 promotor (supplemental Figures 14 and 15; supplemental Table 7). We also focused on FoxO1 because it has been identified as a regulator of T-cell homing49 and normal B-cell migration within the germinal centers50,51 and is involved in malignant B-cell biology.52,53 Chromatin immunoprecipitation identified FoxO1 binding at 2 sites upstream from the GAB1 transcription start sites (Figure 3B; supplemental Table 8). In addition, FoxO1 downmodulation by siRNA or treatment with FoxO1 inhibitor significantly repressed GAB1 at the mRNA and protein levels (Figure 3C-D; supplemental Figure 16A-B). The existence of a FoxO1-GAB1 axis is supported by a general positive correlation of GAB1 and FoxO1 mRNA levels (n = 42) and protein levels (n = 22) in CLL cells (Figure 3E-F), and the higher levels of both molecules in CXCR4brightCD5dim cells (Figure 3G-I; supplemental Figure 6). Moreover, MEC1 cells without FoxO1 (MEC1FoxO1-KO) had lower GAB1 levels (supplemental Figure 16C) and had impaired migration to immune niches in NSG mice in comparison with MEC1WT cells (supplemental Figure 17A). The migration of MEC1FoxO1-KO cells or CLL cells with silenced FoxO1 toward SDF1, CXCL13, or CMhMSC was also impaired in vitro (supplemental Figure 17B-C), which mimics the MEC1GAB1-KO cell phenotype.
![FoxO1 serves as a transcriptional activator of GAB1. (A) Heat map of differentially expressed transcription factors (RNAseq; Illumina) in 10 primary CLL samples sorted according to CXCR4/CD5 expression (fold change, ≥2; P < .001). The list of all known human transcriptional factors was obtained from Lambert et al.48 (B) Chromatin immunoprecipitation analysis of FoxO1 binding upstream of the transcription start site of GAB1 gene (n = 5; binding sites are numbered as in supplemental Figure 14). The results for transcription binding sites (TBSs) 4 and 10 are represented as the DNA input percentage, and error bars indicate the standard error of the mean. Control samples (Ctrl, α-IgG; Ctrl, α-FoxO1) were analyzed by primers that amplified a region in the GAB1 second intron, which does not contain any predicted binding site for FoxO1. Data for other predicted TBSs were not analyzed or were inconclusive (supplemental Table 8). (Ci) The effect of siRNA against FoxO1 (siFoxO1) on GAB1 mRNA expression in MEC1 cells compared with cell transfection with a control scrambled siRNA (siNC; 48 hours after transfection, n = 5). (Cii) Representative immunoblot of FoxO1 silencing by siRNA (siFoxO1) and its impact on GAB1 protein level in MEC1 cells (48 hours). The siRNA against GAB1 (siGAB1) serves as a positive control and control scrambled siRNA (siNC) as a negative control. (Di) Representative immunoblot of GAB1 levels in primary CLL cells treated in vitro with various doses of FoxO1 inhibitor (inhFoxO1, 0.6-10 µM; 48 hours). CD20 induction was used as a positive control, because FoxO1 acts as a transcriptional repressor of CD20.54 (Dii) Statistical analysis of FoxO1 inhibitor’s effect (inhFoxO1; 1 µM) on GAB1 mRNA expression in primary CLL (n = 3; 48 hours) and MEC1 (n = 6; 48 hours) cells. GAB1 mRNA expression in each control sample (dimethyl sulfoxide [DMSO] treated) was set at 1. (E) GAB1 and FoxO1 mRNA expression correlation analysis in primary CLL cells (n = 42; real-time qPCR). (F) Correlation of GAB1 and FoxO1 intracellular protein levels assessed by flow cytometry (n = 22). (G) Representative immunoblot from intraclonal CLL cell subpopulations sorted according to CXCR4/CD5 expression (purity >99.9%). Subpopulation sorting was performed according to the gating strategy in Figure 1B. BCLXL levels served as a positive control for microenvironmental interactions. For other immunoblots and densitometric quantification, see supplemental Figure 6. (H) FoxO1 expression in CXCR4/CD5 subpopulations was assessed by intracellular staining (n = 22; flow cytometry). As a control, an identical CXCR4/CD5-stained sample was incubated with a secondary antibody only. (I) Validation of FoxO1 mRNA expression in primary CLL samples. CLL cells were sorted according to CXCR4/CD5 expression and analyzed by real-time qPCR (n = 9). (Ji) Representative immunoblot from MEC1 cells treated with a selective inhibitor of AKT (inhAKT; MK-2206, 2HCl; 1 µM) or vehicle (DMSO). The primary antibody against pFoxO1 detected phosphorylation on S256, which led to inhibition of FoxO1 activity. (Jii) GAB1 mRNA expression in MEC1 cells treated with a selective AKT inhibitor (as in Ji) for 24 hours (n = 8).](https://ash.silverchair-cdn.com/ash/content_public/journal/blood/138/9/10.1182_blood.2020008101/5/m_bloodbld2020008101f3.png?Expires=1767698527&Signature=3JSNH46d2qvMQlDb8T0IkhRfSwO8qmuLJHxpay6cQj-EJ6i3LKQ3A-~UU7sXtmPs3IpQcSjSPHIaY73T3ZT8koZtA5T-t9NsyU4UU1KDURQSZztbCA8WlKMcCBIjABATs60~-mnohjLPF7YurbYuoXDyqaXDgsSIcMiaRzvzuZm-rcamaawq00dEwI4GTsH1NR7iigiturUfLPORtLGgWduI4losxbxyMONafUizYZizgRaXiyWK1jCIaxOn9rzMOmV6kr33~uoJ4t9TXyZI34z-NMTozHlVnvX3jUqNEF47~k1OS7Sb8aWr6g7yds64WZ3u08aSgCqpihR5jMSYtw__&Key-Pair-Id=APKAIE5G5CRDK6RD3PGA)
FoxO1 serves as a transcriptional activator of GAB1. (A) Heat map of differentially expressed transcription factors (RNAseq; Illumina) in 10 primary CLL samples sorted according to CXCR4/CD5 expression (fold change, ≥2; P < .001). The list of all known human transcriptional factors was obtained from Lambert et al.48 (B) Chromatin immunoprecipitation analysis of FoxO1 binding upstream of the transcription start site of GAB1 gene (n = 5; binding sites are numbered as in supplemental Figure 14). The results for transcription binding sites (TBSs) 4 and 10 are represented as the DNA input percentage, and error bars indicate the standard error of the mean. Control samples (Ctrl, α-IgG; Ctrl, α-FoxO1) were analyzed by primers that amplified a region in the GAB1 second intron, which does not contain any predicted binding site for FoxO1. Data for other predicted TBSs were not analyzed or were inconclusive (supplemental Table 8). (Ci) The effect of siRNA against FoxO1 (siFoxO1) on GAB1 mRNA expression in MEC1 cells compared with cell transfection with a control scrambled siRNA (siNC; 48 hours after transfection, n = 5). (Cii) Representative immunoblot of FoxO1 silencing by siRNA (siFoxO1) and its impact on GAB1 protein level in MEC1 cells (48 hours). The siRNA against GAB1 (siGAB1) serves as a positive control and control scrambled siRNA (siNC) as a negative control. (Di) Representative immunoblot of GAB1 levels in primary CLL cells treated in vitro with various doses of FoxO1 inhibitor (inhFoxO1, 0.6-10 µM; 48 hours). CD20 induction was used as a positive control, because FoxO1 acts as a transcriptional repressor of CD20.54 (Dii) Statistical analysis of FoxO1 inhibitor’s effect (inhFoxO1; 1 µM) on GAB1 mRNA expression in primary CLL (n = 3; 48 hours) and MEC1 (n = 6; 48 hours) cells. GAB1 mRNA expression in each control sample (dimethyl sulfoxide [DMSO] treated) was set at 1. (E) GAB1 and FoxO1 mRNA expression correlation analysis in primary CLL cells (n = 42; real-time qPCR). (F) Correlation of GAB1 and FoxO1 intracellular protein levels assessed by flow cytometry (n = 22). (G) Representative immunoblot from intraclonal CLL cell subpopulations sorted according to CXCR4/CD5 expression (purity >99.9%). Subpopulation sorting was performed according to the gating strategy in Figure 1B. BCLXL levels served as a positive control for microenvironmental interactions. For other immunoblots and densitometric quantification, see supplemental Figure 6. (H) FoxO1 expression in CXCR4/CD5 subpopulations was assessed by intracellular staining (n = 22; flow cytometry). As a control, an identical CXCR4/CD5-stained sample was incubated with a secondary antibody only. (I) Validation of FoxO1 mRNA expression in primary CLL samples. CLL cells were sorted according to CXCR4/CD5 expression and analyzed by real-time qPCR (n = 9). (Ji) Representative immunoblot from MEC1 cells treated with a selective inhibitor of AKT (inhAKT; MK-2206, 2HCl; 1 µM) or vehicle (DMSO). The primary antibody against pFoxO1 detected phosphorylation on S256, which led to inhibition of FoxO1 activity. (Jii) GAB1 mRNA expression in MEC1 cells treated with a selective AKT inhibitor (as in Ji) for 24 hours (n = 8).
FoxO1 serves as a transcriptional activator of GAB1. (A) Heat map of differentially expressed transcription factors (RNAseq; Illumina) in 10 primary CLL samples sorted according to CXCR4/CD5 expression (fold change, ≥2; P < .001). The list of all known human transcriptional factors was obtained from Lambert et al.48 (B) Chromatin immunoprecipitation analysis of FoxO1 binding upstream of the transcription start site of GAB1 gene (n = 5; binding sites are numbered as in supplemental Figure 14). The results for transcription binding sites (TBSs) 4 and 10 are represented as the DNA input percentage, and error bars indicate the standard error of the mean. Control samples (Ctrl, α-IgG; Ctrl, α-FoxO1) were analyzed by primers that amplified a region in the GAB1 second intron, which does not contain any predicted binding site for FoxO1. Data for other predicted TBSs were not analyzed or were inconclusive (supplemental Table 8). (Ci) The effect of siRNA against FoxO1 (siFoxO1) on GAB1 mRNA expression in MEC1 cells compared with cell transfection with a control scrambled siRNA (siNC; 48 hours after transfection, n = 5). (Cii) Representative immunoblot of FoxO1 silencing by siRNA (siFoxO1) and its impact on GAB1 protein level in MEC1 cells (48 hours). The siRNA against GAB1 (siGAB1) serves as a positive control and control scrambled siRNA (siNC) as a negative control. (Di) Representative immunoblot of GAB1 levels in primary CLL cells treated in vitro with various doses of FoxO1 inhibitor (inhFoxO1, 0.6-10 µM; 48 hours). CD20 induction was used as a positive control, because FoxO1 acts as a transcriptional repressor of CD20.54 (Dii) Statistical analysis of FoxO1 inhibitor’s effect (inhFoxO1; 1 µM) on GAB1 mRNA expression in primary CLL (n = 3; 48 hours) and MEC1 (n = 6; 48 hours) cells. GAB1 mRNA expression in each control sample (dimethyl sulfoxide [DMSO] treated) was set at 1. (E) GAB1 and FoxO1 mRNA expression correlation analysis in primary CLL cells (n = 42; real-time qPCR). (F) Correlation of GAB1 and FoxO1 intracellular protein levels assessed by flow cytometry (n = 22). (G) Representative immunoblot from intraclonal CLL cell subpopulations sorted according to CXCR4/CD5 expression (purity >99.9%). Subpopulation sorting was performed according to the gating strategy in Figure 1B. BCLXL levels served as a positive control for microenvironmental interactions. For other immunoblots and densitometric quantification, see supplemental Figure 6. (H) FoxO1 expression in CXCR4/CD5 subpopulations was assessed by intracellular staining (n = 22; flow cytometry). As a control, an identical CXCR4/CD5-stained sample was incubated with a secondary antibody only. (I) Validation of FoxO1 mRNA expression in primary CLL samples. CLL cells were sorted according to CXCR4/CD5 expression and analyzed by real-time qPCR (n = 9). (Ji) Representative immunoblot from MEC1 cells treated with a selective inhibitor of AKT (inhAKT; MK-2206, 2HCl; 1 µM) or vehicle (DMSO). The primary antibody against pFoxO1 detected phosphorylation on S256, which led to inhibition of FoxO1 activity. (Jii) GAB1 mRNA expression in MEC1 cells treated with a selective AKT inhibitor (as in Ji) for 24 hours (n = 8).
To understand the GAB1 regulation via FoxO1, we further analyzed the mechanisms resulting in their relatively higher levels in CXCR4brightCD5dim CLL cells and lower levels in CXCR4dimCD5bright cells. In normal B cells, FoxO1 is known to be negatively regulated by its phosphorylation at position S256 in the context of BCR activation. This regulatory process is mediated by active AKT, leading to loss of FoxO1 interaction with DNA, translocation to cytoplasm, and subsequent degradation.55,56 Indeed, in CLL cells, strong AKT activation by BCR cross-linking or stromal cell coculture induced inhibitory FoxO1 phosphorylation with its subsequent degradation, and concurrently, GAB1 mRNA and protein levels were decreased (supplemental Figure 18). On the contrary, selective AKT inhibitor induced dephosphorylation of FoxO1, and upregulation of GAB1 mRNA and protein levels (∼twofold increase; Figure 3J). The expression of other selected BCR/microenvironment-related proteins such as SYK, PLCγ, or CD79α, was not affected by AKT inhibition (Figure 3J; supplemental Figure 19). These data suggest that AKT is a crucial, negative GAB1 regulator acting via reducing its transcriptional activator levels, FoxO1. On the other hand, relatively lower AKT activity in CXCR4brightCD5dim cells (supplemental Figure 21) allows for an increase in FoxO1 and induction of GAB1. Altogether, the data show that FoxO1 transcriptionally regulates GAB1, and both proteins are upregulated in the CXCR4brightCD5dim intraclonal cell subpopulation contributing to increased cell migration capacity.
GAB1 increases tonic AKT phosphorylation
We and others have shown that GAB1 is phosphorylated after BCR activation and serves as an important docking protein, allowing for propagation of the signal to PI3K and AKT.33,35 In line with this, we observed that silencing of GAB1 impaired AKTS473 phosphorylation after BCR cross-linking (Figure 4A). In this respect, we noted that modulation of the GAB1 level also affected basal AKT phosphorylation levels, irrespective of BCR cross-linking (Figure 4A), hinting at a possible role in tonic AKT activity. Indeed, GAB1 overexpression by a plasmid construct induced AKT phosphorylation (Figure 4B). Analogically, silencing endogenous GAB1 by siRNA reduced AKT phosphorylation (Figure 4C). The effect of GAB1 on AKT activation was validated on MEC1 and OSU-CLL cells with tetracycline-inducible shRNA against GAB1 (Figure 4D). GAB1 overexpression led to the induction of phosphorylation of the PI3K subunit p85, whereas GAB1 silencing by siRNA had the opposite effect (Figure 4B-C), which indicates that a GAB1–induced increase in p85 phosphorylation is a possible mechanism behind the observed increase in AKT phosphorylation. We have also tested MEC1GAB1-KO vs MEC1WT cell growth capacity after engraftment in mice for 3 weeks. Similar to the short-term migration assays, the MEC1WT and MEC1GAB1-KO cell lines (each traced with GFP/Azurite) were mixed in a 1:1 ratio and injected into the tail vein of NSG mice. This revealed approximately twice as many MEC1WT cells as MEC1GAB1-KO cells in the spleen, bone marrow, and liver, a difference slightly larger than in the migration experiments (Figure 4E; immunohistology in supplemental Figure 22), suggesting that GAB1 KO also negatively affects general cell fitness. To further investigate the FoxO1-GAB1-pAKT axis, we analyzed MEC1FoxO1-KO cells and observed diminished GAB1 levels and reduced AKT phosphorylation compared with MEC1WT cells (Figure 4F). A similar phenotype was obtained after FoxO1 silencing by siRNA in primary CLL cells, after MEC1 cells, or CLL-cell treatment with FoxO1 inhibitor (Figure 4F; supplemental Figure 16). Altogether, this suggests that increased FoxO1/GAB1 levels in CXCR4brightCD5dim CLL cells contribute to tonic pAKT activity.
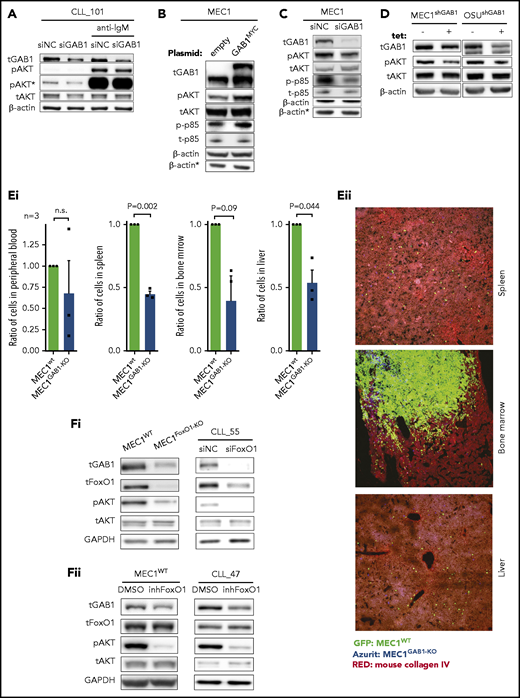
GAB1 increases tonic AKT phosphorylation. (A) Representative immunoblots of primary CLL cells transfected with siRNA against GAB1 (siGAB1) or the negative control (siNC). Cells were harvested after 48 hours, divided into equal portions, and exposed to vehicle (control samples) or anti-IgM for 5 minutes (10 µg/mL). *pAKT (S473) is the same immunoblot as pAKT but was developed for a prolonged time. (B) Representative immunoblot of MEC1 cells transfected with a plasmid for GAB1 protein overexpression tagged with MYC sequence (GAB1MYC, top band) or with an empty vector (empty), and cultured for 48 hours. *β-Actin was the endogenous control for p-p85 and t-p85 assayed on a separate gel with identical loading. (C) Representative immunoblot of MEC1 cells transfected with siRNA against GAB1 (siGAB1) or the negative control (siNC) and harvested 48 hours after transfection. *β-Actin, as in panel B. (D) Representative immunoblot of MEC1 and OSU-CLL cells (CLL-derived cell line) with downmodulated GAB1 levels. MEC1 and OSU-CLL cells were infected with a lentiviral construct (permanent cell line) for tetracycline-inducible shRNA against GAB1 (shGAB1). shRNA expression was induced by adding tetracycline to medium (tet+) for 48 hours, and control cells were treated with vehicle (tet−). (Ei) Effect of GAB1 KO on MEC1 cell growth in vivo. MEC1WT and MEC1GAB1-KO cells were transduced with vectors expressing GFP or Azurite, mixed 1:1, and injected via tail vein into NSG mice (n = 3). Mice were euthanized 3 weeks after injection, and organs were analyzed by flow cytometry for the presence of MEC1WT and MEC1GAB1-KO cells labeled by GFP or Azurite in blood, spleen, bone marrow, and liver. We also performed a switch of fluorescent labels to exclude any potential effect of a specific fluorescent proteins on the cells (not shown). (Eii) Representative images from fluorescence microscopy of the spleen, bone marrow, and liver of NSG transplant recipients, as described in panel Ei (original magnification, ×20). (Fi) Representative immunoblot for the effect of FoxO1 attenuation by KO in MEC1 cells (MEC1WT vs MEC1FoxO1-KO cells) or by siRNA in primary CLL cells. Primary CLL cells were transfected with siRNA against FoxO1 (siFoxO1) or with control (siNC) and analyzed by immunoblot 48 hours later. (Fii) Representative immunoblots for MEC1 cells and primary CLL cells treated with FoxO1 inhibitor (inhFoxO1; 0.5 µM, 24 hours).
GAB1 increases tonic AKT phosphorylation. (A) Representative immunoblots of primary CLL cells transfected with siRNA against GAB1 (siGAB1) or the negative control (siNC). Cells were harvested after 48 hours, divided into equal portions, and exposed to vehicle (control samples) or anti-IgM for 5 minutes (10 µg/mL). *pAKT (S473) is the same immunoblot as pAKT but was developed for a prolonged time. (B) Representative immunoblot of MEC1 cells transfected with a plasmid for GAB1 protein overexpression tagged with MYC sequence (GAB1MYC, top band) or with an empty vector (empty), and cultured for 48 hours. *β-Actin was the endogenous control for p-p85 and t-p85 assayed on a separate gel with identical loading. (C) Representative immunoblot of MEC1 cells transfected with siRNA against GAB1 (siGAB1) or the negative control (siNC) and harvested 48 hours after transfection. *β-Actin, as in panel B. (D) Representative immunoblot of MEC1 and OSU-CLL cells (CLL-derived cell line) with downmodulated GAB1 levels. MEC1 and OSU-CLL cells were infected with a lentiviral construct (permanent cell line) for tetracycline-inducible shRNA against GAB1 (shGAB1). shRNA expression was induced by adding tetracycline to medium (tet+) for 48 hours, and control cells were treated with vehicle (tet−). (Ei) Effect of GAB1 KO on MEC1 cell growth in vivo. MEC1WT and MEC1GAB1-KO cells were transduced with vectors expressing GFP or Azurite, mixed 1:1, and injected via tail vein into NSG mice (n = 3). Mice were euthanized 3 weeks after injection, and organs were analyzed by flow cytometry for the presence of MEC1WT and MEC1GAB1-KO cells labeled by GFP or Azurite in blood, spleen, bone marrow, and liver. We also performed a switch of fluorescent labels to exclude any potential effect of a specific fluorescent proteins on the cells (not shown). (Eii) Representative images from fluorescence microscopy of the spleen, bone marrow, and liver of NSG transplant recipients, as described in panel Ei (original magnification, ×20). (Fi) Representative immunoblot for the effect of FoxO1 attenuation by KO in MEC1 cells (MEC1WT vs MEC1FoxO1-KO cells) or by siRNA in primary CLL cells. Primary CLL cells were transfected with siRNA against FoxO1 (siFoxO1) or with control (siNC) and analyzed by immunoblot 48 hours later. (Fii) Representative immunoblots for MEC1 cells and primary CLL cells treated with FoxO1 inhibitor (inhFoxO1; 0.5 µM, 24 hours).
Ibrutinib leads to compensatory GAB1-mediated AKT activation
Ibrutinib therapy inhibits CLL cell homing,6,57 and we hypothesized that this could affect the FoxO1-GAB1-pAKT axis. Indeed, treating MEC1 cells with ibrutinib in vitro led to FoxO1 and GAB1 protein and mRNA accumulation (Figure 5A-C), albeit the kinetics of mRNA and protein induction were not identical, and the GAB1 protein levels were sustained for longer. Similarly, treating CLL patients with ibrutinib in vivo leads to increased FoxO1 and GAB1 protein and mRNA levels (Figure 5D-E). Notably, after an initial drop in AKT phosphorylation, we observed restoration of AKTS473 phosphorylation after several days of continuous MEC1 cell exposure to ibrutinib in vitro (Figure 5A) or after several days or weeks of ibrutinib therapy in CLL patients in vivo (Figure 5D; supplemental Figure 23). Idelalisib, as a single agent, also increased GAB1 and FoxO1 protein levels, but the induction of pAKT was less prominent (supplemental Figure 24). This result corresponds to the PI3K involvement in inducing AKT phosphorylation after GAB1 upregulation (Figures 4B-C and Figure 5D). Importantly, the AKT phosphorylation in response to ibrutinib did not lead to FoxO1 localization into the cytoplasm, and FoxO1 remained in the nucleus, enabling it to function as a transcription factor (supplemental Figure 25). This finding is in line with the data of another study suggesting that transport of FoxO1 from the nucleus upon AKT activation is impaired in B-cell lymphomas,52 and the FoxO1 activity is not mutually exclusive with low-level pAKT. Importantly, the GAB1 knockdown prevented the restoration of AKT phosphorylation in ibrutinib-treated cells (Figure 5F). Altogether, this result suggests that increasing GAB1 levels in CLL cells during ibrutinib therapy provides tonic pAKT activity and may compensate for the lack of AKT activation via BCR/microenvironmental interactions during ibrutinib therapy.
![GAB1 levels and AKT phosphorylation is increased during ibrutinib therapy. (A) Representative immunoblot of MEC1 cells treated with ibrutinib (2 µM) or vehicle (dimethyl sulfoxide [DMSO]) for the indicated time points. Ibrutinib and DMSO were freshly supplemented every 24 hours, and the cells were sampled at the indicated time points for immunoblot analysis. (B-C) FoxO1 and GAB1 mRNA expression in MEC1 cells treated with ibrutinib or DMSO, as described in panel A (n = 5). (Di) Representative immunoblot for primary CLL cells isolated from peripheral blood of patient before (Pre) and during ibrutinib therapy. For the patients’ characteristics, see supplemental Table 1. *β-Actin was the endogenous control for p-p85 and t-p85, assayed on a separate gel with identical loading. (Dii) Statistical analysis of normalized densitometric data from immunoblots of CLL samples (n = 11) obtained from patients before (Pre) and during ibrutinib therapy. The data are relative to expression before ibrutinib administration (set at 1). For additional immunoblots, see supplemental Figure 23. (E) GAB1 and FoxO1 mRNA expression in primary samples isolated from patients with CLL before (Pre) and during ibrutinib therapy (n = 11; for patients’ characteristics, see supplemental Table 1). The data are relative to expression before ibrutinib (set as 1). (F) Representative immunoblot of MEC1WT and MEC1GAB1-KO cells treated with ibrutinib (1 µM) or vehicle (DMSO) for 7 days. *Decrease in total BTK protein level is a common effect of ibrutinib, as described previously.58](https://ash.silverchair-cdn.com/ash/content_public/journal/blood/138/9/10.1182_blood.2020008101/5/m_bloodbld2020008101f5.png?Expires=1767698527&Signature=OkrMK-zgkDIGLlXpLNSSCUCfMr7kZQDVBah2iD0v37fRg7tlCVvgiyJiqxDAOp0fF7IJPb6OEePVcSP9LxyjmrecNtOz-4jKrvl20mRZh4NHdGyFzIHzFfE9m9343aHcnBRyZg--DbFCHJmrv~oUWDIcCo8IIAyvwfHZAJfttvIdR1F629hOeqku7eu1Yaje09MY3T4aInxHSI9P812lbEXJ15MAz7niLfbcHngzifXS5dwwKQmj8KKBweqnKjhc0L3r5VFe8M3wemyqKp1BO0gHgqZOrX34J5pqInp4WYdmNtJU2gsD8hKMRPSRV85eHaKCdLhTWx2V4dqRXfzgTA__&Key-Pair-Id=APKAIE5G5CRDK6RD3PGA)
GAB1 levels and AKT phosphorylation is increased during ibrutinib therapy. (A) Representative immunoblot of MEC1 cells treated with ibrutinib (2 µM) or vehicle (dimethyl sulfoxide [DMSO]) for the indicated time points. Ibrutinib and DMSO were freshly supplemented every 24 hours, and the cells were sampled at the indicated time points for immunoblot analysis. (B-C) FoxO1 and GAB1 mRNA expression in MEC1 cells treated with ibrutinib or DMSO, as described in panel A (n = 5). (Di) Representative immunoblot for primary CLL cells isolated from peripheral blood of patient before (Pre) and during ibrutinib therapy. For the patients’ characteristics, see supplemental Table 1. *β-Actin was the endogenous control for p-p85 and t-p85, assayed on a separate gel with identical loading. (Dii) Statistical analysis of normalized densitometric data from immunoblots of CLL samples (n = 11) obtained from patients before (Pre) and during ibrutinib therapy. The data are relative to expression before ibrutinib administration (set at 1). For additional immunoblots, see supplemental Figure 23. (E) GAB1 and FoxO1 mRNA expression in primary samples isolated from patients with CLL before (Pre) and during ibrutinib therapy (n = 11; for patients’ characteristics, see supplemental Table 1). The data are relative to expression before ibrutinib (set as 1). (F) Representative immunoblot of MEC1WT and MEC1GAB1-KO cells treated with ibrutinib (1 µM) or vehicle (DMSO) for 7 days. *Decrease in total BTK protein level is a common effect of ibrutinib, as described previously.58
GAB1 levels and AKT phosphorylation is increased during ibrutinib therapy. (A) Representative immunoblot of MEC1 cells treated with ibrutinib (2 µM) or vehicle (dimethyl sulfoxide [DMSO]) for the indicated time points. Ibrutinib and DMSO were freshly supplemented every 24 hours, and the cells were sampled at the indicated time points for immunoblot analysis. (B-C) FoxO1 and GAB1 mRNA expression in MEC1 cells treated with ibrutinib or DMSO, as described in panel A (n = 5). (Di) Representative immunoblot for primary CLL cells isolated from peripheral blood of patient before (Pre) and during ibrutinib therapy. For the patients’ characteristics, see supplemental Table 1. *β-Actin was the endogenous control for p-p85 and t-p85, assayed on a separate gel with identical loading. (Dii) Statistical analysis of normalized densitometric data from immunoblots of CLL samples (n = 11) obtained from patients before (Pre) and during ibrutinib therapy. The data are relative to expression before ibrutinib administration (set at 1). For additional immunoblots, see supplemental Figure 23. (E) GAB1 and FoxO1 mRNA expression in primary samples isolated from patients with CLL before (Pre) and during ibrutinib therapy (n = 11; for patients’ characteristics, see supplemental Table 1). The data are relative to expression before ibrutinib (set as 1). (F) Representative immunoblot of MEC1WT and MEC1GAB1-KO cells treated with ibrutinib (1 µM) or vehicle (DMSO) for 7 days. *Decrease in total BTK protein level is a common effect of ibrutinib, as described previously.58
GAB1 inhibitors reduce migration and induce cell apoptosis alone and in combination with ibrutinib
We hypothesize that GAB1 upregulation during ibrutinib therapy acts as a mechanism to compensate for the lack of pAKT levels and that this effect can be targeted therapeutically. Recently, the first GAB1 inhibitors targeting the PH-domain necessary for GAB1’s docking function have been developed.43 We observed that these compounds led to a dose-dependent inhibition of GAB1 phosphorylation, AKT inhibition (Figure 6A; supplemental Figure 26) and decreased CLL cell viability at higher micromolar concentrations after 48 hours (Figure 6B). To test GAB1 inhibitor specificity, MEC1WT and MEC1GAB1-KO cells were treated with various doses of the inhibitors. This demonstrated a greater induction of apoptosis and pERK/pAKT repression in MEC1WT cells by GAB1 inhibitor than in MEC1GAB1-KO cells (supplemental Figure 27). GAB1 inhibitors also inhibited CLL cell migration toward HS5 CM, SDF1, CXCL13, or CMhMSC (Figure 6C-E). GAB1 inhibition impaired Ca2+ influx induced by SDF1 chemokine (Figure 6F) and BCR-induced (anti-IgM) AKT phosphorylation (Figure 6G). Importantly, the GAB1 inhibitor blocked the “compensatory” AKT phosphorylation induced by ibrutinib (Figure 6Hi) and increased the apoptosis of MEC1 cells exposed to ibrutinib for an extended time (Figure 6Hii). To test this in primary CLL cells undergoing spontaneous apoptosis within days, CLL cells were cultured in medium with interleukin 4 (IL4), which partially prevented their spontaneous apoptosis, and were simultaneously treated with ibrutinib or vehicle for 6 days, to allow time for FoxO1-GAB1 induction (supplemental Figure 28A). Subsequently, these cells were treated with GAB1 inhibitors (or vehicle) for an additional 48 hours. CLL cell killing was increased by GAB1 inhibitors combined with ibrutinib, compared with ibrutinib or GAB1 inhibitor alone (Figure 6I-J; P < .001). In culture conditions without IL4, allowing for only a short-term experiment, GAB1 inhibitors showed an ability to kill primary CLL cells within 48 hours, but this was not synergistic with ibrutinib (supplemental Figure 28B). This result was expected because in a brief time of ibrutinib exposure, the GAB1 inhibitor acts similarly to a BCR inhibitor in inhibiting tonic pAKT levels, and ibrutinib does not yet induce compensatory AKT phosphorylation via GAB1. Altogether, GAB1 inhibition can be used to inhibit CLL migration, basal or BCR-induced AKT activity, and adaptive AKT activation during ibrutinib therapy.
![GAB1 inhibitors impair CLL migration and induce cell apoptosis, alone and in combination with ibrutinib. (A) Representative immunoblots from primary CLL cells treated for 6 hours with various doses (10, 25, and 50 µM) of 2 GAB1 inhibitors or with the same volume of vehicle (dimethyl sulfoxide [DMSO]) or with culture medium only (CTRL). This short-term treatment (6 hours) did not significantly impact cell viability (supplemental Figure 26). (B) The effect of various doses of GAB1 inhibitors on CLL cell viability after 48 hours (n = 5). The primary CLL cells were treated as described in panel A. (C) GAB1 inhibitor effect on primary CLL cell migration (n = 7). Cells were treated with inhGAB1-001 (25 µM) or inhGAB1-004 (25 µM) or ibrutinib (1 µM) or their combination for 12 hours. Cells were subsequently stained with CellTrace dye and loaded into a Transwell, and migration continued for 4 hours toward 50% CM (produced by HS5 stroma cells). (D-E) Effect of a GAB1 inhibitors on primary CLL cell migration (n = 6). Cells were pretreated, stained, and loaded into a Transwell as described in panel C. Cell migration continued for 6 hours toward SDF1 (100 ng/mL), CXCL13 (250 ng/mL), or 50% CM produced by HS5 cells or 100% CM produced by primary human bone marrow MSCs (CMhMSC). (F) Effect of GAB1 inhibitors (6 hours pretreatment; 25 µM) on calcium influx in primary CLL cells after SDF1 stimulation (100 µg/mL; arrow). Ionomycin (indicated by + ionom arrow) was added as a positive control. (G) Representative immunoblot from primary CLL cells treated with GAB1 inhibitors (inhGAB1-001 or inhGAB1-004; 25 µM) and stimulated with anti-IgM. Primary CLL cells were treated as described in panel A, and cells were divided into equal portions and exposed to vehicle (CTRL) or anti-IgM (10 µg/mL, 5 minutes). (Hi) Representative immunoblot of MEC1 cells pretreated with ibrutinib for 24 hours or 7 days and subsequently exposed to vehicle (DMSO) or GAB1 inhibitors for 6 hours (inhGAB1-001 or inhGAB1-004; 25 µM). (Hii) Statistical analysis of MEC1 cells' viability (n = 6). Cells were pretreated for 7 days with ibrutinib (1 µM; fresh ibrutinib added every 48 hours) or vehicle (DMSO; added every 48 hours), and subsequently exposed to GAB1 inhibitor (inhGAB1-001; 25 µM) for another 48 hours. (I-J) Effect of GAB1 inhibitors GAB1-001 (I) or GAB1-004 (J), alone or in combination with ibrutinib on the viability of primary CLL cells (n = 14). CLL cells were cultured in medium with IL4 (5 ng/mL) and simultaneously treated with ibrutinib (ibr; 1 µM) or vehicle (DMSO) for 6 days. Subsequently, the cells were treated with a combination of GAB1 inhibitors (2.5-50 µM) and ibrutinib (1 µM), vehicle (DMSO), ibrutinib alone (1 µM), or GAB1 inhibitor alone for an additional 48 hours. The color of the numbers below the graphs indicates the combination of drugs for each column. Viability was assessed by DiOC6/PI staining. The statistical significance of differences between the escalating doses of GAB1 inhibitor and GAB1 inhibitor plus ibrutinib was evaluated by 2-way analysis of variance with the Tukey test (both P < .001); the combination for individual columns was evaluated by paired Student t test (all P < .05). Ctrl, negative control treated only with equal volume of DMSO.](https://ash.silverchair-cdn.com/ash/content_public/journal/blood/138/9/10.1182_blood.2020008101/5/m_bloodbld2020008101f6.png?Expires=1767698527&Signature=jVXm4EztCHk5K5CFep-joNRtNrf~gL8jhLNtmM1D~DIONmQzF8YCeBe8OahWj3xlSnc51wDIGfzCYiJr3XqbaY6XZMDZ4DHdCE6BdmL8wiZsOFho1UlcO2yBubxeD70VOwF~uEbzt0poDMsySSob~fFXGoIwKJGIGSb4w5bofPGkghBhvJO5Hmn43TNyQqVx8Yvkt1UvavfLBuZL7~jNceeoD0svELZRsZI7hCydSBgTHQKwMm9Z2onomQeGT3nvStz~o~ouMJLlFp1fY-2y5VoSwk7s67fAUc7RMJ8uM269HZfeFWbB9-YrF9XghOPUsirMYH65ft~23Uy4OQYzpg__&Key-Pair-Id=APKAIE5G5CRDK6RD3PGA)
GAB1 inhibitors impair CLL migration and induce cell apoptosis, alone and in combination with ibrutinib. (A) Representative immunoblots from primary CLL cells treated for 6 hours with various doses (10, 25, and 50 µM) of 2 GAB1 inhibitors or with the same volume of vehicle (dimethyl sulfoxide [DMSO]) or with culture medium only (CTRL). This short-term treatment (6 hours) did not significantly impact cell viability (supplemental Figure 26). (B) The effect of various doses of GAB1 inhibitors on CLL cell viability after 48 hours (n = 5). The primary CLL cells were treated as described in panel A. (C) GAB1 inhibitor effect on primary CLL cell migration (n = 7). Cells were treated with inhGAB1-001 (25 µM) or inhGAB1-004 (25 µM) or ibrutinib (1 µM) or their combination for 12 hours. Cells were subsequently stained with CellTrace dye and loaded into a Transwell, and migration continued for 4 hours toward 50% CM (produced by HS5 stroma cells). (D-E) Effect of a GAB1 inhibitors on primary CLL cell migration (n = 6). Cells were pretreated, stained, and loaded into a Transwell as described in panel C. Cell migration continued for 6 hours toward SDF1 (100 ng/mL), CXCL13 (250 ng/mL), or 50% CM produced by HS5 cells or 100% CM produced by primary human bone marrow MSCs (CMhMSC). (F) Effect of GAB1 inhibitors (6 hours pretreatment; 25 µM) on calcium influx in primary CLL cells after SDF1 stimulation (100 µg/mL; arrow). Ionomycin (indicated by + ionom arrow) was added as a positive control. (G) Representative immunoblot from primary CLL cells treated with GAB1 inhibitors (inhGAB1-001 or inhGAB1-004; 25 µM) and stimulated with anti-IgM. Primary CLL cells were treated as described in panel A, and cells were divided into equal portions and exposed to vehicle (CTRL) or anti-IgM (10 µg/mL, 5 minutes). (Hi) Representative immunoblot of MEC1 cells pretreated with ibrutinib for 24 hours or 7 days and subsequently exposed to vehicle (DMSO) or GAB1 inhibitors for 6 hours (inhGAB1-001 or inhGAB1-004; 25 µM). (Hii) Statistical analysis of MEC1 cells' viability (n = 6). Cells were pretreated for 7 days with ibrutinib (1 µM; fresh ibrutinib added every 48 hours) or vehicle (DMSO; added every 48 hours), and subsequently exposed to GAB1 inhibitor (inhGAB1-001; 25 µM) for another 48 hours. (I-J) Effect of GAB1 inhibitors GAB1-001 (I) or GAB1-004 (J), alone or in combination with ibrutinib on the viability of primary CLL cells (n = 14). CLL cells were cultured in medium with IL4 (5 ng/mL) and simultaneously treated with ibrutinib (ibr; 1 µM) or vehicle (DMSO) for 6 days. Subsequently, the cells were treated with a combination of GAB1 inhibitors (2.5-50 µM) and ibrutinib (1 µM), vehicle (DMSO), ibrutinib alone (1 µM), or GAB1 inhibitor alone for an additional 48 hours. The color of the numbers below the graphs indicates the combination of drugs for each column. Viability was assessed by DiOC6/PI staining. The statistical significance of differences between the escalating doses of GAB1 inhibitor and GAB1 inhibitor plus ibrutinib was evaluated by 2-way analysis of variance with the Tukey test (both P < .001); the combination for individual columns was evaluated by paired Student t test (all P < .05). Ctrl, negative control treated only with equal volume of DMSO.
GAB1 inhibitors impair CLL migration and induce cell apoptosis, alone and in combination with ibrutinib. (A) Representative immunoblots from primary CLL cells treated for 6 hours with various doses (10, 25, and 50 µM) of 2 GAB1 inhibitors or with the same volume of vehicle (dimethyl sulfoxide [DMSO]) or with culture medium only (CTRL). This short-term treatment (6 hours) did not significantly impact cell viability (supplemental Figure 26). (B) The effect of various doses of GAB1 inhibitors on CLL cell viability after 48 hours (n = 5). The primary CLL cells were treated as described in panel A. (C) GAB1 inhibitor effect on primary CLL cell migration (n = 7). Cells were treated with inhGAB1-001 (25 µM) or inhGAB1-004 (25 µM) or ibrutinib (1 µM) or their combination for 12 hours. Cells were subsequently stained with CellTrace dye and loaded into a Transwell, and migration continued for 4 hours toward 50% CM (produced by HS5 stroma cells). (D-E) Effect of a GAB1 inhibitors on primary CLL cell migration (n = 6). Cells were pretreated, stained, and loaded into a Transwell as described in panel C. Cell migration continued for 6 hours toward SDF1 (100 ng/mL), CXCL13 (250 ng/mL), or 50% CM produced by HS5 cells or 100% CM produced by primary human bone marrow MSCs (CMhMSC). (F) Effect of GAB1 inhibitors (6 hours pretreatment; 25 µM) on calcium influx in primary CLL cells after SDF1 stimulation (100 µg/mL; arrow). Ionomycin (indicated by + ionom arrow) was added as a positive control. (G) Representative immunoblot from primary CLL cells treated with GAB1 inhibitors (inhGAB1-001 or inhGAB1-004; 25 µM) and stimulated with anti-IgM. Primary CLL cells were treated as described in panel A, and cells were divided into equal portions and exposed to vehicle (CTRL) or anti-IgM (10 µg/mL, 5 minutes). (Hi) Representative immunoblot of MEC1 cells pretreated with ibrutinib for 24 hours or 7 days and subsequently exposed to vehicle (DMSO) or GAB1 inhibitors for 6 hours (inhGAB1-001 or inhGAB1-004; 25 µM). (Hii) Statistical analysis of MEC1 cells' viability (n = 6). Cells were pretreated for 7 days with ibrutinib (1 µM; fresh ibrutinib added every 48 hours) or vehicle (DMSO; added every 48 hours), and subsequently exposed to GAB1 inhibitor (inhGAB1-001; 25 µM) for another 48 hours. (I-J) Effect of GAB1 inhibitors GAB1-001 (I) or GAB1-004 (J), alone or in combination with ibrutinib on the viability of primary CLL cells (n = 14). CLL cells were cultured in medium with IL4 (5 ng/mL) and simultaneously treated with ibrutinib (ibr; 1 µM) or vehicle (DMSO) for 6 days. Subsequently, the cells were treated with a combination of GAB1 inhibitors (2.5-50 µM) and ibrutinib (1 µM), vehicle (DMSO), ibrutinib alone (1 µM), or GAB1 inhibitor alone for an additional 48 hours. The color of the numbers below the graphs indicates the combination of drugs for each column. Viability was assessed by DiOC6/PI staining. The statistical significance of differences between the escalating doses of GAB1 inhibitor and GAB1 inhibitor plus ibrutinib was evaluated by 2-way analysis of variance with the Tukey test (both P < .001); the combination for individual columns was evaluated by paired Student t test (all P < .05). Ctrl, negative control treated only with equal volume of DMSO.
Discussion
In this study, FoxO1 transcriptionally induced GAB1 in CLL cells, which increased their homing capacity by influencing chemokine responsiveness and F-actin polymerization. FoxO1-induced GAB1 also increased the basal/tonic AKT activity, which is underscored in the context of ibrutinib therapy. Ibrutinib leads to FoxO1-GAB1 axis induction and adaptive restoration of AKT phosphorylation. We have demonstrated that GAB1 can be targeted therapeutically by novel GAB1 inhibitors, alone or in combination with BTK inhibition.
It has been hypothesized that CLL cell recirculation can be studied by analyzing CXCR4/CD5 intraclonal CLL subpopulations, given that CXCR4brightCD5dim cells should be more responsive to SDF1 because of higher CXCR4 levels.1-7 Indeed, the CXCR4brightCD5dim subpopulation showed a significantly higher tendency to migrate into the spleen from the peripheral blood of NSG mice than did CXCR4dimCD5bright cells and, in vitro, toward chemokines. We have previously analyzed CXCR4dimCD5bright cells to understand the pathways activated in the microenvironment.2,3,7,59 In the current study, we hypothesized that analyzing the “resting” nonproliferative CXCR4brightCD5dim cells could help to understand the factors influencing their return to immune niches. RNA sequencing identified 147 genes differentially expressed in CXCR4/CD5 subpopulations and annotated in databases as migration related. We further demonstrated that one of the genes upregulated in CXCR4brightCD5dim cells (namely, GAB1) is a regulator of CLL cell migration. The genetic ablation of GAB1 in malignant MEC1 cells largely inhibited their migration capacity toward SDF1, CXCL13, or CM produced by bone marrow stromal cells, and a similar result was obtained with siRNA against GAB1 in primary CLL cells. This inhibitory action was confirmed by an in vivo competitive migration assay in mice, showing that GAB1 KO or GAB1 downmodulation by siRNA leads to impaired migration of malignant B cells to the spleen. This result is in line with data from muscle progenitor cells,32 where genetic ablation of either GAB1 or CXCR4 leads to highly similar (but not identical) defects in migration to specific tissue locations, suggesting that GAB1 has a nonredundant role in the CXCR4 pathway, but also in other cell-migration mechanisms. In line with this notion, we observed that cytokines produced by cells in immune niches, including CXCR4 ligand SDF1 and CXCR5 ligand CXCL13, induced GAB1 phosphorylation within minutes, and GAB1 positively regulated F-actin polymerization and cell migration in response to chemokines. This effect could be functionally linked to GAB1’s acting as a cell-membrane–docking site for multiple proteins involved in migration such as PI3K,34,60 ERK,36 PLCγ, Crk, or CrkL proteins.61 Indeed, we have observed that GAB1 positively affects the activity of PI3K, a known regulator of F-actin polymerization, and CLL/T lymphocyte migration.60,62,63 Altogether, the data show that GAB1 accumulation in CLL cells increases their homing capacity by influencing responsiveness to chemokines and integrating signals, resulting in actin reorganization.
We further studied the mechanism that leads to GAB1 accumulation in CXCR4brightCD5dim cells, showing that the transcription factor FoxO1 accumulates in these cells and transcriptionally activates GAB1. It is known that AKT activity negatively regulates FoxO1 by mediating inhibitory FoxO1S256 phosphorylation, resulting in its subsequent translocation from the nucleus to the cytoplasm and degradation.64,65 Indeed, a strong AKT phosphorylation induction in CLL cells after adhesion or BCR activation leads to FoxO1 degradation and concurrent GAB1 downmodulation. We also tested whether miR-150, a known regulator of GAB1, affects GAB1 levels, but we did not find anticorrelation of the miR-150 levels with GAB1 levels in CXCR4/CD5 subpopulations (supplemental Figure 29), suggesting that posttranscriptional regulation by miR-150 is not relevant in this context, but more likely contributes to the interpatient differences, as proposed previously.35 Altogether, the data indicate that FoxO1 upregulation in the CXCR4brightCD5dim CLL subpopulation is permitted by relatively low-level AKT activity (related to the absence of BCR/adhesion–mediated signals) and leads to transcriptional GAB1 activation and supports cell homing back to “signal-rich” niches. Similar to GAB1 KO, FoxO1’s genetic ablation or its silencing by siRNA also resulted in decreased B-cell migration capacity. FoxO1’s role in influencing genes involved in cell migration corresponds to observations describing its involvement in dendritic cell homing,66 T-cell homing,49 and normal B-cell migration within the germinal centers.50,51 In our data, several migration-related genes (such as ITGB2, PIK3CA, NF1, ETS1, ST14, LRRK2, and APBB2), which are putative FoxO1 targets, were differentially expressed in CXCR4/CD5 subpopulations. This finding suggests that FoxO1 contributes to regulating CLL migration by inducing GAB1 and other genes. Notably, the Fox family has been suggested to be one of the 3 transcription factors responsible for CLL cell identity.53 In addition, FoxO1 is known to be aberrantly transcriptionally active in B-cell lymphomas52 and to be activated by mutations in some cases.67
We also identified another GAB1 function by describing its role in increasing the so-called tonic PI3K/AKT signaling by affecting the phosphorylation of the PI3K subunit p85 and AKTS473. It has been shown that GAB1 contains multiple binding sites for SH2 domain-containing proteins33 and has a crucial role in PI3K docking to the B-cell membrane connecting BCR-activation with AKT phosphorylation.34 However, the role of GAB1 in tonic AKT activity was not anticipated. It is known that normal B cells depend on constant tonic signaling to maintain their basal PI3K/AKT for their survival25 ; however, the proteins that mediate this tonic signaling remain poorly understood. Constitutive PI3K activity was observed in most peripheral blood CLL samples.24,26-28 Our data show that upregulated GAB1 in CXCR4brightCD5dim CLL cells in peripheral blood contributes to their higher migration capacity and also supports tonic PI3K/AKT activity, which may help to explain the previously noted association of higher GAB1 levels with unfavorable prognosis in CLL.35 The data suggest an interdependent balance of AKT activity and the FoxO1-GAB1 axis, which maintains tonic pAKT above a certain minimal level in CLL cells that do not have access to microenvironmental interactions. This balance is important during ibrutinib therapy, because CLL cells induce the FoxO1-GAB1-pAKT axis and thus partially compensate for the lack of microenvironmental interactions that normally strongly induce pAKT levels. FoxO1’s role in maintaining tonic pAKTS473 levels is surprising, given that FoxO1 activity was shown to be mutually exclusive with PI3K activity, and FoxO1 was shown to inhibit B-cell proliferation by inducing genes such as p27.68 However, we have shown that moderate pAKT activity is not mutually exclusive with FoxO1 nuclear localization in CLL. This finding is in line with data from some B-cell lymphomas that tend to gain an oncogenic constitutive FoxO1 nuclear activity to circumvent negative feedback regulation by strong pAKT activity.52 It is plausible that in the nonproliferative CXCR4brightCD5dim subpopulation, FoxO1 induces genes involved in cell cycle arrest (indeed, these cells have higher p27 levels), but also upregulates GAB1 to increase homing of CLL cells and sustain their survival by maintaining tonic pAKT levels.
We have further shown that an inhibitor targeting GAB1 PH domain suppresses BCR-induced and tonic AKT phosphorylation during ibrutinib treatment, and GAB1 inhibition combined with ibrutinib increases cell killing in vitro. Moreover, GAB1 inhibitors also impaired ERK phosphorylation, which is in line with GAB1’s role in ERK activation.36,69 In addition, GAB1 inhibitors impaired CLL cell migration to an extent similar to ibrutinib. GAB1 may represent a promising therapeutic target the inhibition of which may have a different toxicity profile compared with those of PI3K inhibitors or the CXCR4 agonists such as plerixafor. However, development of this inhibitory therapy will require more potent and selective GAB1 PH-domain inhibitor(s) because their effect on CLL migration and viability was observed only at higher concentrations. It is likely that the tested inhibitors also have off-target effects by inhibiting other PH-domain–containing proteins.43 We have, for example, noted that these GAB1 inhibitors have an effect on cell migration similar to that of GAB1 silencing or KO, but a stronger impact on cell viability. This similarity could be caused by incomplete GAB1 silencing by siRNA or selection of single-cell clones tolerating GAB1 KO during its genomic editing, but could also be caused by the off-target effects of the inhibitors.
In summary, we have described a novel FoxO1/GAB1-dependent regulatory mechanism of CLL homing and maintenance mechanism for tonic AKT signaling (summarized in Figure 7). We have shown that during ibrutinib therapy, CLL cells sustain AKT activity via the FoxO1-GAB1 axis and this can be therapeutically targeted with novel GAB1 inhibitors.

GAB1 regulation by FoxO1 and its role in CLL migration and tonic AKT activity: novel therapeutic target. GAB1 is upregulated by FoxO1 during the transition of intraclonal CLL cell subpopulation from CXCR4dimCD5bright into CXCR4brightCD5dim cells. This increases homing capacity of CXCR4brightCD5dim cells and also sustains prosurvival tonic AKT activity. During microenvironmental interactions (reflected in CXCR4dimCD5bright cells) GAB1 is involved in signaling from BCR and other cell surface receptors, and subsequent AKT activation represses GAB1 transcription via FoxO1. GAB1 inhibitors impair cell migration, inhibit tonic or BCR-induced AKT phosphorylation, and block compensatory AKT activity during ibrutinib therapy.
GAB1 regulation by FoxO1 and its role in CLL migration and tonic AKT activity: novel therapeutic target. GAB1 is upregulated by FoxO1 during the transition of intraclonal CLL cell subpopulation from CXCR4dimCD5bright into CXCR4brightCD5dim cells. This increases homing capacity of CXCR4brightCD5dim cells and also sustains prosurvival tonic AKT activity. During microenvironmental interactions (reflected in CXCR4dimCD5bright cells) GAB1 is involved in signaling from BCR and other cell surface receptors, and subsequent AKT activation represses GAB1 transcription via FoxO1. GAB1 inhibitors impair cell migration, inhibit tonic or BCR-induced AKT phosphorylation, and block compensatory AKT activity during ibrutinib therapy.
Acknowledgments
The authors thank Zuzana Smrckova (University of Technology, Brno, Czech Republic) for help with cell motility assays.
This work was supported by the Czech Science Foundation (project no. 20-02566S). This project has received funding from the European Research Council (ERC) under the European Union’s Horizon 2020 Research and Innovation Programme (grant agreement no. 802644). This work was supported by the Ministry of Health of the Czech Republic, grant no. NU20-03-00292. All rights reserved. This work was also supported by MH CZ-DRO (FNBr, 65269705) and MUNI/A/1595/2020. The authors acknowledge the CF Genomics CEITEC MU supported by the National Center for Medical Genomics (NCMG) research infrastructure (LM22018132 funded by MEYS CR) and Core Facility Bioinformatics of CEITEC MU for their support in processing the data. This work was supported by the MEYS CR (Large RI Project LM2018129 Czech-BioImaging).
Authorship
Contribution: V.S. designed the study, performed experiments, analyzed the data, and wrote the article; L.O., L. Kostalova, K.M.L., E.V., J.V., and S.S. performed experiments; G.M.P., K.A.C., and V.B. performed the NGS experiments; J.O. analyzed the NGS data; D.Z. performed the holographic microscopy for the cell migration; T.L. and M.B. performed the cell sorting; M.K.P. and J.K. performed the fluorescence microscopy; K.L. and L. Kren performed the immunohistology; Z.T. and S.Z. provided and discussed the use of GAB1 inhibitors; S.P., Y.B., M.D., A.P., and J.M. provided samples and clinical data; M.M. designed the study, interpreted the data, and wrote the article; and all authors edited and approved the article for submission.
Conflict-of-interest disclosure: The authors declare no competing financial interests.
Correspondence: Marek Mraz, Central European Institute of Technology, Masaryk University, Kamenice 5, 625 00 Brno, Czech Republic; e-mail: marek.mraz@email.cz.
The results of the RNAseq analysis and data deposition may be found in a data supplement available with the online version of this article.
The online version of this article contains a data supplement.
The publication costs of this article were defrayed in part by page charge payment. Therefore, and solely to indicate this fact, this article is hereby marked “advertisement” in accordance with 18 USC section 1734.
