

Key Points
Leukemia cells interact with MSCs, reprogram their transcriptome toward pro-oncogenic features, and reroute the BM niche.
MSC targeting by calcium channel blockers synergizes with chemotherapy agents in a 3D-AML model.

Abstract
Bone marrow (BM) microenvironment contributes to the regulation of normal hematopoiesis through a finely tuned balance of self-renewal and differentiation processes, cell–cell interaction, and secretion of cytokines that during leukemogenesis are altered and favor tumor cell growth. In pediatric acute myeloid leukemia (AML), chemotherapy is the standard of care, but >30% of patients still relapse. The need to accelerate the evaluation of innovative medicines prompted us to investigate the role of mesenchymal stromal cells (MSCs) in the leukemic niche to define its contribution to the mechanism of leukemia drug escape. We generated a humanized 3-dimensional (3D) niche with AML cells and MSCs derived from either patients (AML-MSCs) or healthy donors. We observed that AML cells establish physical connections with MSCs, mediating a reprogrammed transcriptome inducing aberrant cell proliferation and differentiation and severely compromising their immunomodulatory capability. We confirmed that AML cells modulate h-MSCs transcriptional profile promoting functions similar to the AML-MSCs when cocultured in vitro, thus facilitating leukemia progression. Conversely, MSCs derived from BM of patients at time of disease remission showed recovered healthy features at transcriptional and functional levels, including the secretome. We proved that AML blasts alter MSCs activities in the BM niche, favoring disease development and progression. We discovered that a novel AML-MSC selective CaV1.2 channel blocker drug, lercanidipine, is able to impair leukemia progression in 3D both in vitro and when implanted in vivo if used in combination with chemotherapy, supporting the hypothesis that synergistic effects can be obtained by dual targeting approaches.
Introduction
The bone marrow (BM) niche is an heterogeneous compartment where different nonhematopoietic cell types, including stromal cells and subsets of cells with diverse function and gene signatures, contribute to hematopoietic stem cell (HSC) regulation.1 Microenvironment contributes to hematopoiesis, finely regulating the balance of self-renewal and differentiation signals, cell–cell interaction, and paracrine secretion of cytokines.2 Once malignant events occur, the BM niche shows cellular and molecular abnormalities influencing disease emergence and progression3,4 ; in particular, mesenchymal stromal cells (MSCs) have been suggested to play a major pathogenic role in a variety of hematologic malignancies.5-7 However, there are several discrepancies among existing data on the role of MSCs isolated from patients with acute myeloid leukemia (AML) as an essential niche element during both, leukemogenesis and chemotherapy response.8,9 The role played by MSCs on the mechanisms influencing leukemia clearance during therapy is of potential crucial importance in the context of novel treatment opportunities that could be prospectively evaluated in childhood leukemia trials.10 Several hurdles are severely limiting the implementation of new oncology drugs for children11 : the weakness of preclinical results, most of them being obtained in ex vivo cultures outside the leukemia context, is recognized as the main cause of the massive failure of novel treatments entering oncologic pediatric market authorization.12 Previously, strategies oriented to block AML self-renewal and prosurvival pathways promoted by the niche components,13,14 to affect AML homing and adhesion properties,14-16 or to target the hypoxic milieu of leukemic environment17,18 have been explored, with few and conflicting results showing that using a dual targeting approach might increase treatment efficacy.19 Furthermore, severe off-target effects on other pathways and cell components of the niche were observed, suggesting that 2-dimensional (2D) preclinical in vitro and current in vivo models were not able to robustly replicate important aspects of the BM microenvironment.20-23
In the current scenario, we positioned an innovative 3-dimensional (3D) culture model that allowed long-term AML coculture with MSCs derived from either BM of leukemia patients obtained at time of diagnosis and remission or from age-matched healthy donors. This model is able to recapitulate the features of leukemia niche proliferation, differentiation, immunomodulation, and secretome. We provide evidence supporting the concept that AML-derived MSCs, after contact with AML cells, reprogram their transcriptome toward novel additional pro-oncogenic activities. Our data also indicate that lercanidipine, a selective CaV1.2 channel blocker drug, is useful for targeting AML-MSCs, synergizing with the effects displayed by cytotoxic drugs.
Methods
Isolation and culture of MSCs
MSCs were derived from BM mononuclear cells collected from patients at diagnosis (namely, AML-MSCs), at time of morphologic remission (R-MSCs) and from age-matched healthy donors who were siblings of patients and donated HSCs for an allograft (h-MSCs). MSCs were obtained between passages 2 and 5 as described in supplemental Methods, available on the Blood Web site.
3D culture system setup
The 3D model, created by Institute of Science and Technology for Ceramics–National Research Council, consists of a biomimetic scaffold capable of mimicking bone extracellular matrix and is composed of 70 wt% hydroxyapatite/30 wt% collagen type I cross-linked with 2 wt% 1,4-butanediol diglycidyl ether, of 2 mm in height and diameter. Scaffolds were seeded with primary MSCs and AML cells. Cell imaging in the 3D culture was conducted by Zeiss 800 Confocal (Zeiss) and Thorlabs Multiphoton (Thorlabs). All procedures are described in supplemental Methods.
Human umbilical vein endothelial cell tube formation assay
h-MSCs, AML-MSCs, and R-MSCs were cultured for 24 hours with a cocktail of cytokines (to stimulate their immunomodulatory action), and their medium was collected and used to culture human umbilical vein endothelial cells (HUVECs) known to form tubes in vitro. The number of tubes was counted after 4 hours by a phase contrast inverted microscope at ×4 and ×10 objective magnifications, and analysis was performed with the ImageJ Angiogenesis Analyzer plugin24,25 (see supplemental Methods for additional details).
Lymphocyte proliferation assay
peripheral blood mononuclear cells (PBMCs) (2.5 × 10⁵) were seeded in 24-well plates in RPMI medium supplemented with 20% fetal bovine serum (Thermo Fisher Scientific), 2 mM glutamine, 100 U/mL penicillin/streptomycin (Gibco/Life Technologies), and 10 μg/mL phytohemagglutinin (PHA) in the presence of h-, AML-, or R-MSCs (ratio of MSCs:PBMCs = 1:4) for 3 days before analysis (see supplemental Methods).
Bio-Plex cytokines array
Bio-Plex Pro HumanCytokine (17-and 37-) Plex Assays (Bio-Rad Laboratories) were used after 7 days of AML-MSC or h-MSC coculture with or without AML cells in the 3D model.
High-throughput screening pipeline and cell treatment
For high-throughput screening, 480 pharmacologically active compounds of the Library of Pharmacologically Active Compounds (Sigma-Aldrich/Merck) were screened in triplicate on AML-MSCs at 10 μM concentration and used as described in supplemental Methods.
Measurements of intracellular Ca2+
MSCs were seeded on chamber slides (Corning Life Sciences) for 24 hours at 37°C and treated with 10 µM lercanidipine for 48 hours. Then, intracellular Ca2+ levels were monitored using Fluo-4 AM (Thermo Fisher Scientific) as described in supplemental Methods.
In vitro 3D-AML treatments
AML-MSCs were seeded in the scaffold and cultured in StemMACS MSC expansion media (Miltenyi Biotec) for MSC expansion for 1 week as described above. Then, primary AML cells were added to the scaffold and exposed to chemo-targeted drugs quizartinib (0.2 µM; Selleckchem), I-BET151 (0.5 µM; Sigma-Aldrich/Merck), Ara-C (0.01 µM; Sigma-Aldrich/Merck), venetoclax (0.005 µM; Sigma-Aldrich/Merck), and dasatinib (6 µM, Selleckchem) alone or in combination with lercanidipine (15 µM; Sigma-Aldrich/Merck) in cytokine-supplemented media for AML expansion. Proliferation of the whole 3D system was evaluated by measuring ATP level after 3 days of treatment by CellTiter-Glo 3D reagent (Promega). The colony-forming unit replating assay was performed with AML cells isolated from the treated 3D culture (see "Colony-forming unit replating assay" in the supplemental Methods).
3D-AML in vivo model
Primary AML samples were depleted of CD3+ T lymphocytes by immune-magnetic cell separation (Miltenyi Biotec) using CD3 MicroBead Kit (Miltenyi Biotec). Scaffolds were soaked in culture medium for 24 hours and then transferred onto a polystyrene ultra-low attachment 24-well plate (Corning Life Sciences), where 0.4 × 10⁶ AML-MSCs were seeded using a syringe, and StemMACS MSC expansion media (Miltenyi Biotec) was added after 3 hours at 37°C. Twenty-four hours later, 1 × 10⁶ AML cells or CD3-depleted primary AML cells were seeded using a syringe on each MSCs-coated scaffold after medium removal; fresh proper culture medium was added 1 hour after seeding. After 24 hours, scaffolds were implanted subcutaneously in the back of previously conditioned (1.5 Gy radiotherapy) NSG mice (NSG NOD.Cg-Prkdcscid Il2rgtm1Wjl/SzJ strain). Mice were daily treated 5 days/wk with venetoclax 100 mg/kg (oral gavage), Ara-C 12.5 or 50 mg/kg (interperitoneally), 5-azacytidine 5 mg/kg (interperitoneally), or I-BET151 30 mg/kg (interperitoneally), whereas lercanidipine (3 mg/kg, interperitoneally) was administered once every 3 days (control vehicle mice were treated with dimethyl sulfoxide [DMSO]). Details on statistical analysis are reported in the supplemental Methods.
Results
AML-MSCs characterization in a 3D model
We set up an onco-niche using a 3D biomimetic scaffold made of hydroxyapatite/collagen (70/30%)26 for culturing AML primary blasts collected from children at time of diagnosis,27 together with MSCs isolated from the same sample (AML-MSCs; supplemental Table 1). MSCs were characterized as per guidelines of the Internal Society for Cellular Therapy (supplemental Figure 1A). AML-MSCs seeded in the scaffold from days 7 to 21 grew along the inner surfaces of bone trabecular pores and formed a stable fibrous 3D structure. On scanning electron microscopy, cells were tightly attached to the surface of trabecular bone (supplemental Figure 1Ba-b), exhibiting cytoplasmic extensions (supplemental Figure 1Bc). This cell elongation guaranteed the connection between cells and the scaffold, suggesting good cyto-compatibility and a high level of interaction. Then, we seeded primary AML cells (7 days after MSC seeding; Figure 1A), confirming blast–stroma interaction (supplemental Figure 1Bd), distribution (supplemental Figure 1C-D), and proliferation up to 21 days (Figure 1B; supplemental Figure 1E) favored by the presence of MSCs in 3D. We then explored 3 different cell–stroma culture conditions: (1) AML-MSCs; (2) a mixture of AML-MSCs and MSC-derived osteoblasts (OBs); and (3) a mixture of AML-MSCs and HUVEC endothelial cells. In detail, we assessed the supportive effects of AML-MSC and AML-MSC + OB coculture systems on AML cell proliferation (supplemental Figure 1F-G), whereas HUVECs engulfed the system reducing AML cell growth (supplemental Figure 1H). Thus, we investigated the AML-MSC 3D model’s ability to preserve the characteristic of the original patient AML cells, confirming their preserved clonogenic ability (supplemental Figure 1I) and the AML immune phenotype as of the original AML diagnosis after 21 days (supplemental Figure 1J). To establish how AML cells and MSCs communicate with each other, we observed that in the first 3 hours after seeding, AML cells entered in contact with MSCs and changed their morphologic features, becoming stretched (supplemental Movie 1) and creating a physical contact by membrane nanotubes (Figure 1C; supplemental Movie 2). We observed primary AML cells and AML-MSCs forming connexin-43 (CX43)-based gap junctions at first sight, with cytoplasmic delivery of calcein molecules (Figure 1D-E). This latter cell–cell interaction28 prompted us to investigate whether MSCs underwent biological modifications; for this purpose, we performed gene expression profile (GEP) of 21 AML-MSCs and of 6 h-MSCs. Results showed high similarity among all the AML-MSCs and a high number of significantly differentially expressed genes with respect to the h-MSCs (n = 608: 331 upregulated and 277 downregulated; supplemental Figure 2A; supplemental Table 2). By gene set enrichment analysis, we found AML-MSCs had an increased expression of genes involved in chemokine production, inflammatory response, and cell proliferation pathways (Figure 2A; supplemental Table 3). The association protein network analysis (STRING) revealed that interleukin 6 (IL-6) was a super-hub gene (supplemental Figure 2B), as confirmed by IL-6 protein expression measured in the AML-MSCs medium from 2D cell culture with respect to h-MSCs (supplemental Figure 2C). Altogether, these data suggest that the AML-MSCs transcriptome was reprogrammed with respect to h-MSCs. Indeed, we examined the GEP displayed by h-MSCs alone and after having been cocultured with either primary AML cells for 4 days (namely, induced AML-MSCs [iAML-MSCs], n = 19) or with CD34+ cells as control (i34+-MSCs, n = 3). Unsupervised analysis showed that iAML-MSCs significantly changed GEP with respect to h-MSCs and differently from i34+-MSCs (Figure 2B; supplemental Table 4; supplemental Figure 2D). To improve the specificity of genes typical of the iAML-MSCs, we deleted those genes found to be differentially expressed in the i34+-MSCs (false discovery rate <0.1; supplemental Table 5), and identified the matched genes between AML- and iAML-MSCs (22 down- and 29 upregulated; supplemental Figure 2E; supplemental Table 6). We confirmed their average expression being similar between AML- and iAML-MSCs (Figure 2C) and being involved in inflammation processes and cytokines production pathways (Figure 2D; supplemental Table 7). By performing analysis of variance across groups, we identified significant genes (false discovery rate <0.05) and selected the common top up- and downregulated genes revealing a significant gene expression behavior correlated to AML (supplemental Figure 2F; supplemental Table 8). This latter finding provides evidence that h-MSCs resident in the BM niche change their transcriptome at leukemia onset once entered in contact with blasts. To corroborate these data, we silenced CX43 (GJA1 gene) both in h-MSCs and AML blasts (SirCX43iAML-MSCs). We documented that, after silencing, calcein diffusion from AML blast cytoplasm to MSCs was severely abrogated, thus supporting the observation that cells were impaired in transferring cytoplasmic components (supplemental Figure 3A). Furthermore, we analyzed the gene expression profile of CX43-silenced cells, finding that, when AML-MSCs were silenced, they aberrantly expressed 200 genes. Among them, we investigated the 82 downregulated genes by gene ontology (GO) analysis (supplemental Table 9), finding that they are involved in immune response, inflammation/cytokine regulation, and angiogenesis (supplemental Figure 3B). These genes were previously found positively enriched in the AML-MSC transcriptome (supplemental Table 3). These results suggest that CX43-mediated contact is involved in the AML-MSCs transcriptional profile reprogramming occurring into the 3D model. In light of all this reprogramming, we hypothesized that AML-MSCs might acquire new functions. To address this hypothesis, we investigated MSCs function in vitro. We assessed the 3-lineage differentiation potential of AML-MSCs by measuring basal lineage-related gene expression and MSC differentiation on proper induction media. h- and AML-MSCs did not express adipogenic-related genes and showed a similar adipogenic differentiation potential (supplemental Figure 4A). By contrast, chondrogenic-related genes and differentiation potential were found to be significantly reduced in AML-MSCs (supplemental Figure 4B). In addition, AML-MSCs were found to overexpress genes of the osteoblast lineage (supplemental Figure 4C), with osteoblast commitment occurring earlier, from day 7, with respect to h-MSCs that differentiated at day 21 (Figure 3A). The same results were confirmed in the 3D model by the documented altered expression of osteo-related genes (supplemental Figure 4D). Then, we investigated the h- and AML-MSCs immunomodulatory action. First, we stimulated h- and AML-MSCs with proinflammatory cytokines to activate their anti-inflammatory potential for 24 hours and then used their conditioned medium to grow endothelial cells (HUVECs) and counted tube formation after 4 hours. Results showed that h-MSCs reduced tubes, whereas AML-MSCs did not, suggesting a lower anti-inflammatory potential of the latter, which reflects antiangiogenic ability (Figure 3B). Additionally, we cocultured MSCs with PHA-stimulated T cells, confirming that h-MSCs significantly reduced T-cell activation with respect to AML-MSCs (Figure 3C), supporting niche inflammation status. We also observed that AML-MSCs proliferated significantly more than h-MSCs (Figure 3D; supplemental Figure 5-C). Furthermore, when we measured MSC telomere length, we found that AML-MSCs displayed significantly longer telomeres than h-MSCs (5.2 ± 0.562 and 2.8 ± 0.311 kbp, respectively; Figure 3E). We observed that AML-MSCs contributed to maintain stemness features of CD34+ purified healthy cells when cocultured for 10 days by maintaining low CD33 expression and a higher clonogenic potential documented after serial replating (Figure 3F-I). In line with these findings, AML-MSCs displayed a differential modulation of OPN (supplemental Figure 4C), ANGPT1, MMP9, and CXCL12 niche-related gene expression (supplemental Figure 5D). Furthermore, AML-MSCs supported the growth of the hematopoietic precursors 32D cell line in a cytokine-independent condition (Figure 3J), suggesting an AML-MSC novel acquired transforming ability. In addition, same properties arose in iAML-MSCs supporting their reprogramming toward AML-MSCs (supplemental Figure 5E-G). In the same context, by blocking MSC and blast contact by CX43 RNA silencing or specific drugs, such as gap junction blocker carbenoxolone or the CX43-mimetic peptide Gap27, we prevented achievement of these aberrant functions (supplemental Figure 5H-L; supplemental Table 9). In parallel, we wanted to exclude that oncogenic insults may arise in MSCs, and we therefore screened several AML-MSCs for the molecular abnormalities found in the AML at diagnosis by reverse transcriptase-polymerase chain reaction without finding any of the molecular/cytogenetic marker identified in leukemia blast cells (supplemental Table 10). Additionally, we tested AML-MSCs for their molecular karyotype by array comparative genomic hybridization and G-band, confirming that AML-MSCs have a normal karyotype and do not show any AML-related alterations (supplemental Table 10). We conclude that AML cells endow MSCs with different pro-oncogenic functions.
![AML-MSCs characterization in 3D model. (A) Scheme of the in vitro 3D culture procedure. Hydroxyapatite/collagen scaffolds were seeded with stromal cells and cultured for 7 days before the addition of primary AML cells (t = 0). Differential analysis was conducted at days 7, 14, and 21. (B) Representative z projections of AML-MSCs and primary AML cells cocultured in a 3D scaffold at different time points stained with Hoechst (blue), Calcein-AM (green), and ECD-CD45 (red). The z projection is the sum of intensity fluorescence of 100 µm z stack, ×20 magnification; scale bar, 100 µm. Graph shows the ratio AML cells per volume in the 3D scaffold, which is representative of AML cell viability, in the presence of stromal cells (+AML-MSCs) or not (stroma free [SF]), at different time points (n = 4). (C) Representative image of heterotypic nanotubes (arrowheads) that interconnected leukemia cells (red) and AML-MSCs (green) during coculture in 2D (left) and 3D (right). The gray signal in 3D corresponds to the second harmonic generation from collagen and hydroxyapatite of the scaffold. AML cells membrane were labeled with Vybrant-DiI directly before seeding. Wider area is reported in supplemental Movie 2. Scale bar, 20 µm; n = 3. (D) Calcein-AM dye transfer assay showing that calcein-AM dye (green) was transferred to contacting AML cells in 2D coculture, whereas it was absent in distant AML cells (red); n = 3; scale bar, 20 µm. (E) Immunofluorescence staining of AML cells contacting MSCs (red) in 2D coculture. Contact area between arrowheads showed enrichment in CX43 Alexa 488 signal (green); scale bar, 20 µm. The graph shows the corresponding fluorescence intensity profile. **P < .01, ***P < .001, ****P < .0001.](https://ash.silverchair-cdn.com/ash/content_public/journal/blood/138/7/10.1182_blood.2020009845/6/m_bloodbld2020009845f1.png?Expires=1767709031&Signature=PeOkzcIpK-pHsGVfydLlnxTiwvghbKrLWPakiDpxZnhENXUZXGINnHnl7CC7P4Y1YwKRk07H0v9l~sze2UYeTIGUjNQfJG6hUe2Qr83HSVgvp3FoR~VLkEpi5dqKqr72Y7sLYT5uys3QrGYU4hl4Gr6GSolkS-Z6rK7Pv4SUYAQu8kRh9FKA0KjkS5Q~t8EgaqB7dvXzgVF0bR2LR8KOW2SzpcwMwEAC5JNKX9221e5weOTiKFSj0rM72qqQfPrD1Su81KJZEPpaCxfaV64OFNoxvPfCvENgd-jLxuVkxSGAXdcUPv397JKSwDxoQAam~X318KdJdJj0MgLOQjib3w__&Key-Pair-Id=APKAIE5G5CRDK6RD3PGA)
AML-MSCs characterization in 3D model. (A) Scheme of the in vitro 3D culture procedure. Hydroxyapatite/collagen scaffolds were seeded with stromal cells and cultured for 7 days before the addition of primary AML cells (t = 0). Differential analysis was conducted at days 7, 14, and 21. (B) Representative z projections of AML-MSCs and primary AML cells cocultured in a 3D scaffold at different time points stained with Hoechst (blue), Calcein-AM (green), and ECD-CD45 (red). The z projection is the sum of intensity fluorescence of 100 µm z stack, ×20 magnification; scale bar, 100 µm. Graph shows the ratio AML cells per volume in the 3D scaffold, which is representative of AML cell viability, in the presence of stromal cells (+AML-MSCs) or not (stroma free [SF]), at different time points (n = 4). (C) Representative image of heterotypic nanotubes (arrowheads) that interconnected leukemia cells (red) and AML-MSCs (green) during coculture in 2D (left) and 3D (right). The gray signal in 3D corresponds to the second harmonic generation from collagen and hydroxyapatite of the scaffold. AML cells membrane were labeled with Vybrant-DiI directly before seeding. Wider area is reported in supplemental Movie 2. Scale bar, 20 µm; n = 3. (D) Calcein-AM dye transfer assay showing that calcein-AM dye (green) was transferred to contacting AML cells in 2D coculture, whereas it was absent in distant AML cells (red); n = 3; scale bar, 20 µm. (E) Immunofluorescence staining of AML cells contacting MSCs (red) in 2D coculture. Contact area between arrowheads showed enrichment in CX43 Alexa 488 signal (green); scale bar, 20 µm. The graph shows the corresponding fluorescence intensity profile. **P < .01, ***P < .001, ****P < .0001.
AML-MSCs characterization in 3D model. (A) Scheme of the in vitro 3D culture procedure. Hydroxyapatite/collagen scaffolds were seeded with stromal cells and cultured for 7 days before the addition of primary AML cells (t = 0). Differential analysis was conducted at days 7, 14, and 21. (B) Representative z projections of AML-MSCs and primary AML cells cocultured in a 3D scaffold at different time points stained with Hoechst (blue), Calcein-AM (green), and ECD-CD45 (red). The z projection is the sum of intensity fluorescence of 100 µm z stack, ×20 magnification; scale bar, 100 µm. Graph shows the ratio AML cells per volume in the 3D scaffold, which is representative of AML cell viability, in the presence of stromal cells (+AML-MSCs) or not (stroma free [SF]), at different time points (n = 4). (C) Representative image of heterotypic nanotubes (arrowheads) that interconnected leukemia cells (red) and AML-MSCs (green) during coculture in 2D (left) and 3D (right). The gray signal in 3D corresponds to the second harmonic generation from collagen and hydroxyapatite of the scaffold. AML cells membrane were labeled with Vybrant-DiI directly before seeding. Wider area is reported in supplemental Movie 2. Scale bar, 20 µm; n = 3. (D) Calcein-AM dye transfer assay showing that calcein-AM dye (green) was transferred to contacting AML cells in 2D coculture, whereas it was absent in distant AML cells (red); n = 3; scale bar, 20 µm. (E) Immunofluorescence staining of AML cells contacting MSCs (red) in 2D coculture. Contact area between arrowheads showed enrichment in CX43 Alexa 488 signal (green); scale bar, 20 µm. The graph shows the corresponding fluorescence intensity profile. **P < .01, ***P < .001, ****P < .0001.
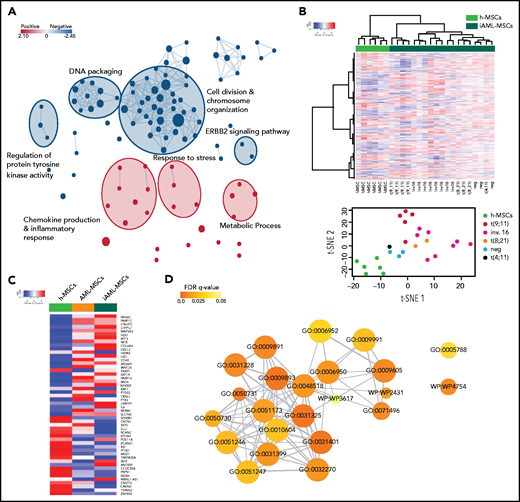
MSC gene expression profile. (A) Subnetworks of the main enrichment map from c5 biological process gene set enrichment analysis results. Red and blue nodes represent the up- and downregulated gene sets in AML-MSCs, respectively. (B) Unsupervised hierarchical clustering of transcriptional profile of h-MSCs (green, n = 6) or h-MSCs when cocultured with AML cells for 4 days (iAML-MSCs, dark green, n = 19). t-distributed stochastic neighbor embedding (t-SNE) showed the distribution of h-MSCs and iAML-MSCs, with specification of the genetics referred to AML cells cocultured with h-MSCs. (C) Heatmap showing the average expression level of the 51 common genes between AML-MSCs and iAML-MSCs with respect to h-MSCs. (D) Gene ontology involving the 51 common genes between AML-MSCs and iAML-MSCs with respect to h-MSCs. Codes inside the circles are the GO number representing the gene ontology category (supplemental Table 7). Color scale indicates FDR q value (0-0.05), whereas circle dimension indicates the number of genes belonging to the pathway.
MSC gene expression profile. (A) Subnetworks of the main enrichment map from c5 biological process gene set enrichment analysis results. Red and blue nodes represent the up- and downregulated gene sets in AML-MSCs, respectively. (B) Unsupervised hierarchical clustering of transcriptional profile of h-MSCs (green, n = 6) or h-MSCs when cocultured with AML cells for 4 days (iAML-MSCs, dark green, n = 19). t-distributed stochastic neighbor embedding (t-SNE) showed the distribution of h-MSCs and iAML-MSCs, with specification of the genetics referred to AML cells cocultured with h-MSCs. (C) Heatmap showing the average expression level of the 51 common genes between AML-MSCs and iAML-MSCs with respect to h-MSCs. (D) Gene ontology involving the 51 common genes between AML-MSCs and iAML-MSCs with respect to h-MSCs. Codes inside the circles are the GO number representing the gene ontology category (supplemental Table 7). Color scale indicates FDR q value (0-0.05), whereas circle dimension indicates the number of genes belonging to the pathway.
![AML-MSCs characterization in vitro in 2D culture. (A) Alizarin red S staining (i) and quantification by ImageJ (ii) in h-MSCs (n = 3) and AML-MSCs (n = 8) after 7, 14, and 21 days of culture with or without (namely control medium) osteogenic differentiation medium; ×10 magnification; scale bar, 200 µm. (B) HUVEC tube formation assay. h-MSCs (n = 7) or AML-MSCs (n = 10) were stimulated (st) with a proinflammatory cytokine cocktail (hIL-1β, hIL-6, and hTNF-α) or not (unst) for 24 hours; after medium washout, new fresh medium was added for 18 hours, becoming conditioned medium (CM). CM or basal medium was used to culture HUVECs, and tube formation was evaluated after 4 hours; ×10 magnification; scale bar, 150 µm. (C) Quantification (%) of PHA-stimulated CD3+ T cells expressing CD69 and CD25 after 72 hours of coculture with h-MSCs (n = 15) and AML-MSCs (n = 10), relative to stroma-free conditions (SF, without MSCs, n = 6). (D) Cell proliferation in 2D was measured in AML-MSCs (n = 11) and h-MSCs (n = 5) by ATP cell proliferation assay. (E) Telomere length, expressed as base pair (bp), evaluated on h-MSCs (n = 3) and AML-MSCs (n = 10). (F-H) Percentage of CD34+ progenitor cells (gated on CD45+ and side scatter [SS] low) (F), CD34+CD33− (G), and CD34+CD33+ (H) cells when cocultured with h-MSCs (n = 8) or AML-MSCs (n = 9) after 10 days of cocultures in 2D or without MSCs (stroma free [SF], n = 5). (I) Serial replating of CD34+ cells cocultured with h-MSCs or AML-MSCs (n = 8) or without MSCs (stroma free [SF], n = 6) for 10 days. (J) Cell density of murine IL-3–dependent 32D cell line cultured in 2D with AML-MSCs (red line, n = 6), in the presence of IL-3 (black dotted line, n = 6) or without IL-3 (blue line, n = 8), compared with 32D cell line cocultured with h-MSCs (green line, n = 6). *P < .05, **P < .01, ***P < .001, ****P < .0001.](https://ash.silverchair-cdn.com/ash/content_public/journal/blood/138/7/10.1182_blood.2020009845/6/m_bloodbld2020009845f3.png?Expires=1767709031&Signature=06eyo5OcXc84GwXFO4S64i6CICiw6TlvpAcl7Dgo11TzjxBrgTriMkgI0KAGgkjiyaSjqJuDfna8FW7qgOefEknXsrUxU1bhhVvU65h3Ho59lXgf0maEcZxy3UKaj4GiDjXtYgLpA500mrkBucf1ysuo~-HMU9Fy73FU4~ZYLnPddRDWC4KpuSCXQmWeTa-MKQWOJ9cT4oTwXdU3osMKo2n2LJmqq1b23JGLiaz12kHeFUH0RipVjz~dGyRm1JQpKdCK~zrIK~5X5o4JEW49TlKID7GcqffYQrw5osoGiDL8G4mVHID7YJzxwTi2laPAFG-5hmgbknIYe01tZfNs5w__&Key-Pair-Id=APKAIE5G5CRDK6RD3PGA)
AML-MSCs characterization in vitro in 2D culture. (A) Alizarin red S staining (i) and quantification by ImageJ (ii) in h-MSCs (n = 3) and AML-MSCs (n = 8) after 7, 14, and 21 days of culture with or without (namely control medium) osteogenic differentiation medium; ×10 magnification; scale bar, 200 µm. (B) HUVEC tube formation assay. h-MSCs (n = 7) or AML-MSCs (n = 10) were stimulated (st) with a proinflammatory cytokine cocktail (hIL-1β, hIL-6, and hTNF-α) or not (unst) for 24 hours; after medium washout, new fresh medium was added for 18 hours, becoming conditioned medium (CM). CM or basal medium was used to culture HUVECs, and tube formation was evaluated after 4 hours; ×10 magnification; scale bar, 150 µm. (C) Quantification (%) of PHA-stimulated CD3+ T cells expressing CD69 and CD25 after 72 hours of coculture with h-MSCs (n = 15) and AML-MSCs (n = 10), relative to stroma-free conditions (SF, without MSCs, n = 6). (D) Cell proliferation in 2D was measured in AML-MSCs (n = 11) and h-MSCs (n = 5) by ATP cell proliferation assay. (E) Telomere length, expressed as base pair (bp), evaluated on h-MSCs (n = 3) and AML-MSCs (n = 10). (F-H) Percentage of CD34+ progenitor cells (gated on CD45+ and side scatter [SS] low) (F), CD34+CD33− (G), and CD34+CD33+ (H) cells when cocultured with h-MSCs (n = 8) or AML-MSCs (n = 9) after 10 days of cocultures in 2D or without MSCs (stroma free [SF], n = 5). (I) Serial replating of CD34+ cells cocultured with h-MSCs or AML-MSCs (n = 8) or without MSCs (stroma free [SF], n = 6) for 10 days. (J) Cell density of murine IL-3–dependent 32D cell line cultured in 2D with AML-MSCs (red line, n = 6), in the presence of IL-3 (black dotted line, n = 6) or without IL-3 (blue line, n = 8), compared with 32D cell line cocultured with h-MSCs (green line, n = 6). *P < .05, **P < .01, ***P < .001, ****P < .0001.
AML-MSCs characterization in vitro in 2D culture. (A) Alizarin red S staining (i) and quantification by ImageJ (ii) in h-MSCs (n = 3) and AML-MSCs (n = 8) after 7, 14, and 21 days of culture with or without (namely control medium) osteogenic differentiation medium; ×10 magnification; scale bar, 200 µm. (B) HUVEC tube formation assay. h-MSCs (n = 7) or AML-MSCs (n = 10) were stimulated (st) with a proinflammatory cytokine cocktail (hIL-1β, hIL-6, and hTNF-α) or not (unst) for 24 hours; after medium washout, new fresh medium was added for 18 hours, becoming conditioned medium (CM). CM or basal medium was used to culture HUVECs, and tube formation was evaluated after 4 hours; ×10 magnification; scale bar, 150 µm. (C) Quantification (%) of PHA-stimulated CD3+ T cells expressing CD69 and CD25 after 72 hours of coculture with h-MSCs (n = 15) and AML-MSCs (n = 10), relative to stroma-free conditions (SF, without MSCs, n = 6). (D) Cell proliferation in 2D was measured in AML-MSCs (n = 11) and h-MSCs (n = 5) by ATP cell proliferation assay. (E) Telomere length, expressed as base pair (bp), evaluated on h-MSCs (n = 3) and AML-MSCs (n = 10). (F-H) Percentage of CD34+ progenitor cells (gated on CD45+ and side scatter [SS] low) (F), CD34+CD33− (G), and CD34+CD33+ (H) cells when cocultured with h-MSCs (n = 8) or AML-MSCs (n = 9) after 10 days of cocultures in 2D or without MSCs (stroma free [SF], n = 5). (I) Serial replating of CD34+ cells cocultured with h-MSCs or AML-MSCs (n = 8) or without MSCs (stroma free [SF], n = 6) for 10 days. (J) Cell density of murine IL-3–dependent 32D cell line cultured in 2D with AML-MSCs (red line, n = 6), in the presence of IL-3 (black dotted line, n = 6) or without IL-3 (blue line, n = 8), compared with 32D cell line cocultured with h-MSCs (green line, n = 6). *P < .05, **P < .01, ***P < .001, ****P < .0001.
AML-MSCs resume healthy features when patients obtained remission
We compared GEP of AML-MSCs obtained by BM aspirate collected at diagnosis (n = 21), healthy donor h-MSCs (n = 6), and MSCs obtained from BM aspirate of patients after AML treatment when the disease was confirmed to be in complete remission (namely R-MSCs, n = 10; supplemental Table 11). PCA analysis showed a distribution trend along the PC1 where AML-MSCs displayed a marked separation to h- and R-MSCs (Figure 4A; supplemental Figure 6A; supplemental Tables 12 and 13), confirmed also by 5 paired samples collected at diagnosis and remission (supplemental Figure 6B). We supported this finding, observing a large number of differentially expressed probes between AML-MSCs and h- or R-MSCs (n = 608 and n = 1643, respectively), with respect to a very low number identified in the h- vs R-MSCs transcriptome (n = 121; Figure 4B). The GO comparative analysis confirmed the similarity of R-MSCs with h-MSCs (supplemental Figure 6C), both being different from AML-MSCs, suggesting that the R-MSC transcriptome resumed a healthy signature after AML blasts clearance. To support this finding, we investigated R-MSC functions in vitro. R-MSC proliferation, transformation, and immunomodulatory potential were found to be more similar to h-MSCs, displaying a lower growth rate (Figure 4C), no 32D cell line proliferation when cocultured in the absence of IL-3 (Figure 4D), and a restored immunomodulatory ability demonstrated by a reduction of CD3+ T-cell activation similar to that observed with h-MSCs (Figure 4E). Taken together, these data suggest a direct causal relationship between the presence of AML cells and the acquired properties of the AML-MSCs, whose functional capacity returned to that similar to h-MSC as soon as leukemia cells were cleared by therapy. In addition, we investigated the secretome of the different MSC sources cultured in 3D. We cultured AML-MSCs, h-MSCs, or R-MSCs for 7 days and performed a 44-cytokine expression array. Secretome was defined in cells cultured either alone or in coculture with primary AML cells. Interrogated factors showed (1) many factors with relatively low absolute levels (<100 pg/mL); (2) concentration between 100 and 500 pg/mL (IL-11, sCD163, gp130, OCN, OPN, and TNF-R1); (3) concentration between 500 and 5000 pg/mL (IL-8, BAFF, and CHI3L1), and (4) concentration >5000 pg/mL (APRIL, PTX3, MMP-1, MMP-2, and MMP-3). In particular, in basal conditions, h- and R-MSCs secreted all factors in a comparable way, whereas AML-MSCs displayed an increased factor production with respect to both the 2 previous MSCs sources (48% and 77%, respectively; Figure 4F; supplemental Table 14). To investigate the role in the MSC secretome for AML cells, we analyzed the 3D-AML coculture secretome after seeding AML cells and discovered a supra-additive effect of the AML cells in terms of increased soluble produced factors with respect to MSCs at basal levels in all the cocultures, as represented by the hierarchical clustering and t-SNE analyses (Figure 4F-G; supplemental Table 14). Moreover, extrapolating the role of the AML cells in modulating the MSC secretome, we found that several factors were induced by AML cells in h-MSCs, with most of them being enriched in AML-MSC coculture (Figure 4H). We observed that many increased soluble factors were common between h- and R-MSCs secretome (supplemental Figure 6D-E); in addition, h- and R-MSCs showed a similar but lower ability compared with AML-MSCs to sustain AML blasts proliferation in 3D (supplemental Figure 6F). Overall, our 3D model supports the hypothesis that AML cells trigger and maintain the constitution of a peculiar inflamed secretome within the leukemia niche, revealing elevated levels of IL-32, IL-34, granulocyte-macrophage colony-stimulating factor, and CHI3L1 and a strong production of interferon-γ and tumor necrosis factor factors in cocultures, as previously found in the leukemia niche context,29,30 thus confirming that our 3D niche might be considered a bona fide model of the leukemia niche.
![Effect of AML cells clearance on AML-MSCs. (A) Principal component analysis (PCA) of AML-MSCs (orange, n = 21), h-MSCs (green, n = 6), and R-MSCs (magenta, n = 10). The x-axis represents the first principal component, PC1, which accounts for the largest variance of mRNA expression, and the y-axis, PC2, explains the second largest variance. (B) Venn diagrams of the differentially expressed genes between AML-MSCs, h-MSCs, and R-MSCs. (C) Cell proliferation by ATP in 2D culture was measured in AML-MSCs (n = 11), h-MSCs (n = 6), and R-MSCs (n = 11) at the indicated time points. (D) Cell density of the murine IL-3–dependent 32D cell line cultured in 2D with AML-MSCs (red line, n = 11), in the presence of IL-3 (black dotted line, n = 11), or without IL-3 (blue line, n = 11), compared with 32D cell line cocultured in 2D with h-MSCs (green line, n = 6), or with R-MSCs (magenta line, n = 11). (E) Quantification (%) of PHA-activated CD3+ T cells expressing CD69 and CD25 after 72 hours of coculture in 2D with h-MSCs (n = 15), AML-MSCs (n = 10), and R-MSCs (n = 6) relative to stroma-free conditions (SF, without MSCs, n = 8). (F) Bio-Plex Pro Human Cytokines 37-Plex Array by using the medium of the MSCs cultured in 3D alone (basal secretome level) or with AML blasts. Color-heatmap shows (each row represents the scaled log2 value of cytokine level, where the 0 value represents the average, and ±4 are range boundaries) cytokine level of AML-MSCs (orange bar, n = 15), h-MSCs (green bar, n = 5), and R-MSCs (magenta, n = 10) cultured alone or cocultured with primary AML cells (the gray bar signed secretome measured in cocultures for 7 days with AML blasts, n = 5). (G) t-SNE (with perplexity score of 25) represents MSCs secretome levels of all samples subdivided for being cocultured in 3D with AML blasts (gray dots, n = 27) or at basal level without blasts (brown dots, n = 27). (H) Radar plots represent the cytokines levels secreted in 3D directly attributable to the AML blasts ([(MSCs + AML cells) − MSCs]/AML) relative to AML-MSCs (orange) or h-MSCs (green). Plots represent 3 different fold change ranges: 0 to 1 (left), 0.5 to 2.5 (middle), and 0.5 to 8.5 (right). *P < .05, **P < .01, ***P < .001, ****P < .0001.](https://ash.silverchair-cdn.com/ash/content_public/journal/blood/138/7/10.1182_blood.2020009845/6/m_bloodbld2020009845f4.png?Expires=1767709031&Signature=ZlvDDiruNiY~0sNdQzHOxCuRqRGUhru3H2LrNgXOwbsZlyu4zT1F-Dt6H3MDdkxmVvp0idQnbiu6imP7SAAh8548zxrUawoe~191QQbE6Z7P4Huu-574V6lTrzI26xZw06o414vWrahBH4h9WMfRPuZPRfRsEhRxGYNvZZjulUa0m8hB4yuMGFZtro39kfGkZSFvnFC9ErjdM21duSHUF1AXdj6G~E55rAubp63lj48t-~J-YfgCX-qL3LnHRm1YhSPwrcG39TcCquEb-04alRSPCk2HCMOABNNXWqN8an0cXAXQxTRi3Ll2O7rUafvWeKgpU~pn8pKYr2CBylCPtw__&Key-Pair-Id=APKAIE5G5CRDK6RD3PGA)
Effect of AML cells clearance on AML-MSCs. (A) Principal component analysis (PCA) of AML-MSCs (orange, n = 21), h-MSCs (green, n = 6), and R-MSCs (magenta, n = 10). The x-axis represents the first principal component, PC1, which accounts for the largest variance of mRNA expression, and the y-axis, PC2, explains the second largest variance. (B) Venn diagrams of the differentially expressed genes between AML-MSCs, h-MSCs, and R-MSCs. (C) Cell proliferation by ATP in 2D culture was measured in AML-MSCs (n = 11), h-MSCs (n = 6), and R-MSCs (n = 11) at the indicated time points. (D) Cell density of the murine IL-3–dependent 32D cell line cultured in 2D with AML-MSCs (red line, n = 11), in the presence of IL-3 (black dotted line, n = 11), or without IL-3 (blue line, n = 11), compared with 32D cell line cocultured in 2D with h-MSCs (green line, n = 6), or with R-MSCs (magenta line, n = 11). (E) Quantification (%) of PHA-activated CD3+ T cells expressing CD69 and CD25 after 72 hours of coculture in 2D with h-MSCs (n = 15), AML-MSCs (n = 10), and R-MSCs (n = 6) relative to stroma-free conditions (SF, without MSCs, n = 8). (F) Bio-Plex Pro Human Cytokines 37-Plex Array by using the medium of the MSCs cultured in 3D alone (basal secretome level) or with AML blasts. Color-heatmap shows (each row represents the scaled log2 value of cytokine level, where the 0 value represents the average, and ±4 are range boundaries) cytokine level of AML-MSCs (orange bar, n = 15), h-MSCs (green bar, n = 5), and R-MSCs (magenta, n = 10) cultured alone or cocultured with primary AML cells (the gray bar signed secretome measured in cocultures for 7 days with AML blasts, n = 5). (G) t-SNE (with perplexity score of 25) represents MSCs secretome levels of all samples subdivided for being cocultured in 3D with AML blasts (gray dots, n = 27) or at basal level without blasts (brown dots, n = 27). (H) Radar plots represent the cytokines levels secreted in 3D directly attributable to the AML blasts ([(MSCs + AML cells) − MSCs]/AML) relative to AML-MSCs (orange) or h-MSCs (green). Plots represent 3 different fold change ranges: 0 to 1 (left), 0.5 to 2.5 (middle), and 0.5 to 8.5 (right). *P < .05, **P < .01, ***P < .001, ****P < .0001.
Effect of AML cells clearance on AML-MSCs. (A) Principal component analysis (PCA) of AML-MSCs (orange, n = 21), h-MSCs (green, n = 6), and R-MSCs (magenta, n = 10). The x-axis represents the first principal component, PC1, which accounts for the largest variance of mRNA expression, and the y-axis, PC2, explains the second largest variance. (B) Venn diagrams of the differentially expressed genes between AML-MSCs, h-MSCs, and R-MSCs. (C) Cell proliferation by ATP in 2D culture was measured in AML-MSCs (n = 11), h-MSCs (n = 6), and R-MSCs (n = 11) at the indicated time points. (D) Cell density of the murine IL-3–dependent 32D cell line cultured in 2D with AML-MSCs (red line, n = 11), in the presence of IL-3 (black dotted line, n = 11), or without IL-3 (blue line, n = 11), compared with 32D cell line cocultured in 2D with h-MSCs (green line, n = 6), or with R-MSCs (magenta line, n = 11). (E) Quantification (%) of PHA-activated CD3+ T cells expressing CD69 and CD25 after 72 hours of coculture in 2D with h-MSCs (n = 15), AML-MSCs (n = 10), and R-MSCs (n = 6) relative to stroma-free conditions (SF, without MSCs, n = 8). (F) Bio-Plex Pro Human Cytokines 37-Plex Array by using the medium of the MSCs cultured in 3D alone (basal secretome level) or with AML blasts. Color-heatmap shows (each row represents the scaled log2 value of cytokine level, where the 0 value represents the average, and ±4 are range boundaries) cytokine level of AML-MSCs (orange bar, n = 15), h-MSCs (green bar, n = 5), and R-MSCs (magenta, n = 10) cultured alone or cocultured with primary AML cells (the gray bar signed secretome measured in cocultures for 7 days with AML blasts, n = 5). (G) t-SNE (with perplexity score of 25) represents MSCs secretome levels of all samples subdivided for being cocultured in 3D with AML blasts (gray dots, n = 27) or at basal level without blasts (brown dots, n = 27). (H) Radar plots represent the cytokines levels secreted in 3D directly attributable to the AML blasts ([(MSCs + AML cells) − MSCs]/AML) relative to AML-MSCs (orange) or h-MSCs (green). Plots represent 3 different fold change ranges: 0 to 1 (left), 0.5 to 2.5 (middle), and 0.5 to 8.5 (right). *P < .05, **P < .01, ***P < .001, ****P < .0001.
Lercanidipine as the lead compound to target AML-MSCs
We evaluated the targeting of AML-MSCs in our 3D system. We performed a high-throughput screening using 480 compounds (supplemental Figure 7A) on AML-MSCs and identified 47 active molecules. To exclude toxicity on healthy stromal cells, we tested these 47 compounds on h-MSCs, leading to the exclusion of 16 of 47 molecules. The remaining 31 compounds were used to treat AML cells (using 2 cell lines HL-60 and ML-2), identifying 17 compounds that satisfied our criteria of selectivity toward AML-MSCs (Figure 5A; supplemental Table 15; supplemental Figure 7B). Interestingly, the 17 identified drugs belong to different classes of action (supplemental Figure 7C); interpretation by Enrichr analysis on drug targets showed the calcium pathway as the mainly involved pathway (supplemental Figure 7D). Thus, we selected the 2 compounds, lercanidipine and nemadipine-A, both belonging to the class of dihydropyridines that block the inward movement of calcium by binding to the L-type voltage-dependent calcium channel CaV1.2. We treated a large number of AML- and h-MSCs, primary AML samples, and CD34+ healthy cells, demonstrating that lercanidipine was significantly able to reduce AML-MSCs proliferation rate (<50%; Figure 5B) without toxicity on healthy CD34+ (supplemental Figure 7E), nor abnormalities in MSCs morphology (supplemental Figure 7F). In line with these findings, we evaluated CaV1.2 expression in AML-MSCs by immunofluorescence and flow cytometry demonstrating a lower CaV1.2 protein expression on AML-MSCs compared with h-MSCs (Figure 5C-D). Likewise, mRNA evaluation confirmed a threefold expression reduction (Figure 5E). As a confirmation that CaV1.2 is a lercanidipine target in MSCs, we detected a reduced Ca2+ influx on lercanidipine treatment in AML-MSCs, which was rescued in the presence of competitive CaV1.2 agonists (supplemental Figure 8A); accordingly, cotreatment of lercanidipine and agonists also rescued MSC proliferation (supplemental Figure 8B). Moreover, we treated cells with additional CaV1.2 antagonists, belonging to different chemical classes, confirming decreased proliferation (supplemental Figure 8C). Indeed, we monitored CaV1.2 activity, demonstrating its ability to respond to KCl-induced membrane depolarization in both cell types31 in the presence of extracellular Ca2+, with AML-MSCs displaying a reduced Ca2+ uptake compared with h-MSCs (Figure 5F). To exclude the involvement of other calcium channels, we measured the expression of the store-operated calcium channel ORAI1 and the calcium-sensing STIM1 protein, demonstrating no changes between AML- and h-MSCs in both protein expression; this finding excludes their contribution on calcium homeostasis in AML-MSCs (supplemental Figure 8D).We then monitored cytosolic Ca2+ after prolonged lercanidipine treatment and observed that AML-MSCs were significantly impaired in Ca2+ increase capability (Figure 5G; supplemental Movie 3 and supplemental Figure 8E after extracellular Ca2+ or KCl administration, respectively), leading to a reduction of AML-MSCs proliferation but not in cell viability with up to 72 hours of treatment. Thereafter, from days 3 to 9, cell viability was compromised by lercanidipine treatment (Annexin V−propidium iodide [PI]− average 11%), suggesting a late long-term effect on AML-MSC survival. Washing out lercanidipine after 24 hours, we observed a rescued AML-MSC proliferation (Figure 5H; supplemental Table 16). Finally, we explored whether AML-MSCs treated with lercanidipine showed either healthy or remission characteristics. We showed that lercanidipine-treated AML-MSCs modified gene expression (supplemental Figure 8F-G) and secretome profile (supplemental Figures 8H) differently from h- and R-MSCs. Moreover, AML-MSC lercanidipine-treated cells did not reduce T-cell activation (supplemental Figures 8I). Altogether, these results indicate that lercanidipine exerts reversible effects on BM niche components.
![2D drug screening in AML-MSCs identifies lercanidipine. (A) Cell proliferation by ATP in 2D culture after treatment with 480 chemically active compounds used at 10 μM in AML-MSCs (n = 6). Compounds that reduced cell proliferation more than 50% were tested on h-MSCs (n = 2) and AML cell lines (HL-60 and ML-2). Cell proliferation ranged from 0% (red) to 100% (pink), relative to DMSO value. Treatments were performed in triplicate. (B) Cell proliferation by ATP in 2D culture of AML-MSCs (n = 6), h-MSCs (n = 3), AML cell lines (n = 2), primary AML cells (n = 6), and cord blood–derived CD34+ cells (n = 2) after 48 hours of lercanidipine treatment, relative to DMSO value. Treatments were performed in triplicate; dotted line represents 50% of cell proliferation. (C) Immunofluorescence staining of CaV1.2 (green) expression, F-actin (red), and DAPI nuclear counterstain (blue) in MSCs cells in 2D culture; ×40 magnification; scale bar, 10 µm, n = 6. (D) Quantification of CaV1.2-expressing h-MSCs (n = 13) and AML-MSCs (n = 14) in 2D culture, analyzed by flow cytometry. (E) Relative mRNA expression of CaV1.2 (CACNA1C) in h-MSCs (n = 12) and AML-MSCs (n = 16) in 2D culture, measured by RQ-polymerase chain reaction. (F) Intracellular calcium increases in MSCs in 2D culture loaded with calcium indicator Fluo-4 AM probe and stimulated with KCl (n = 2, arbitrary unit [AU]). (G) Intracellular calcium increases in MSCs in 2D culture loaded with calcium indicator Fluo-4 AM probe after CaCl2 addition (5 mM) to culture medium on h-MSCs or AML-MSCs under lercanidipine or vehicle (DMSO) treatment (n = 3). (H) Cell proliferation (by ATP assay) and viability (by Annexin V/PI staining) of AML-MSCs in 2D culture up to 9 days after lercanidipine treatment. Dotted lines represent cell proliferation and viability after washout (w/o) at 24 hours from lercanidipine treatment (n = 5). *P < .05, **P < .01, ***P < .001, ****P < .0001. RQ, real quantitative.](https://ash.silverchair-cdn.com/ash/content_public/journal/blood/138/7/10.1182_blood.2020009845/6/m_bloodbld2020009845f5.png?Expires=1767709031&Signature=jmY8sEjekP3bm0~bOVTyJNhOlZRlprCi9EE5MU0JxMGyNizqCbPoIZp-FujMDflKgjoBj3hXVsXI6Wu~KPPh3EihWQHd5uPwQfeppkUdEvvSRUUg8vLgkNcGR1IQWMset1fZvZ~jkCTqyiI5Z9Wip9Pd1juO8c-SMaeuLpwbxOEehZE-PlJoK53kxXrywELA-uZtKtQMeNuevAEKlUdOxfksKH-4wXEOTo6UB-kPuYojF4mKx-bdrKDPqPrxgnb4QOVydlYG81XY8rAoimTlEAc7SxEkrQc8T45J~vu~qjgTc06rlpeKA1rqz9GP3N1LZqN1UuRHmIeQkJ0rEZzzSQ__&Key-Pair-Id=APKAIE5G5CRDK6RD3PGA)
2D drug screening in AML-MSCs identifies lercanidipine. (A) Cell proliferation by ATP in 2D culture after treatment with 480 chemically active compounds used at 10 μM in AML-MSCs (n = 6). Compounds that reduced cell proliferation more than 50% were tested on h-MSCs (n = 2) and AML cell lines (HL-60 and ML-2). Cell proliferation ranged from 0% (red) to 100% (pink), relative to DMSO value. Treatments were performed in triplicate. (B) Cell proliferation by ATP in 2D culture of AML-MSCs (n = 6), h-MSCs (n = 3), AML cell lines (n = 2), primary AML cells (n = 6), and cord blood–derived CD34+ cells (n = 2) after 48 hours of lercanidipine treatment, relative to DMSO value. Treatments were performed in triplicate; dotted line represents 50% of cell proliferation. (C) Immunofluorescence staining of CaV1.2 (green) expression, F-actin (red), and DAPI nuclear counterstain (blue) in MSCs cells in 2D culture; ×40 magnification; scale bar, 10 µm, n = 6. (D) Quantification of CaV1.2-expressing h-MSCs (n = 13) and AML-MSCs (n = 14) in 2D culture, analyzed by flow cytometry. (E) Relative mRNA expression of CaV1.2 (CACNA1C) in h-MSCs (n = 12) and AML-MSCs (n = 16) in 2D culture, measured by RQ-polymerase chain reaction. (F) Intracellular calcium increases in MSCs in 2D culture loaded with calcium indicator Fluo-4 AM probe and stimulated with KCl (n = 2, arbitrary unit [AU]). (G) Intracellular calcium increases in MSCs in 2D culture loaded with calcium indicator Fluo-4 AM probe after CaCl2 addition (5 mM) to culture medium on h-MSCs or AML-MSCs under lercanidipine or vehicle (DMSO) treatment (n = 3). (H) Cell proliferation (by ATP assay) and viability (by Annexin V/PI staining) of AML-MSCs in 2D culture up to 9 days after lercanidipine treatment. Dotted lines represent cell proliferation and viability after washout (w/o) at 24 hours from lercanidipine treatment (n = 5). *P < .05, **P < .01, ***P < .001, ****P < .0001. RQ, real quantitative.
2D drug screening in AML-MSCs identifies lercanidipine. (A) Cell proliferation by ATP in 2D culture after treatment with 480 chemically active compounds used at 10 μM in AML-MSCs (n = 6). Compounds that reduced cell proliferation more than 50% were tested on h-MSCs (n = 2) and AML cell lines (HL-60 and ML-2). Cell proliferation ranged from 0% (red) to 100% (pink), relative to DMSO value. Treatments were performed in triplicate. (B) Cell proliferation by ATP in 2D culture of AML-MSCs (n = 6), h-MSCs (n = 3), AML cell lines (n = 2), primary AML cells (n = 6), and cord blood–derived CD34+ cells (n = 2) after 48 hours of lercanidipine treatment, relative to DMSO value. Treatments were performed in triplicate; dotted line represents 50% of cell proliferation. (C) Immunofluorescence staining of CaV1.2 (green) expression, F-actin (red), and DAPI nuclear counterstain (blue) in MSCs cells in 2D culture; ×40 magnification; scale bar, 10 µm, n = 6. (D) Quantification of CaV1.2-expressing h-MSCs (n = 13) and AML-MSCs (n = 14) in 2D culture, analyzed by flow cytometry. (E) Relative mRNA expression of CaV1.2 (CACNA1C) in h-MSCs (n = 12) and AML-MSCs (n = 16) in 2D culture, measured by RQ-polymerase chain reaction. (F) Intracellular calcium increases in MSCs in 2D culture loaded with calcium indicator Fluo-4 AM probe and stimulated with KCl (n = 2, arbitrary unit [AU]). (G) Intracellular calcium increases in MSCs in 2D culture loaded with calcium indicator Fluo-4 AM probe after CaCl2 addition (5 mM) to culture medium on h-MSCs or AML-MSCs under lercanidipine or vehicle (DMSO) treatment (n = 3). (H) Cell proliferation (by ATP assay) and viability (by Annexin V/PI staining) of AML-MSCs in 2D culture up to 9 days after lercanidipine treatment. Dotted lines represent cell proliferation and viability after washout (w/o) at 24 hours from lercanidipine treatment (n = 5). *P < .05, **P < .01, ***P < .001, ****P < .0001. RQ, real quantitative.
AML cells and AML-MSC dual targeting to reduce leukemia proliferation
To explore the effectiveness of AML-MSC targeting during chemotherapy in vitro, we set up a 3D culture system (supplemental Figure 9A) where we evaluated drug effective doses. First, after 3 days of treatment, we observed different lercanidipine active concentrations in AML-MSCs in 2D or 3D models (supplemental Figure 9B-C), indicating the greater relevance of the 3D model and the limit of treatment overestimation effects in 2D culture. Then, we decided to specifically target primary BM cells of patients at diagnosis of AML with cytarabine (Ara-C), venetoclax (Bcl-2 inhibitor), quizartinib (primary AML with FLT3-ITD), I-BET151 (primary AML with MLL-rearrangements), and dasatinib (AML with c-KIT mutations), used at subtoxic doses to not affect AML-MSCs (supplemental Figure 9D), alone or in combination with lercanidipine (dual targeting). We demonstrated a lercanidipine-mediated synergistic effect in reducing leukemia cell proliferation in vitro (Figure 6A-B), confirming that the dual targeting approach is effective in reducing both cell compartments (Figure 6C). Furthermore , the lercanidipine drug used in 3D was shown to reduce AML blast colony formation in serial replating experiments when used as single or combined agent (Figure 6D; supplemental Figure 9E). Moreover, considering the large amount of IL-6 released by AML-MSCs, we wanted to validate the blocking of this mediator in the stroma–AML interaction using tocilizumab: we found decreased leukemia cell proliferation that did not synergize with Ara-C (supplemental Figure 9F-H). We then moved to the in vivo setting by analyzing the characteristics of our 3D scaffolds from 3 weeks to 6 months after implantation. We observed vascularization pervading the exogenous structure and the presence of osteoblasts derived from human MSCs, documenting a bona fide humanized niche, supporting the potential to human blasts to grow in the scaffold in vivo for a long time (human CD45+ cells or luciferase-positive cells; Figure 7A; supplemental Figure 10A). Thus, we performed a pilot 3D treatment experiment in vivo with the SHI-1 cell line treated with different compounds. Our 3D system was suitable to assess drug efficacy, with I-BET151 and 5-azacytidine found to be significantly active in this MLL-rearranged cell line (Figure 7B; supplemental Figure 10B). Thus, we moved to test our novel dual targeting approach in 3D scaffolds with AML-MSCs and primary AML cells, combining lercanidipine with low-dose Ara-C. Once luciferase signal was detectable in 3D in mice (8 days from AML cell injection), mice were treated (intraperitoneally) with lercanidipine and low-dose Ara-C as either single agents or in combination. During the 5 weeks of treatment, we observed an impressive reduction of leukemia burden by the dual targeting approach with respect to single agents; this latter combination strategy advantage was maintained up to 5 weeks after treatment discontinuation (Figure 7C), with the confirmation that lercanidipine selectively targets stromal cells in vivo (as reported by CD73 and human-osteopontin staining in Figure 7D; supplemental Figure 10C). This experiment strongly supports the use of lercanidipine as an agent able to synergize with the cytotoxic effect displayed by chemotherapy.
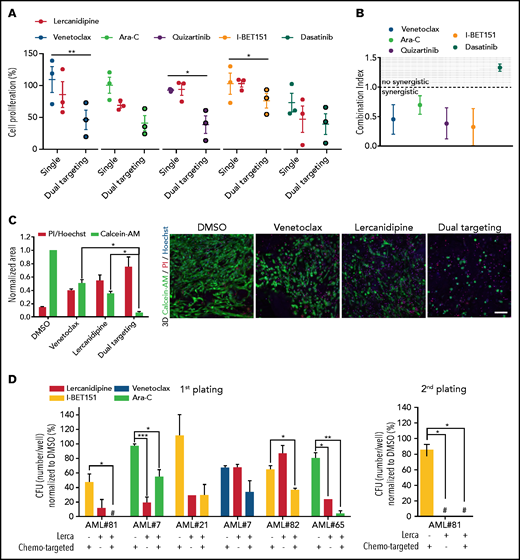
3D-AML drug screening in vitro. (A) Cell proliferation by ATP of 3D-MSCs cocultured with different primary AML samples, analyzed after 72 hours of venetoclax 0.005 µM, Ara-C 0.01 µM, quizartinib 0.2 µM, I-BET151 0.5 µM, and dasatinib 6 µM single treatment, and after combined therapy with lercanidipine 15 µM (dual targeting), normalized to the respective controls (DMSO; n = 3; treatments were performed in duplicate). (B) Analysis of combination index (CI) and synergistic effect for venetoclax, Ara-C, quizartinib, I-BET151, and dasatinib in combination with lercanidipine in 3D-AML model (CI <1.0 = synergistic effect). (C) Representative histogram of 3D-AML scaffolds after 72 hours of treatment with venetoclax either alone or in combination with lercanidipine, marked by Calcein-AM (green, survived cells, evaluated as area of the stack projection and normalized to DMSO) or by PI (red, dead cells, evaluated as ratio of PI red nuclei and blue Hoechst nuclei). Images are representative micrograph of double staining with Calcein-AM (green) and PI (red) of cells; ×20 magnification; scale bar, 100 µm. (D) Serial replating of AML cells harvested from 3D-AML model after 72 hours of treatment with chemo-targeted therapy and lercanidipine, alone or in combination (n = 5). #Absence of colonies. *P < .05, **P < .01.
3D-AML drug screening in vitro. (A) Cell proliferation by ATP of 3D-MSCs cocultured with different primary AML samples, analyzed after 72 hours of venetoclax 0.005 µM, Ara-C 0.01 µM, quizartinib 0.2 µM, I-BET151 0.5 µM, and dasatinib 6 µM single treatment, and after combined therapy with lercanidipine 15 µM (dual targeting), normalized to the respective controls (DMSO; n = 3; treatments were performed in duplicate). (B) Analysis of combination index (CI) and synergistic effect for venetoclax, Ara-C, quizartinib, I-BET151, and dasatinib in combination with lercanidipine in 3D-AML model (CI <1.0 = synergistic effect). (C) Representative histogram of 3D-AML scaffolds after 72 hours of treatment with venetoclax either alone or in combination with lercanidipine, marked by Calcein-AM (green, survived cells, evaluated as area of the stack projection and normalized to DMSO) or by PI (red, dead cells, evaluated as ratio of PI red nuclei and blue Hoechst nuclei). Images are representative micrograph of double staining with Calcein-AM (green) and PI (red) of cells; ×20 magnification; scale bar, 100 µm. (D) Serial replating of AML cells harvested from 3D-AML model after 72 hours of treatment with chemo-targeted therapy and lercanidipine, alone or in combination (n = 5). #Absence of colonies. *P < .05, **P < .01.
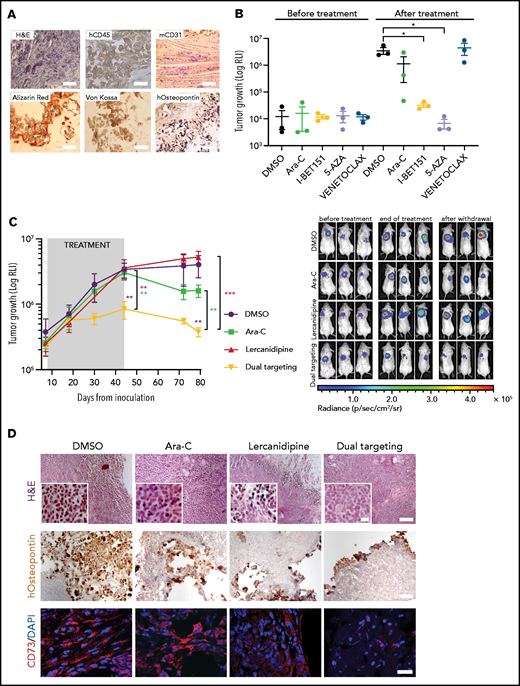
3D-AML drug screening in vivo. (A) Histologic assessment of ex vivo 3D scaffolds 3 weeks after implantation: representative image of hematoxylin and eosin (H&E, ×10 magnification, scale bar = 100 µm), human CD45 (×100 magnification; scale bar, 10 µm), murine CD31 (×20 magnification; scale bar, 50 µm), Alizarin red, von Kossa, and human-osteopontin (×100 magnification, scale bar = 10 µm) staining. (B) 3D scaffolds were seeded with stromal cells (at t = 0) and cultured in vitro for 24 hours before adding the luciferase-transduced SHI-1 AML cell line. After 24 hours, scaffolds were subcutaneously implanted in the back of previously irradiated NSG mice. Luciferase activity was measured before (at day 10) and after (at day 32) treatment. RLI, relative luminescence intensity; total flux = photons/s. Animals were treated daily at the following doses: venetoclax 100 mg/kg (orally), Ara-C 50 mg/kg (intraperitoneally), I-BET151 30 mg/kg (intraperitoneally), 5-azacytidine 5 mg/kg (intraperitoneally); n = 3 mice per group. (C) Tumor growth of luciferase-transduced primary AML cells in 3D scaffold in NSG mice, measured by luminescence activity during treatment with Ara-C 12.5 mg/kg (intraperitoneally) and lercanidipine 3 mg/kg (intraperitoneally), as single agents or in combination (dual targeting). Combination index (CI) = 0.1 at the end of treatment (day 44). CI = 0.5 after treatment withdrawal (day 79). CI <1.0 = synergistic effect. (i) Representative images of bioluminescence in differently treated mice before (at day 7) and after treatment (at day 44) and at treatment withdrawal (at day 79). n = 5 mice per group. (D) Representative images of H&E (×10 magnification; scale bar, 100 µm). Scale bar of images at higher magnitude, 2 µm), human osteopontin immunohistochemical analysis (×10 magnification; scale bar, 100 µm), and CD73 immunofluorescence (×60 magnification; scale bar, 40 µm) staining of scaffolds harvested from mice at the end of treatment. *P < .05, **P < .01, ****P < .0001.
3D-AML drug screening in vivo. (A) Histologic assessment of ex vivo 3D scaffolds 3 weeks after implantation: representative image of hematoxylin and eosin (H&E, ×10 magnification, scale bar = 100 µm), human CD45 (×100 magnification; scale bar, 10 µm), murine CD31 (×20 magnification; scale bar, 50 µm), Alizarin red, von Kossa, and human-osteopontin (×100 magnification, scale bar = 10 µm) staining. (B) 3D scaffolds were seeded with stromal cells (at t = 0) and cultured in vitro for 24 hours before adding the luciferase-transduced SHI-1 AML cell line. After 24 hours, scaffolds were subcutaneously implanted in the back of previously irradiated NSG mice. Luciferase activity was measured before (at day 10) and after (at day 32) treatment. RLI, relative luminescence intensity; total flux = photons/s. Animals were treated daily at the following doses: venetoclax 100 mg/kg (orally), Ara-C 50 mg/kg (intraperitoneally), I-BET151 30 mg/kg (intraperitoneally), 5-azacytidine 5 mg/kg (intraperitoneally); n = 3 mice per group. (C) Tumor growth of luciferase-transduced primary AML cells in 3D scaffold in NSG mice, measured by luminescence activity during treatment with Ara-C 12.5 mg/kg (intraperitoneally) and lercanidipine 3 mg/kg (intraperitoneally), as single agents or in combination (dual targeting). Combination index (CI) = 0.1 at the end of treatment (day 44). CI = 0.5 after treatment withdrawal (day 79). CI <1.0 = synergistic effect. (i) Representative images of bioluminescence in differently treated mice before (at day 7) and after treatment (at day 44) and at treatment withdrawal (at day 79). n = 5 mice per group. (D) Representative images of H&E (×10 magnification; scale bar, 100 µm). Scale bar of images at higher magnitude, 2 µm), human osteopontin immunohistochemical analysis (×10 magnification; scale bar, 100 µm), and CD73 immunofluorescence (×60 magnification; scale bar, 40 µm) staining of scaffolds harvested from mice at the end of treatment. *P < .05, **P < .01, ****P < .0001.
Discussion
In hematopoietic malignancies, BM stroma is considered instrumental to favor tumor development, promoting clonal evolution, cell migration, and chemoresistance that results into tumor progression and often immune escape.32-35 The role of MSCs and their use as a therapeutic tool in cancer treatment, transplant, and regenerative medicine are still debated, and several issues regarding their pleiotropic functions, the absence of in vivo tracking markers, and the use of preclinical models suitable for determining their biology are limiting improvements in this research area.36 We investigated the complex events occurring in the leukemia BM niche to unravel the dynamicity of cell–cell interaction and organization, immunoregulatory properties, and soluble factors secreted that could lead to a better understanding of unrecognized leukemogenic events, with chances to derive innovative treatment opportunities.19,37 Here, we report a detailed functional in vitro characterization of MSCs derived from pediatric BM-AML samples collected at diagnosis in an innovative 3D system mimicking the physiologic interaction occurring between the AML cells and MSCs in the BM niche. We found peculiar AML-MSCs potentialities able to sustain and enhance leukemia cell proliferation, confirmed by implanting this humanized 3D niche in vivo. We produced evidence that AML cells modified MSC properties by creating several physical connections, mediating a reprogrammed transcriptome with consequences on the secretome, and acquisition of novel pro-oncogenic functions. h-MSCs were able to support the normal hematopoietic differentiation process, whereas AML-MSCs maintained the immature CD34 precursor cells for a longer time, during which the transformation process might be potentiated.6 Moreover, although inflammation is indubitably present in the leukemia niche,38-41 we documented that when AML cells are added in the 3D cultures, we found a superenhanced MSC secretion of a large series of proinflammatory factors. This latter finding was responsible for the documented concomitant reduced AML-MSC immunomodulatory and anti-inflammatory activity. Then, we tested the hypothesis of a transient MSC status becoming AML-MSCs after contact with AML leukemia blasts and confirmed a dynamic change of the h-MSCs transcriptome toward that of the AML-MSCs when cocultured with primary AML cells in vitro. Our data supported this reprogramming ability to sustain h-MSC transition during leukemia, being promoted and maintained by stimuli in both a cell- and non–cell-mediated modality. Hence, when AML occurs, it remodels the resident MSCs transforming the microenvironment, and when healthy conditions were resumed by therapy in R-MSCs, they reverted to healthy primary properties. Overall, we showed that the leukemia niche onset, here reported as reprogrammed microenvironment, might be considered a pathogenic event, thus targeting it would be a strategy to disadvantage AML. We blindly looked for new drugs, identifying 17 compounds active on AML-MSCs involved in 1 main driver pathway: calcium signaling. Lercanidipine and nemadipine-A are currently used to block L-type calcium channels in hypertension treatment.42 Here, we demonstrated that the CaV1.2 channel is severely downregulated exclusively in AML-MSCs.43,44 In addition, we observed that lercanidipine long-term treatment affected AML-MSC viability, whereas short treatments followed by washout permitted restoration of stromal function, thus supporting the stromal BM recovery after therapy. Overall, these data suggest that niche–calcium homeostasis might be crucial during leukemia initiation, such as during MSC transition to AML-MSCs, and consequently during treatment, leukemia progression, and relapse. We set up 3D-AML long-term treatment cultures showing the effectiveness of dual targeting; in addition, lercanidipine was shown to sensitize leukemia cells to other drugs. Altogether, these results indicate that MSC plasticity in the context of the pediatric leukemia niche might represent a potential target to be further investigated to optimize AML blast clearance. Our findings in AML patient-derived xenograft drug screening, which combined AML and MSC targeting in a 3D artificial model that recapitulates crucial physiologic aspects of the leukemia niche, appears promising for accelerating the achievement of robust preclinical results instrumental for identifying innovative therapeutic approaches in childhood AML.
Acknowledgments
The authors thank the staff of the Oncology/Hematology Laboratory for the AML diagnostics, in particular, Katia Polato, Samuela Francescato, Chiara Frasson, and Annamaria Di Meglio; the Pediatric Oncology BioBank (BBOP) for biological samples management; the Cord Blood Bank of the Oncology/Hematology Clinic of Padova, especially Roberta Destro, Matteo Borioni, and Barbara Sartini; Vito Barbieri for technical support in the mice facility; the members of the Advanced Light Microscopy core facility at the Francis Crick Institute for valuable help; and Anna Tampieri and Silvia Panseri from the Institute of Science and Technology for Ceramics–National Research Council (ISTEC-CNR) for collaboration and efforts spent in scaffolds generation; and Eva Trevisson and Chiara Rigon for comparative genomic hybridization experiments.
This work was supported by grants to M.P. from Università degli Studi di Padova, Fondazione Cassa di Risparmio di Padua e Rovigo (CARIPARO Foundation) grant 17/04, Co-IP grant 21/06 by Istituto di Ricerca Pediatrica (IRP), by Fondazione AIRC (Associazione Italiana Ricerca sul Cancro) IG grant 20562; and from AIL-PD and AIL-TV. This work was also supported by grants to F.L. from Fondazione AIRC special grant “5xmille”-9962, and a grant from the Ministero della Salute (RF-2010-2316606). The G. Borile fellowship at Francis Crick Institute was supported by My First IRP grant 19/06.
Authorship
Contribution: G. Borella, C .T., M.B., B. Montini, and A.M. performed all in vitro experiments; G. Borile performed all confocal imaging experiments and analysis; E.P., A.D.R., and V.B. performed in vivo experiments; E.C. and M.S. generated the Hydroxyapatite/Collagen I 3D bone scaffold; M.M. performed histologic and scanning electron microscopy analysis; A.C. and S.B. performed gene expression experiments and analysis; B. Michielotto and B.B. performed flow cytometry immunophenotype analysis; A.L. performed and analyzed karyotype; S.C. analyzed in vivo data; M.P. and G. Borella designed the research and wrote the manuscript; M.P. and F.L. analyzed and interpreted data; and all authors reviewed and approved both text and figures.
Conflict-of-interest disclosure: The authors declare no competing financial interests.
Correspondence: Martina Pigazzi, University of Padova, Women’s and Children’s Health Department, Haematology-Oncology Clinic and Laboratory, Via Giustiniani 3, 35128 Padova, Italy; e-mail: martina.pigazzi@unipd.it.
In loving memory of Giuseppe Basso.
Microarray data are available at GEO under accession number GSE169428.
There is a Blood Commentary on this article in this issue.
The online version of this article contains a data supplement.
The publication costs of this article were defrayed in part by page charge payment. Therefore, and solely to indicate this fact, this article is hereby marked “advertisement” in accordance with 18 USC section 1734.
