

Key Points
In 2 study cohorts, less-intensive therapies increased mortality in each of 3 risk groups defined by age, comorbidities, and cytogenetics.
The differences became nonsignificant after accounting for physician perception of cure, emphasizing the need for a randomized trial.

Abstract
Less-intensive induction therapies are increasingly used in older patients with acute myeloid leukemia (AML). Using an AML composite model (AML-CM) assigning higher scores to older age, increased comorbidity burdens, and adverse cytogenetic risks, we defined 3 distinct prognostic groups and compared outcomes after less-intensive vs intensive induction therapies in a multicenter retrospective cohort (n = 1292) treated at 6 institutions from 2008 to 2012 and a prospective cohort (n = 695) treated at 13 institutions from 2013 to 2017. Prospective study included impacts of Karnofsky performance status (KPS), quality of life (QOL), and physician perception of cure. In the retrospective cohort, recipients of less-intensive therapies were older and had more comorbidities, more adverse cytogenetics, and worse KPS. Less-intensive therapies were associated with higher risks of mortality in AML-CM scores of 4 to 6, 7 to 9, and ≥10. Results were independent of allogeneic transplantation and similar in those age 70 to 79 years. In the prospective cohort, the 2 groups were similar in baseline QOL, geriatric assessment, and patient outcome preferences. Higher mortality risks were seen after less-intensive therapies. However, in models adjusted for age, physician-assigned KPS, and chance of cure, mortality risks and QOL were similar. Less-intensive therapy recipients had shorter length of hospitalization (LOH). Our study questions the survival and QOL benefits (except LOH) of less-intensive therapies in patients with AML, including those age 70 to 79 years or with high comorbidity burdens. A randomized trial in older/medically infirm patients is required to better assess the value of less-intensive and intensive therapies or their combination. This trial was registered at www.clinicaltrials.gov as #NCT01929408.
Introduction
Despite recent progress, acute myeloid leukemia (AML) remains fatal in most older patients.1 Recent 5-year overall survival (OS) rates in the United States were only 7% to 9% and 1% to 2% for patients age 65 to 74 and 75 to 84 years, respectively,2 which is noteworthy given the average age at diagnosis is 68 years. These estimates have changed very little over decades.3
A fundamental decision when seeing an older or medically infirm patient with AML is whether to recommend more- or less-intensive initial induction therapy.4 The decision to offer less-intensive therapies is based largely on chronologic age, with patients age >65 years typically receiving less-intensive therapies, and to some extent on performance status (PS).5-12 However, PS has the limitation of not differentiating between functional impairments resulting from AML, which are potentially responsive to anti-AML treatment, and impairments resulting from other comorbidities, which may be contraindications to intensive therapies. Comorbidity indices have been shown to be more accurate predictors of outcome than age or PS.13 An example is the AML composite model (AML-CM) that assigns increasing scores for greater comorbidity burdens as defined in the augmented hematopoietic cell transplantation (HCT) comorbidity index (HCT-CI), higher cytogenetic/molecular risks per the 2017 European LeukemiaNet (ELN) classification,14 and for increasing age.13,15 In the current study, we hypothesized that patients’ older age and/or higher comorbidity burdens, per the AML-CM,13 would result in worse survival and/or quality of life (QOL) with intensive chemotherapy, and therefore, less-intensive chemotherapy would be favored for such patients. We first evaluated this hypothesis retrospectively in a cohort of patients from multiple institutions. Then, we evaluated the same hypothesis in a prospectively observed and more recently treated cohort of patients to confirm our findings; capture more recent updates in practice; account for prospectively collected QOL, geriatric, and frailty assessments to enhance our understanding of medical fitness; and account for physician and patient perceptions of chance of cure and patient treatment goals to enhance our understanding of the decision-making process.
Methods
Source of data
Retrospective cohort
The retrospective cohort included 1292 patients treated at 6 collaborating tertiary centers: Fred Hutchinson Cancer Research Center/University of Washington Cancer Consortium (coordinating site), Cleveland Clinic, Massachusetts General Hospital, Stanford University, University of Utah, and Roswell Park Cancer Institute. Data were collected by review of electronic medical records and computer databases. Less-intensive and intensive therapies were defined per results of a recent survey and intensity assignment model (supplemental Table 1, available on the Blood Web site).16
Prospective cohort
This was a prospective observational clinical trial of 692 patients treated between July 2013 and December 2017 at 13 centers: Fred Hutchinson Cancer Research Center/University of Washington Cancer Consortium (coordinating site), Cleveland Clinic, Stanford University, University of Utah, Roswell Park Cancer Institute, Northwestern University, University of Pennsylvania, University of Maryland, Duke University, Washington University in St Louis, Hackensack University, Confluence Health/Wenatchee Valley Hospital and Clinic, and Skagit Valley Hospital. Study flow is described in supplemental Figure 1. Description and classification of regimens into either intensive or less-intensive categories are provided in supplemental Table 5.16 All patients provided written informed consent.
Inclusion criteria for both cohorts included age >18 to 80 years and treatment with therapy commonly used to treat AML.
Questionnaires were collected at the time of enrollment and then approximately at months +1, +3, +6, +9, +12, +18, and +24 after study enrollment. Patient and physician preference surveys were collected at the time of enrollment and then approximately at months +1 and +3. Administration of all surveys was event driven but approximately corresponded to the time points illustrated in supplemental Table 4 and adjusted to correspond to recovery of peripheral blood counts (defined as absolute neutrophil count >13/μL and platelet count >1003/μL). In patients who proceeded to allogeneic HCT, timing of surveys was aligned with the transplantation procedure and recovery.
Both protocols were approved by the institutional review boards (IRB) of each collaborating site.
QOL and function measures
QOL and measures of function are described in the supplemental Data.
Risk model
Missing data
Supplemental Table 3 describes missing data in both retrospective and prospective cohorts stratified into less-intensive vs intensive regimens. Cytogenetic and molecular risks per 2017 ELN classification were equally available for a majority (96%) of patients in both groups. However, within the retrospective cohort, recipients of less-intensive therapies were more likely to be missing augmented HCT-CI scores and AML-CM scores but less likely to be missing Karnofsky PS (KPS) percentages compared with recipients of intensive regimens. Given this, we compared patients with missing data between the 2 groups for their outcomes.
Within the prospective cohort, the level of missingness of baseline data was not statistically significantly different between the 2 treatment groups for any of the baseline factors. We dealt with missing data as described in “Statistical methods.” In regard to QOL tools, 75% to 80% of patients completed these surveys at baseline, and an additional 12% to 18% completed the surveys outside the protocol-mandated period of 7 days from enrollment. Patients who completed their baseline survey outside the 7-day window were counted as missing data.
Missing data did not vary based on age group (data not shown).
Statistical methods
Our main goal was comparing intensive vs less-intensive induction therapies after accounting for relevant confounding factors. We used the AML-CM risk categories to analyze outcomes between less-intensive vs intensive therapy groups. Survival was estimated by the Kaplan-Meier method. To study the effect of undergoing HCT on survival comparing the 2 regimen intensity groups, we used a competing-risk Cox regression analysis with HCT as a time-dependent risk factor, treating death without HCT as a competing risk.
Summary statistics, including frequency counts and percentages for categorical variables (diagnosis, patient preferences, and patient and physician estimates of cure at enrollment), and means and standard deviations for baseline QOL, geriatric assessment, and frailty, were calculated for patients in the prospective cohort. Univariate comparisons of proportions were performed with the χ2 test. Time-dependent regression analyses were used when comparing less-intensive vs intensive regimens within the AML-CM risk categories and were adjusted for variables found to be different between the 2 regimen intensities. These included additional age cutoffs not included in the AML-CM, KPS, and physician perceptions of likelihood of cure. Adjusted Kaplan-Meier survival rates were estimated based on methods described by Makuch.17 Briefly, the adjusted survival rate for the less-intensive therapy group represented a model-based projection of survival for a group of patients with the same baseline hazard function estimated for those patients, but with the covariate characteristics of the intensive group. These estimates were derived from Cox regression models incorporating the adjustment factors as covariates and stratified by treatment group. Logistic regression was used to compare QOL and function measures over time between less-intensive and intensive therapies within the AML-CM risk categories, adjusted for time since diagnosis and HCT.
For QOL, function, and patient-reported outcome analyses
We used logistic regression with generalized estimating equations and robust variances to account for multiple observations per person based on dichotomized versions of the outcomes. The primary purpose of this analysis was to compare the groups of patients who received less-intensive vs those who received intensive induction therapies. Patient observations over time were also categorized into 1 of 3 HCT groups: never underwent HCT, pre-HCT, and post-HCT. However, because there is a time lag between diagnosis of AML and receipt of transplant, we split the observations of patients who eventually received a transplant into 2 additional groups: before and after receiving the transplant. This was done to understand how undergoing HCT changes QOL or function, in addition to whether patients who proceed to HCT differ from those who never undergo HCT, even before HCT. Outcomes were modeled as a function of intensive vs less-intensive groups, HCT group indicators, and time and HCT group by time interactions. Interactions between HCT group and intensity of induction therapy were also tested.
Missing data
Univariate analyses of baseline covariates for survival and mortality comparisons were based only on patients with available data. In multivariate analysis, important baseline covariates with missing data (KPS and cytogenetics) were accommodated with an indicator variable for missingness. For QOL, function, and patient-reported outcome (PRO) comparisons, we used inverse probability weighting in our models to adjust for the missing data resulting from nonresponse over time. At each time point, among all patients alive and technically eligible to contribute data at that time, we fit a model predicting the probability of having a complete QOL measure at that time. Models included prior available QOL measures and a comprehensive list of clinical and demographic variables. This model was used to generate predicted probabilities of participation in each follow-up time point for each participant, and the inverses of these probabilities were standardized to use as weights. In the models fit to participants with complete data, we used these weights as an effective means of upweighting the outcomes of the type of person who was less likely to participate at that time. Analyses incorporated robust variance estimates to account for the inclusion of weights.18
Additional method details are provided in the supplemental Data.
Results
Retrospective cohort
Patient characteristics
The median age of patients was 60 (range, 20-80) years. Recipients of less-intensive therapies were older, had higher comorbidity burdens per the augmented HCT-CI scores, and more frequently were in the 2017 ELN classification adverse risk group; hence, they more frequently had higher AML-CM scores compared with recipients of intensive therapies (Tables 1 and 2).
Characteristics of the retrospective cohort (n = 1292)
| All patients | Less intensive (n = 293) | Intensive (n = 999) | ||||
|---|---|---|---|---|---|---|
| n | % | n | % | n | % | |
| Age, y | ||||||
| 18-49 | 299 | 23 | 4 | 1 | 295 | 30 |
| 50-59 | 264 | 20 | 11 | 4 | 253 | 25 |
| 60-64 | 211 | 16 | 22 | 8 | 189 | 19 |
| 65-69 | 210 | 16 | 60 | 20 | 150 | 15 |
| 70-74 | 132 | 10 | 69 | 24 | 63 | 6 |
| 75-79 | 110 | 9 | 74 | 25 | 36 | 4 |
| 80-89 | 66 | 5 | 53 | 18 | 13 | 1 |
| Augmented HCT-CI | ||||||
| 0-1 | 158 | 12 | 19 | 6 | 139 | 14 |
| 2-3 | 339 | 26 | 46 | 16 | 293 | 29 |
| 4-5 | 292 | 23 | 64 | 22 | 228 | 23 |
| ≥6 | 350 | 27 | 101 | 34 | 249 | 25 |
| Missing | 153 | 12 | 63 | 22 | 90 | 9 |
| ELN 2017 cytogenetic risk | ||||||
| Favorable | 225 | 17 | 19 | 6 | 206 | 21 |
| Intermediate | 609 | 47 | 132 | 45 | 477 | 48 |
| Adverse | 405 | 31 | 130 | 44 | 275 | 28 |
| Missing | 53 | 4 | 12 | 4 | 41 | 4 |
| KPS | ||||||
| >70 | 789 | 61 | 191 | 65 | 598 | 60 |
| ≤70 | 256 | 20 | 88 | 30 | 168 | 17 |
| Missing | 247 | 19 | 14 | 5 | 233 | 23 |
| AML-CM | ||||||
| ≤3 | 172 | 13 | 2 | 1 | 170 | 17 |
| 4-6 | 354 | 27 | 54 | 18 | 300 | 30 |
| 7-9 | 314 | 24 | 70 | 24 | 244 | 24 |
| ≥10 | 261 | 20 | 97 | 33 | 164 | 16 |
| Missing | 191 | 15 | 70 | 24 | 121 | 12 |
| Diagnosis | ||||||
| Newly diagnosed AML | 1292 | 100 | 293 | 100 | 999 | 100 |
Comparison of risk factors in the 2 treatment-intensity groups within the retrospective cohort
| Patients, % | |||
|---|---|---|---|
| Characteristic | Less intensive | Intensive | P |
| Age ≥65 y | 87 | 26 | <.0001 |
| Age ≥75 y | 43 | 5 | <.0001 |
| Augmented HCT-CI score ≥4 | 72 | 52 | <.0001 |
| Mean augmented HCT-CI score | 5.3 | 4.2 | <.0001 |
| 2017 ELN adverse risk group | 46 | 29 | <.0001 |
| AML-CM score ≥7 | 75 | 46 | <.0001 |
| Mean AML-CM score | 9.0 | 6.5 | <.0001 |
AML-CM cytogenetics combining age, comorbidities, and ELN risk.
Survival
Almost all patients (99%) with the lowest AML-CM scores (1-3) received intensive therapies (Table 1), and therefore, patients with an AML-CM score of 1 to 3 were omitted from the comparison. We found that patients with AML-CM scores of 4 to 6, 7 to 9, and ≥10 had significantly lower 2-year survival rates and higher hazard ratios (HRs) for mortality when administered less-intensive rather than intensive therapies (Table 3; Figure 1). Results were similar in patients with missing AML-CM scores (Table 3).
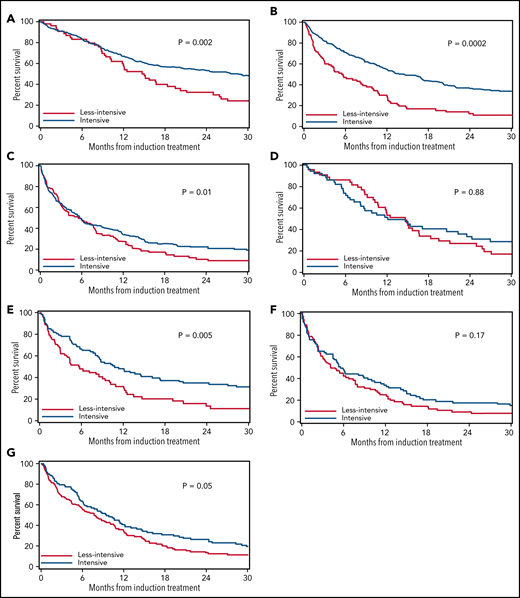
Survival rates comparing recipients of less-intensive vs intensive therapies. All patients with AML-CM scores of 4 to 6 (A), 7 to 9 (B), and ≥10 (C). Patients age ≥65 years with AML-CM scores of 4 to 6 (D). 8 to 9 (E). and ≥10 (F). (G) Patients age 70 to 79 years with AML-CM scores of ≥4.
Survival rates comparing recipients of less-intensive vs intensive therapies. All patients with AML-CM scores of 4 to 6 (A), 7 to 9 (B), and ≥10 (C). Patients age ≥65 years with AML-CM scores of 4 to 6 (D). 8 to 9 (E). and ≥10 (F). (G) Patients age 70 to 79 years with AML-CM scores of ≥4.
Survival rates and HRs for mortality in recipients of less-intensive vs intensive induction therapies within the retrospective cohort
| 2-y OS, % | Unadjusted | Adjusted for HCT as time-dependent covariate | ||||
|---|---|---|---|---|---|---|
| AML-CM | Less intensive | Intensive | HR (95% CI) | P | HR (95% CI) | P |
| 4-6 | 29 | 56 | 1.82 (1.25-2.63) | .002 | 1.82 (1.25-2.63) | .002 |
| 7-9 | 17 | 36 | 1.79 (1.32-2.44) | .0002 | 1.67 (1.22-2.27) | .002 |
| ≥10 | 8 | 22 | 1.43 (1.08-1.89) | .01 | 1.32 (0.99-1.72) | .06 |
| Missing | 24 | 49 | 2.04 (1.37-3.13) | .0006 | — | — |
Comparisons stratified according to AML-CM score. No comparisons were performed for patients with AML-CM score ≤3 because 99% received intensive therapies. HR comparisons are both unadjusted and adjusted for undergoing allogeneic HCT as time-dependent covariate. Higher HR indicates increased mortality with less-intensive therapies.
OS, overall survival.
Allogeneic HCT as a potential confounding factor
Patients receiving less-intensive therapies were less likely to receive allogeneic HCT regardless of whether they had AML-CM scores of 4 to 6 (HR, 0.40; 95% confidence interval [CI], 0.22-0.72; P = .002), 7 to 9 (HR, 0.29; 95% CI, 0.14-0.63; P = .002), or ≥10 (HR, 0.29; 95% CI, 0.13-0.65; P = .003).
Using a competing-risk Cox regression model with HCT as a time-dependent covariate, associations between less-intensive therapies and higher HRs for mortality remained statistically significant (Table 3).
Patients age 70 to 79 years
Of patients age 70 to 79 years (n = 245), none had AML-CM scores of ≤2, and only 3 had a score of 3; 51 did not have available scores. Among the remaining 191 patients with known AML-CM scores of ≥4, 55% received less-intensive and 45% received intensive therapies. Survival rates were lower (11% vs 24%; Figure 1D) and HRs for mortality were statistically significantly higher (HR, 1.38; 95% CI, 1.00-1.90; P = .05) in association with receiving less-intensive therapies.
We performed a similar analysis for patients age ≥65 years with AML-CM scores of ≥4. HR for mortality was 1.40 (95% CI, 1.05-1.87; P = .02) after less-intensive therapies. Among patients age <65 years, HR for mortality was 1.79, and there was no statistical evidence that the effect of more- vs less-intensive therapies differed according to age <65 vs ≥65 years (P = .50).
Prospective cohort
Patient characteristics
The prospective cohort included 692 patients, 21% of whom received less-intensive regimens. Similar to the retrospective cohort, within the prospective cohort, recipients of less-intensive therapies were older, had more comorbidities, and were more often in the ELN adverse risk group. Hence, they more frequently had higher AML-CM scores compared with recipients of intensive therapies (Tables 4 and 5).
Characteristics of the prospective cohort (n = 692)
| All patients, % | Less intensive, % | Intensive, % | |
|---|---|---|---|
| Age, y | |||
| 18-49 | 22 | 5 | 95 |
| 50-59 | 21 | 8 | 92 |
| 60-64 | 14 | 10 | 90 |
| 65-69 | 19 | 21 | 79 |
| 70-74 | 14 | 42 | 58 |
| 75-79 | 9 | 71 | 29 |
| ≥80 | 1 | 83 | 17 |
| Augmented HCT-CI | |||
| 0-1 | 15 | 14 | 86 |
| 2-3 | 29 | 17 | 83 |
| 4-5 | 23 | 21 | 79 |
| ≥6 | 33 | 24 | 76 |
| 2017 ELN cytogenetic risk | |||
| Favorable | 21 | 12 | 88 |
| Intermediate | 43 | 17 | 83 |
| Adverse | 36 | 31 | 69 |
| KPS | |||
| >70 | 83 | 16 | 84 |
| ≤70 | 17 | 45 | 55 |
| AML-CM | |||
| 0-3 | 13 | 6 | 94 |
| 4-6 | 32 | 15 | 85 |
| 7-9 | 32 | 25 | 75 |
| ≥10 | 23 | 32 | 68 |
| Diagnosis | |||
| Newly diagnosed AML | 77 | 18 | 82 |
| Relapsed/refractory AML | 14 | 21 | 79 |
| High-risk MDS | 9 | 44 | 56 |
| Status posttreatment | |||
| Never achieved CR | 44 | 34 | 66 |
| Achieved CR | 56 | 11 | 89 |
CR, complete remission; MDS, myelodysplastic syndrome.
Comparison of baseline main characteristics and PRO and geriatric measures between recipients of less-intensive vs intensive regimens within the prospective cohort with AML-CM score ≥4
| Less intensive | Intensive | P | |
|---|---|---|---|
| Baseline main characteristics | |||
| Age ≥65 y | 80 | 33 | <.0001 |
| Age ≥75 y | 32 | 3 | <.0001 |
| Augmented HCT-CI score ≥4 | 64 | 54 | .04 |
| Mean augmented HCT-CI score | 5.0 | 4.2 | .006 |
| 2017 ELN adverse risk group | 53 | 31 | <.0001 |
| AML-CM score ≥7 | 73 | 50 | <.0001 |
| Mean AML-CM score | 8.7 | 6.8 | <.0001 |
| Cumulative incidence of achieving CR | 44 | 82 | <.0001 |
| PRO and geriatric measures | |||
| Fried frailty index score >0 (prefrail + frail) | 56 | 66 | .16 |
| Fried frailty index score 3-5 (frail) | 0 | 3 | .18 |
| BOMC ≥6 (moderate/severe impairment)* | 31 | 23 | .17 |
| Geriatric (other, yes/no)* | 32 | 36 | .58 |
| Geriatric (falls, yes/no)* | 18 | 12 | .25 |
| Walk test >0.8 m/s | 45 | 48 | .58 |
| PHQ-9 depression ≥10 (depressed) | 36 | 33 | .67 |
| PHQ-9 major depressive disorder (without functional impairment) | 16 | 17 | .80 |
| PHQ-9 major depressive disorder (with functional impairment) | 8 | 7 | .69 |
| ADL <14 (dependent) | 38 | 24 | .01 |
| IADL <14 (dependent) | 63 | 53 | .10 |
| BOMC | 4.1 (4.4) | 3.2 (3.9) | .17 |
| Geriatric (vision)* | 2.0 (0.8) | 1.9 (0.7) | .22 |
| Geriatric (hearing)* | 2.0 (0.9) | 1.9 (0.8) | .40 |
| KPS | 74 (16) | 80 (11) | <.0001 |
| Walk test mean time | 6.0 (4.0) | 5.8 (3.5) | .74 |
| FACT-PWB (average) | 2.8 (1.0) | 2.7 (0.9) | .55 |
| FACT-SWB (average) | 3.5 (0.6) | 3.4 (0.7) | .34 |
| FACT-EWB (average) | 2.8 (0.8) | 2.9 (0.8) | .52 |
| FACT-FWB (average) | 2.3 (1.0) | 2.1 (0.9) | .06 |
| FACT-G | 72 (18) | 71 (15) | .82 |
| EQ5D-Index | 0.78 ((0.19) | 0.78 (0.19) | .80 |
| SAL score | 2.0 (1.0) | 2.0 (1.0) | .88 |
| Social support | 30 (4.9) | 30 (4.8) | .90 |
| PHQ-9 depression | 7.6 (5.5) | 7.7 (5.6) | .95 |
Data are given as % or mean (standard deviation).
ADL, activities of daily living; BOMC, Blessed Orientation Memory Concentration; CR, complete remission; EQ5D, EuroQoL 5-dimensional health-related quality of life assessment; FACT-EWB, Functional Assessment of Cancer Therapy–Emotional Well-Being; FACT-FWB, Functional Assessment of Cancer Therapy–Functional Well-Being; FACT-G, Functional Assessment of Cancer Therapy–General; FACT-PWB, Functional Assessment of Cancer Therapy–Physical Well-Being; FACT-SWB, Functional Assessment of Cancer Therapy–Social Well-Being; IADL, instrumental activities of daily living; PHQ-9, Patient Health Questionnaire-9; SAL, Study Alliance Leukemia.
These tests were administered only to patients age ≥60 years per study protocol.
Patient-reported measures
When assessed prospectively by PROs, including QOL and various geriatric assessments, the 2 treatment groups were not statistically significantly different, except for more impaired activities of daily living (38% vs 24%; P = .01) in the less-intensive therapy group (Table 5).
Recipients of less-intensive and intensive therapies similarly (69% and 82%) ranked cure as more important than longer life or better QOL as their primary goal (Table 6). Analogously, 49% of less-intensively treated patients ranked cure as more important than QOL vs 30% who ranked QOL over cure, with 21% ranking these equally.
Patient preferences for treatment objectives and patient vs physician perceptions of chance of cure among patients with AML-CM ≥4 according to therapy given
| Patients, % | ||||
|---|---|---|---|---|
| Objective ranking* | First | Second | Third | P |
| Cure | .02 | |||
| Less intensive | 69 | 15 | 16 | |
| Intensive | 82 | 9 | 9 | |
| QOL | .03 | |||
| Less intensive | 44 | 42 | 13 | |
| Intensive | 33 | 42 | 25 | |
| LOL | .77 | |||
| Less intensive | 33 | 24 | 42 | |
| Intensive | 32 | 28 | 40 | |
| More important objective | ||||
| Cure vs QOL | Cure | Equal | QOL | .0004 |
| Less intensive | 49 | 21 | 30 | |
| Intensive | 63 | 25 | 13 | |
| Cure vs LOL | Cure | Equal | LOL | .16 |
| Less intensive | 56 | 24 | 20 | |
| Intensive | 63 | 25 | 12 | |
| QOL vs LOL | QOL | Equal | LOL | .23 |
| Less intensive | 54 | 25 | 21 | |
| Intensive | 45 | 26 | 30 | |
| Chance of cure | Good (>74) | Maybe (25-74) | Poor (<25) | |
| Patient belief | .0006 | |||
| Less intensive | 48 | 42 | 10 | |
| Intensive | 67 | 29 | 3 | |
| Physician belief | <.0001 | |||
| Less intensive | 1 | 33 | 66 | |
| Intensive | 7 | 71 | 21 | |
LOL, length of life.
First indicates highest preference.
Physician-assigned measures
Physician-assigned KPS was lower in recipients of less-intensive therapies (Table 5). Recipients of less-intensive therapies were assigned a lower chance of cure by both physicians and patients. In general, physician estimates of chance of cure were lower than patient estimates, regardless of regimen intensity.
Correlations between increasing age and physician-assigned measures
Correlation analyses showed an r of 0.31 (P < .0001) between increasing age and decreasing chance of cure as assigned by physicians and an r of 0.14 (P = .001) between increasing age and decreasing physician-assigned KPS percentage.
Survival
As in the retrospective cohort, survival rates were lower and HRs for mortality were higher for recipients of less-intensive therapies regardless of AML-CM risk group. However, after adjusting for additional age cutoffs (65-69, 70-74, and ≥75 years), physician-assigned KPS, and physician perception of chance of cure, there were no statistically significant differences in HRs for mortality between the 2 groups (Table 7).
Survival rates and HRs for mortality in recipients of less-intensive vs intensive induction therapies within the prospective cohort
| 2-y adjusted OS, % | ||||
|---|---|---|---|---|
| Model no.* | Less intensive | Intensive | HR (95% CI) | P |
| 1 | ||||
| AML-CM | ||||
| ≤3 | — | 74 | — | — |
| 4-6 | 32 | 52 | 2.44 (1.43-4.17) | .001 |
| 7-9 | 22 | 38 | 1.47 (1.00-2.13) | .05 |
| ≥10 | 12 | 23 | 1.64 (1.11-2.44) | .01 |
| 2 | ||||
| AML-CM | ||||
| 4-6 | 34 | 52 | 1.92 (0.96-3.70) | .06 |
| 7-9 | 41 | 38 | 0.88 (0.56-1.39) | .60 |
| ≥10 | 16 | 22 | 2.47 (0.79-2.13) | .31 |
| 3 | ||||
| AML-CM | ||||
| 4-6 | 48 | 52 | 1.32 (0.58-3.03) | .52 |
| 7-9 | 50 | 38 | 0.67 (0.39-1.14) | .14 |
| ≥10 | 20 | 22 | 1.14 (0.66-1.96) | .64 |
| 4 | ||||
| Age, y | ||||
| 60-69 | 34 | 38 | 1.10 (0.68-1.79) | .70 |
| ≥70 | 21 | 22 | 1.03 (0.68-1.56) | .68 |
| 5 | ||||
| Age, y | ||||
| 60-69 | 40 | 37 | 0.89 (0.53-1.49) | .66 |
| ≥70 | 27 | 22 | 0.82 (0.49-1.35) | .44 |
Comparisons stratified according to AML-CM score 4-6, 7-9, and ≥10. No comparisons were performed for patients with AML-CM score ≤3 because all received intensive therapies. Higher HR indicates increased mortality with less-intensive therapies. Overall survival (OS) rates compare adjusted rates, so survival rates of less-intensive recipients were adjusted for characteristics of recipients of intensive therapies per previously published methods.17
Models adjusted as follows: model 1, adjusted for diagnosis (newly diagnosed AML, relapsed/refractory AML, high-risk myelodysplastic syndrome [MDS]), closely resembling comparison in retrospective cohort; model 2, adjusted for diagnosis (newly diagnosed AML, relapsed/refractory AML, high-risk MDS), age (65-69, 70-74, ≥75 y), and KPS (≤70%, 75% to 100%); model 3, adjusted for diagnosis (newly diagnosed AML, relapsed/refractory AML, high-risk MDS), age (65-69, 70-74, ≥75 y), KPS (≤70%, 75% to 100%), and physician perception of cure chance (≥50%, 25% to 49%, 10% to 24%, <10%, missing); model 4, adjusted for diagnosis (newly diagnosed AML, relapsed/refractory AML, high-risk MDS), KPS (≤70%, 75% to 100%), and AML-CM (4-6, 7-9, ≥10); and model 5, adjusted for diagnosis (newly diagnosed AML, relapsed/refractory AML, high-risk MDS), KPS (≤70%, 75% to 100%), physician perception of cure chance (≥50%, 25% to 49%, 10% to 24%, <10%, missing), and AML-CM (4-6, 7-9, ≥10).
QOL and function
Comparisons of longitudinal changes in QOL and function over time of 2 years (Table 8) showed no differences between the 2 intensity groups, except for better Functional Assessment of Cancer Therapy–General scale values among those with AML-CM scores of 4 to 6 and worse frailty per walk test among those with AML-CM scores of ≥10 in less-intensive vs intensive groups.
Comparisons of ORs for longitudinal changes in QOL and function >2 y compared with baseline values in recipients of less-intensive vs intensive initial therapies
| QOL and function by AML-CM | OR | 95% CI | P |
|---|---|---|---|
| Better FACT-G (>mean ± SD) | |||
| 4-6 | 2.33 | 1.06-5.00 | .04 |
| 7-9 | 1.56 | 0.76-3.23 | .22 |
| ≥10 | 1.45 | 0.64-3.23 | .38 |
| Better EQ-5D (>33rd percentile) | |||
| 4-6 | 1.64 | 0.80-3.33 | .18 |
| 7-9 | 1.67 | 0.82-3.45 | .16 |
| ≥10 | 0.63 | 0.31-1.25 | .18 |
| Better PHQ9 (score <10) | |||
| 4-6 | 1.75 | 0.76-4.00 | .19 |
| 7-9 | 1.33 | 0.60-2.94 | .48 |
| ≥10 | 1.37 | 0.66-2.78 | .40 |
| Better IADL (score, 14) | |||
| 4-6 | 1.11 | 0.62-2.00 | .72 |
| 7-9 | 1.08 | 0.63-1.89 | .79 |
| ≥10 | 0.45 | 0.16-1.25 | .13 |
| Better ADL (score, 14) | |||
| 4-6 | 0.72 | 0.36-1.45 | .36 |
| 7-9 | 1.23 | 0.67-2.27 | .50 |
| ≥10 | 0.8 | 0.39-1.64 | .54 |
| Better walk test (≥0.8 m/sec) as marker of frailty | |||
| 4-6 | 0.96 | 0.39-2.33 | .93 |
| 7-9 | 0.67 | 0.33-1.35 | .27 |
| ≥10 | 0.45 | 0.20-1.01 | .05 |
Comparisons stratified according to AML-CM score 4-6, 7-9, and ≥10. No comparisons were performed for patients with AML-CM score ≤3 because all received intensive therapies. Odds ratio (OR) comparisons are both unadjusted and adjusted for undergoing allogeneic HCT as time-dependent covariate. Higher OR means better outcomes for less-intensive therapies; lower OR means worse outcomes for less-intensive therapies.
ADL, activities of daily living; EQ5D, EuroQoL 5-dimensional health-related quality of life assessment; FACT-G, Functional Assessment of Cancer Therapy–General; IADL, instrumental activities of daily living; PHQ-9, Patient Health Questionnaire-9.
When we repeated the same analyses but restricted them to patients who were age either ≥65 or ≥70 years, we again did not find differences between the 2 intensity groups, except for worse walk test results (increased frailty) after less-intensive therapies for patients with AML-CM scores of ≥10 (age 65 years: HR, 0.43; 95% CI, 0.18-1.02; P = .05; and age ≥70 years: HR, 0.21; 95% CI, 0.07-0.21; P = .01).
Sensitivity analyses
In patients age 70 to 79 years with AML-CM scores of ≥7, adjusted models showed no statistical difference in HR for mortality (HR, 1.16; 95% CI, 0.76-1.77; P = .48) between those receiving less-intensive and intensive therapies. For patients age 70 to 79 years with AML-CM scores of 4 to 6, HR was 1.64 (95% CI, 0.73-3.68; P = .23). Statistical tests assessing a potential interaction between the effect of intensity (less intensive vs intensive) and the effect of AML-CM score (4-6 vs ≥7) were not significant (P = .80), suggesting the lack of effect of intensity of therapy on survival was similar in these 2 AML-CM groups.
Among patients with secondary AML, less-intensive therapies were associated with higher HR for mortality (HR, 1.70) compared with those receiving intensive therapies. Among patients with de novo AML, HR for mortality was 2.11. However, an interaction test between intensity and type of AML was not statistically significant (P = .64; ie, there was little evidence that treatment effect varied in patients with or without secondary AML).
Overall, recipients of less-intensive therapies spent less time in the hospital than recipients of intensive therapies (P < .0001) within the first 3 months after beginning therapy, with medians of 16.6 and 37.4 days, respectively.
Additional result details are provided in the data supplement.
Discussion
There is an increasing trend to treat older patients with less-intensive therapies based on the assumption that they will neither tolerate nor benefit from intensive therapies.19-22 This led us to compare survival, QOL, and time spent in the hospital among recipients of less-intensive and intensive therapies. We evaluated consecutive retrospective and prospective cohorts treated over 11 years at multiple US centers. In none of our comparisons did patients with AML have survival benefits after less-intensive therapies, regardless of the degree of their medical unfitness as captured by a validated model13,15 and comprehensive QOL and geriatric assessment tools. Nor could we identify benefits in QOL or functional status after less-intensive therapies. These results were true even when we restricted the analyses to patients age either ≥65 or 70 to 79 years (57% of whom received less-intensive therapies) regardless of whether they had AML-CM scores of ≥4 or ≥7. However, time spent in the hospital affects QOL, even if not formally taken into account, and here there was an advantage for less-intensive therapies.
As expected, the use of less-intensive therapies was more frequent with increasing age. With increasing age, there was also the expected increase in comorbidity burdens23 and adverse cytogenetic/molecular abnormalities.14 Previously, we identified age, comorbidities, and cytogenetic/molecular risk factors as important predictors of mortality and incorporated them into the validated AML-CM. Hence, we compared survival between less-intensive and intensive therapies within separate AML-CM risk groups. These comparisons, in both the retrospective and prospective study cohorts, showed better survival rates after intensive therapies. This was true even among the AML-CM group with the oldest age, highest comorbidity burden, and most adverse cytogenetic risks (AML-CM scores of ≥10; Figure 1; Tables 3 and 7). A great majority of younger patients in our analyses had AML-CM scores <4 and were administered intensive chemotherapy. By restricting our analyses to those with scores ≥4, we thus excluded younger patients unless they had comorbidities, fitting the definition of medically infirm as a distinctively interesting group to study given the lack of literature on outcomes of these patients.
Baseline (Tables 4 and 5) and outcome findings in the prospective cohort (Table 7) mirrored those in the retrospective cohort. However, the prospective cohort allowed us to test other variables and thus potentially gain a better understanding of the decision-making process used to choose treatment intensity for these AML patients. After using a variety of validated objective tools to measure differences between the 2 treatment groups, the only meaningful difference we could find was a small difference in the degree of activities of daily living impairment (38% vs 24%, respectively). In contrast, much greater (and highly statistically significant) differences were found in physician-assigned KPS and perception of cure; both were judged as poorer in the less-intensive group, and each correlated with increasing age (supplemental Figure 3). The contrast between findings based on objective measures of health status and those based on subjective evaluations by physicians could have 1 of 2 explanations. First, physicians may have seen characteristics not captured by the usual objective measures and thus assigned worse KPS and lower chance of cure to less-intensively treated patients. Although subjective (“I know it when I see it”), these characteristics were relevant to survival, because accounting for them in multivariate analyses eliminated the previously seen favorable effect of intensive treatment on survival (Table 7). However, it is also plausible that physicians assigned poorer KPS and less chance for cure primarily because of the older age of patients. Thus, those older patients automatically became candidates for less-intensive therapies, resulting in poorer unadjusted outcomes (supplemental Figure 4). A randomized trial would be needed to distinguish between these possibilities. Additionally, patients age ≥75 years with AML-CM scores of ≥10, who were poorly represented in our cohort (n = 5), could also preferentially be candidates for less-intensive therapies to benefit from fewer hospitalizations.
We recognize that QOL also plays an important role in the decision between less-intensive and intensive therapies. However, comparisons focusing on QOL and function over time also failed to find any major benefit of less-intensive over intensive therapies. Our results support previous observations of a lack of benefit of less-intensive therapies in QOL outcomes.24 Our patient surveys indicated that those receiving less-intensive therapies valued cure as their most important goal, rather than QOL or length of life. However, our results suggest that none of these outcomes benefitted from the choice of less-intensive therapies, even in patients with the oldest age and highest AML-CM scores, with the important exception of a median of 3 weeks less time spent in the hospital for recipients of less-intensive therapies.
In 2 previous randomized controlled trials (RCTs), patients were randomized between azacitidine as a less-intensive therapy and conventional care regimens that included 3 treatment options with varying degrees of intensity: intensive chemotherapy, low-dose cytarabine, or supportive care.25,26 Both studies showed a statistically significant survival advantage after azacitidine compared with conventional care regimens. However, neither RCT was powered to detect differences in survival between azacitidine and intensive chemotherapy, and perhaps as a result, these comparisons showed no statistically significant differences. Additionally, the type of conventional care regimen that was preselected for each patient before randomization was based mostly, again, on PS, which has been shown to be vastly inferior to more objective metrics, such as the AML-CM13 or geriatric assessment,27-29 when assessing patient fitness for therapy.
Currently, www.clinicaltrials.gov shows 22 ongoing trials using less-intensive therapies vs 11 using intensive therapies for older AML patients, attesting to uncertainty about the most appropriate treatment approach for these patients. Our study addresses this uncertainty by comparing survival, QOL, and hospitalization after less-intensive vs intensive therapies in older and/or medically infirm patients. Although less time spent in the hospital is a valid reason to prefer less-intensive therapies, survival is clearly suboptimal with either less-intensive or intensive therapies, recognizing that even patients receiving less-intensive therapies considered cure their principal goal. One possible means to approach this goal or at least to produce greater survival improvements is via trials combining intensive and less-intensive therapies. For example, midostaurin plus traditional "cytarabine, and anthracycline" or the 7 + 3 combination improved survival compared with 7 + 3 alone,30 even in patients up to age 70 years.31 Similarly, gemtuzumab ozogamicin added to intensive chemotherapy was more effective than either used alone.32,33 Advances in supportive care have led to declining treatment-related mortality rates after the use of intensive therapies,34-36 making combinations of intensive and less-intensive therapies more plausible, even in older and more infirm patients, while continuing to consider possible effects on time spent in the hospital.
Comorbidity burdens, as captured by a systematic and valid comorbidity index, are an important assessment of patient vulnerability37 and are independent of functional status.13,38,39 In AML, comorbidities are potentially more accurate predictors of outcomes than age or PS. Nonetheless, most AML studies have not measured or adjusted for comorbidities.40 A number of comorbidities present in AML at diagnosis (eg, infections) could be due to or aggravated by AML. In this setting, effectiveness of the induction therapy becomes critical to overcome AML and its associated comorbidities. The AML-CM allowed us to compare regimen intensities within comparable risk groups based on age, comorbidities, and cytogenetic/mutational data. It includes scores for the augmented HCT-CI that was previously tested and validated in AML, capturing any form of organ dysfunction. The inclusion of the augmented HCT-CI resulted in increased mortality (patients with augmented HCT-CI scores of ≥5 had ∼20% day-28 mortality and ∼60% 1-year mortality rates).13 Still, future improvements in comorbidity assessment for AML to capture patients with more severe organ dysfunction could further improve stratifications for treatment outcomes. Another important measure of patient vulnerability is geriatric assessment including measures of frailty, physical, and cognitive function, which have been shown to predict survival.27-29 Accounting for comorbidities and geriatric assessment in the current study allowed for more informed and objective treatment comparisons. Furthermore, future assessments of outcomes could benefit from adding information on next-generation sequencing mutational analyses and minimal residual disease assessment.
Our study has limitations. Comparisons were not based on randomization. However, the goal of our study was to examine clinical practice in a variety of academic centers to assess whether a randomized study is needed. Additionally, we focused on induction therapies and disregarded postremission therapies other than HCT. This is likely an oversimplification that resulted from the wide variety of postremission therapies used at the centers participating in our study. Furthermore, our study predated the approval of newer agents such as venetoclax and glasdegib. However, improvements in survival with these newer agents compared with standard less-intensive therapies, while statistically significant, have been less obviously clinically significant. For example, randomization to venetoclax plus azacitidine rather than azacitidine alone improved median survival from 9 to 15 months41 ; likewise, randomization to venetoclax plus low-dose cytarabine rather than low-dose cytarabine alone increased median survival from 4.1 to 8.4 months.42 Similarly, a randomized trial comparing low-dose cytarabine with or without glasdegib found that addition of the latter improved median survival only from 4.3 to 8.3 months.43 Hence, it does not seem that introduction of these newer agents changed practice in a way to obviate the need for a randomized trial to better understand the role of intensity in management of AML.
Missing data are another limitation; however, missing data were balanced between the 2 treatment groups and were not related to increasing age (data not shown), suggesting that they were missing at random.
Additionally, the oldest patient group (age ≥75 years) accounted for only 10% of both our retrospective and prospective cohorts. This probably reflects limited referral of older patients to AML-treating centers, as has been previously suggested,44 which of course introduces the likelihood of selection bias. For example, in the prospective study, physicians may have steered patients they subjectively, but perhaps accurately, considered the sickest away from more-intense therapies. Nonetheless, many of those older patients were enrolled in clinical trials that typically exclude patients with comorbidities and other causes of selection bias.
Finally, our study included results from a large number of sites where experiences vary (monthly referral rate ranged between 2 and 16 patients). However, adjusting for sites as a variable did not change results (data not shown), and the multicenter experience suggests generalizability of results to at least those US patients treated in academic centers. Nonetheless, there could be centers with less frequent referral rates and different experiences from those we observed.
This study has several important implications. First, an RCT is greatly needed in older patients with AML who have high AML-CM scores (≥7 with 2-year survival rates <40% regardless of treatment intensity) to systemically test the benefit of combining novel less-intensive with intensive therapies vs either therapy alone. Results should address a major portion of current physician uncertainty about selection of therapy.45 Such a study should have the following criteria: be multicenter; allow use of the newest intensive and less-intensive treatments in the randomized comparisons while acknowledging center preferences for specific low- and high-intensity therapies; avoid comparing regimens with supportive care or with agents with known inferior outcomes, such as low-dose cytarabine; and consider an arm where a combination of intensive and less-intensive therapies is tested to see if that combination provides the highest benefit (hence creating a precedent to be followed in the future). Second, routine integration of comorbidity and geriatric assessments into the assessment of all AML patients age ≥65 years is critical to provide physicians with a more objective and reliable means to estimate health burden and select appropriate therapies.46,47 Our study is a real-time practical demonstration of the value of following consensus guidelines from multiple societies about the routine use of a geriatric assessment for older patients with cancer.48-51 Third, older patients with a new diagnosis of AML and their physicians should be made explicitly aware of the need to look beyond age when making decisions about induction therapy to minimize ageism.52 As described by Schiffer,53 the informed consent process should, unlike today, explicitly note the likely results with standard therapy. Finally, pending an RCT, combinations of intensive and less-intensive therapies should play an increasing role in the treatment of older AML patients both routinely and in clinical trials, with attention to the effects on each of survival and QOL, with time in the hospital incorporated into the latter.
This is not an intervention clinical trial. There is no data sharing plan for study because the requirements by the International Committee of Medical Journal Editors are not applicable to this study.
The online version of this article contains a data supplement.
There is a Blood Commentary on this article in this issue.
The publication costs of this article were defrayed in part by page charge payment. Therefore, and solely to indicate this fact, this article is hereby marked “advertisement” in accordance with 18 USC section 1734.
Acknowledgments
The authors are grateful to all research nurses and data coordinators for implementation of protocols. The authors also thank the administrative staff for their assistance with manuscript preparation. The authors are grateful to the many physicians, nurses, physician assistants, nurse practitioners, pharmacists, and support staff who cared for the patients and to the patients who allowed us to care for them and who participated in our ongoing clinical research. The authors also thank Helen Crawford, Tammy Schuler, Sophie Fluent, and Indira Ongarbaeva for their help in assembling data and preparing the manuscript.
Research reported in this article was funded in part by a Patient-Centered Outcome Research Institute award (CE-1304-7451), a Research Scholar Grant from the American Cancer Society (RSG-13-084-01-CPHPS), and an American Society for Hematology Bridge Award.
The funding organizations had absolutely no role in the design or conduct of the study; collection, management, analysis, or interpretation of the data; or preparation, review, or approval of the manuscript. The statements and findings in this article are solely the responsibility of the authors and do not necessarily represent the views of any funding organization, neither the Patient-Centered Outcomes Research Institute, its board of governors, or its methodology committee; the American Cancer Society; nor the America Society of Hematology.
Authorship
Contribution: M.L.S. and E.H.E. conceptualized and designed the study; M.L.S., A.T.F., A.B., A.T.G., M.A.S., S.M., B.C.M., E.S.W., P.V., P.J.S., E.P., M.E., K.A., S.L., M.R.B., D.R., T.M.W., J.K., J.S., M.G., K.K., J.E.N., P.S.B., J.S.M., S.J.L., B.M.S., F.R.A., and E.H.E. acquired, analyzed, or interpreted the data; M.L.S. drafted the manuscript. M.L.S., A.T.F., A.B., A.T.G., M.A.S., S.M., B.C.M., E.S.W., P.V., P.J.S., E.P., M.E., K.A., S.L., M.R.B., D.R., T.M.W., J.K., J.E.N., P.S.B., J.S.M., S.J.L., B.M.S., F.R.A., and E.H.E. critically revised the manuscript for important intellectual content; B.E.S., W.L., and L.O. performed statistical analyses; M.L.S. obtained funding; and M.L.S. and E.H.E. supervised the study.
Conflict-of-interest disclosure: M.L.S. reports consultancy for and honorarium from Jazz Pharmaceuticals. A.T.F. has provided consulting for Celgene/Bristol-Myers Squibb, Novartis, Agios, Astellas, Pfizer, Takeda, Amgen, Daiichi Sankyo, Kite, Trovagene, Forty Seven, NewLink Genetics, Seattle Genetics, Blueprint, Trillium, and AbbVie and received clinical trial support from Celgene and Agios. A.B. reports consulting for Novartis, Celgene/Bristol-Myers Squibb, Takeda, Jazz Pharmaceuticals, and Forty Seven and clinical trial support from Novartis, AstraZeneca, Celgene/Bristol-Myers Squibb, Takeda, and GlaxoSmithKline. A.T.G. reports grants from the Patient-Centered Outcome Research Institute during the conduct of the study and personal fees from AstraZeneca, Incyte, and CTI BioPharma outside the submitted work. P.J.S. reports clinical research support from or data safety monitoring board participation for Amgen, Aptevo, Cantex, and Chimerix; scientific advisory board participation, consultancy, or expert witness services for AbbVie, Agios, and Jazz Pharmaceuticals; and employment/governing board participation for, patent with, equity in, or royalties for panel member or dependent from JSK Therapeutics and Lone Star Thiotherapies Takeda. S.L. reports receiving honoraria from Daiichi-Sankyo, Pfizer, Bristol-Myers Squibb, Acceleron, and Agios and research funding from Onconova, Kura, Hoffman La Roche, Ariad, and Biosight. T.M.W. has received research funding from Janssen and consulted for Carevive Systems and Seattle Genetics. P.S.B. reports research support (to institution) from AbbVie, Bristol-Myers Squibb, Cardiff Oncology, Glycomimetics, JW Pharmaceutical, Novartis, Pfizer, SecuraBio, and Tolero; an advisory role for Accordant Health Services/Caremark; speaker services for France Foundation; and consultancy for CVS Caremark and McKesson. The remaining authors declare no competing financial interests.
Correspondence: Mohamed L. Sorror, Clinical Research Division (D5-285), Fred Hutchinson Cancer Research Center, 1100 Fairview Ave North, Seattle, WA 98109-1024; e-mail: msorror@fredhutch.org.

This feature is available to Subscribers Only
Sign In or Create an Account Close Modal