

Key Points
Estimated overall survival is 14.5 years for very young patients with MM.
High-risk cytogenetics is a reliable predictor of adverse outcome for very young patients with MM.

Abstract
Multiple myeloma (MM) is rare in young patients, especially before age 40 years at diagnosis, representing <2% of all patients with MM. Little is known about the disease characteristics and prognosis of these patients. In this study, we examined 214 patients diagnosed with MM at age ≤40 years over 15 years, in the era of modern treatments. Among them, 189 patients had symptomatic MM. Disease characteristics were similar to older patients: 35% had anemia, 17% had renal impairment, and 13% had hypercalcemia. The staging was ISS-1 in 52.4%, ISS-2 in 27.5%, and ISS-3 in 20.1%. Overall, 18% of patients had high-risk cytogenetics [del 17p and/or t(4;14)]. Ninety percent of patients received intensive chemotherapy followed by autologous stem cell transplant, and 25% of patients had allogeneic stem cell transplant predominantly at time of relapse. The median follow-up was 76 months, the estimated median overall survival was 14.5 years, and the median progression free-survival was 41 months. In multivariate analysis, bone lesions (hazard ratio [HR], 3.95; P = .01), high ISS score (HR, 2.14; P = .03), and high-risk cytogenetics (HR, 4.54; P < .0001) were significant risk factors for poor outcomes. Among predefined time-dependent covariables, onset of progression (HR, 13.2; P < .0001) significantly shortened overall survival. At 5 years, relative survival compared with same age- and sex-matched individuals was 83.5%, and estimated standardized mortality ratio was 69.9 (95% confidence interval, 52.7-91.1), confirming that MM dramatically shortens the survival of young patients despite an extended survival after diagnosis.
Introduction
Multiple myeloma (MM) is a rare and malignant disease with a median age of diagnosis of ∼70 years.1 Less than 2% of patients are diagnosed before 40 years of age, and minimal data are only available from small cohorts.2 Disease characteristics, prognostic factors, and outcomes are poorly described. It remains unclear if there are some peculiarities related to a young age of MM diagnosis.3-8 Despite continuous improvements in the treatment of MM, no standard of care has been established for this specific population, and the role of allogeneic hematopoietic stem cell transplant (allo-HSCT) is still debated.9,10 We present here a large retrospective cohort of patients diagnosed with MM before 40 years of age, in the era of modern treatments. The aims of our study were to describe baseline disease characteristics and to determine the prognostic factors of overall survival (OS) in these patients.
Materials and methods
Patient selection
From the prospective plasma cell dyscrasia cytogenetic database of the Intergroupe Francophone du Myélome (IFM; H. Avet-Loiseau, CHU Toulouse, Toulouse, France), we identified 214 adult patients (aged ⩾18 years) who were 40 years old or younger at time of diagnosis of MM between January 1, 2000, and December 31, 2015. Patients diagnosed with smoldering myeloma (SMM), primary plasma-cell leukemia (pPCL), and solitary plasmacytoma were also included in the descriptive cohort. Patients with other gammopathies such as monoclonal gammopathy of undetermined significance or amyloidosis were excluded (supplemental Figure 1, available on the Blood Web site). Clinical and laboratory data were then collected from medical records to gather information on diagnosis, therapies, progression, and/or death.
Patients’ nonopposition to the use of data for research purposes was specified at diagnosis. The IFM database is declared to the Commission Nationale Informatique des Libertés (CNIL) with authorization number CNIL DR-2017-344. Patients gave informed consent, as per the Declaration of Helsinki.
Statistical analysis
Demographic, clinical, biological, cytogenetic, treatment, response, and survival data were collected for descriptive analysis. Data were coded as “ND” when missing, and “NA” when nonapplicable to the patient. The data recovery rate was calculated as the ratio between valid data and required data, excluding NA from the missing data. Results were only assessed for the valid data. Summary statistics (mean and range) were calculated for continuous data. Response to treatment was assessed according to International Myeloma Working Group guidelines.11
Survival analyses were performed in the population of patients with symptomatic MM (supplemental Figure 2). Survival was estimated from diagnosis to the date of death or last follow-up by using the Kaplan-Meier method in univariate analysis. Results are expressed according to median survival with interquartile ranges (IQRs). For each variable, the impact on survival analysis was estimated by using a Cox regression model. Multivariate analysis was then performed by using a backward stepwise Cox regression model, entering variables that reached P < .1 significance in univariate analysis. Hazard ratios (HRs) were estimated according to a Cox regression model.
The impact of time-dependent covariates on OS was assessed through multivariate analysis: onset of progression after first treatment initiation; achievement of complete response (CR), defined as the occurrence of a CR after first-line therapy; and performance of allo-HSCT.
Expected mortality and relative survival rates compared with age- and sex-matched individuals were obtained in R using the life tables available for the French total population in the Human Mortality Database, University of California, Berkeley (Berkeley, CA), and Max Planck Institute for Demographic Research (Rostock, Germany) (available at www.mortality.org). Standardized mortality ratio was computed as previously reported,12 and the relative survival was plotted by using the method described by Pohar and Stare.13 Statistical analysis and figure presentations were performed by using SAS release 9.4 (SAS Institute, Inc, Cary, NC) and the R package release 3.4.2 (The R foundation for Statistical Computing, Vienna, Austria; the survexp function of the survival package and the relsurv package).
Results
Patients
We identified 214 patients meeting the inclusion criteria from 38 IFM centers in France and Belgium (supplemental Table 1). Among them, 189 patients had symptomatic MM, 9 had pPCL, 10 had SMM, 4 had solitary plasmacytoma, and 2 individuals had MM plus light chain deposition disease. The data recovery rate was 96%. Most of the patients (48.6%) were diagnosed between the years 2011 and 2015. Their baseline demographic and laboratory parameters at time of MM diagnosis are presented in Table 1. The median age was 37.2 years (range, 18.6-40.9 years), and 64% were male. Nineteen patients had a medical history of monoclonal gammopathy of unknown significance. The immunoglobulin type was immunoglobulin G for 80.2%, and 24% had a light chain MM (mostly κ light chain). When considering myeloma-defining events at diagnosis, 75% had bone lesions, 35% had anemia, 17% had renal impairment (defined according to a glomerular filtration rate <60 mL/min), and 12.8% had hypercalcemia (>2.75 mmol/L). A majority of patients were of ISS-1 score (52.4%), whereas 27.5% and 20.1% were of ISS-2 and ISS-3 score, respectively. Cytogenetic analyses were informative for 88.3% of patients, and 99 (52.4%) had cytogenetic abnormalities, including high-risk cytogenetics in 18% of patients; high-risk cytogenetics was defined here by the presence of t(4;14) and/or del17p on fluorescence in situ hybridization analysis, as further microarray or next-generation sequencing analyses were conducted in only 60 patients.
Clinical and biological characteristics at baseline
| Characteristics | Value | Valid data (n) |
|---|---|---|
| Total population, n (%) | 214 (100) | |
| Diagnosis period, n (%) | ||
| Diagnosis 2000-2005 | 50 (23.4) | 214 |
| Diagnosis 2006-2010 | 60 (28) | |
| Diagnosis 2011-2015 | 104 (48.6) | |
| Sex, n (%) | 214 | |
| Male | 137 (64) | |
| Female | 77 (36) | |
| Age, y | ||
| Median ± standard deviation | 37.2 ± 4.3 | |
| Minimum-maximum | 18.6-40.9 | |
| MGUS history, n (%) | 19 (9.2) | 206 |
| Type of disease, n (%) | 214 | |
| Symptomatic MM | 189 (88.3) | |
| pPCL | 9 (4.2) | |
| SMM | 10 (4.7) | |
| Solitary plasmacytoma | 4 (1.9) | |
| Randall disease | 2 (0.9) | |
| Isotype, n (%) | 213 | |
| Complete isotype | 162 (76) | |
| IgA | 28 (17.3) | |
| IgG | 130 (80.2) | |
| IgM | 1 (0.06) | |
| IgD | 3 (1.9) | |
| Light chain only | 51 (24) | |
| Light chain type, n (%) | 209 | |
| κ | 138 (66) | |
| λ | 71 (34) | |
| Bone lesions, n (%) | 149 (75) | 200 |
| Medical imaging, n (%)* | 190 | |
| Standard radiography | 100 (52.6) | |
| CT imaging | 64 (33.7) | |
| MRI | 114 (60) | |
| PET | 27 (14.2) | |
| None | 4 (2.1) | |
| Glomerular filtration rate (MDRD, ml/min), n (%) | 200 | |
| ≥60 | 166 (83) | |
| <60 | 34 (17) | |
| Hypercalcemia, n (%) | 195 | |
| >2.75 mmol/L | 25 (12.8) | |
| ≤2.75 mmol/L | 170 (87.2) | |
| Proteinuria >1 g/L, n (%) | 34 (22.7) | 150 |
| Albuminemia, median ± SD, g/L | 39.2 ± 8.2 | 187 |
| β2-Microglobulinemia, median ± SD, g/L | 2.83 ± 14.5 | 179 |
| Cytopenia, n (%) | ||
| Anemia (Hb <10 g/dL) | 71 (35.1) | 202 |
| Neutropenia (PNN <1.5 G/L) | 9 (4.7) | 193 |
| Thrombopenia (platelets <100 G/L) | 8 (4) | 199 |
| ISS score, n (%) | 189 | |
| 1 | 99 (52.4) | |
| 2 | 52 (27.5) | |
| 3 | 38 (20.1) | |
| Cytogenetics, n (%) | ||
| High risk, including*: | 34 (18) | 189 |
| t(4;14) | 19 (12.2) | 189 |
| del17p | 17 (12.1) | 156 |
| Others, including | 65 (34.4) | 141 |
| t(11;14) | 9 (25.7) | 189 |
| t(14;16) | 1 (2.5) | 35 |
| +1q† | 17 (30.4) | 39 |
| del1p32‡ | 8 (17.4) | 56 |
Number of patients is expressed in absolute value (n), whereas percentage (%) is calculated among valid data, after exclusion of ND and NA values. CT, computed tomography; Hb, hemoglobin; IgA, immunoglobulin A; MDRD, Modification of Diet in Renal Disease equation; MGUS, monoclonal gammopathy of unknown significance; MRI, magnetic resonance imaging; PET, positron emission tomography; PNN, polynuclear neutrophil; SD, standard deviation.
Two patients had t(4;14) and del17p. Failure of cytogenetic analysis was considered as nonvalid data.
Associated with high-risk cytogenetics in 5 patients.
Associated with high-risk cytogenetics in 2 patients; associated with +1q in 5 patients.
Treatments
The choice of first-line treatment depended on the time period of diagnosis. None of the 10 patients with SMM required therapy. Patients with solitary plasmacytoma were treated with radiotherapy, but 1 of the 4 later received chemotherapy due to relapse after radiotherapy. Two-thirds of patients received bortezomib in their frontline regimen: a triplet induction, including an immunomodulatory drug (IMID) and dexamethasone (bortezomib + thalidomide + dexamethasone or bortezomib + lenalidomide + dexamethasone), was given in 36.6%, whereas 30% received only proteasome inhibitor (PI)-based chemotherapy, with anthracycline (bortezomib + Adriamycin + dexamethasone), with cyclophosphamide (bortezomib + cyclophosphamide + dexamethasone), or bortezomib + dexamethasone alone. Twenty-five percent of patients did not receive PI- or IMID-based chemotherapy at first line, such as vincristine + Adriamycin + dexamethasone or cyclophosphamide-etoposide-doxorubicin-prednisone combinations. Overall, 20% did not receive PI or IMID among first-line therapy, at any time (including consolidation and maintenance phases). The majority of patients (93%) received an autologous stem cell transplant (ASCT) upfront or at relapse, according to the standard of care at that time. Eleven patients never received a transplant, and 3 had upfront allo-HSCT (Figure 1). Fifty-six percent of patients received post-ASCT treatment, either consolidation and/or maintenance therapy. A total of 46 patients underwent allo-HSCT, mostly at first relapse or later (71%), and 6 of them had pPCL at diagnosis.
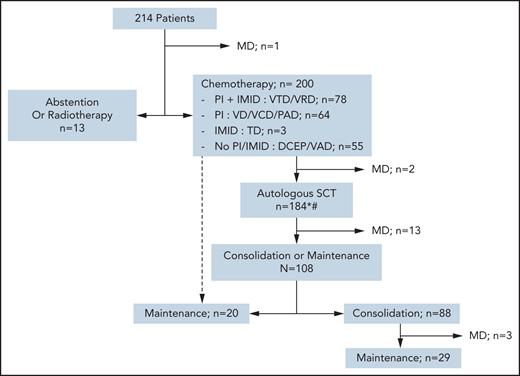
Flowchart of different strategies for first-line therapies. *Some patients underwent ASCT at relapse rather than front line, according to the protocol. #Fourteen patients did not undergo ASCT for the following reasons: front-line allo-HSCT (n = 3), progressive disease or early death (n = 3), persistent CR/VGPR after first-line therapy (n = 2), collection failure (n = 1), severe renal impairment (n = 1), and unknown (n = 4). PI refers to bortezomib; IMID refers to either thalidomide or lenalidomide. DCEP, doxorubicin + cyclophosphamide + etoposide + prednisone; MD, missing data; PAD, bortezomib + Adriamycin (doxorubicin) + dexamethasone; TD, thalidomide + dexamethasone; VAD, vincristine + Adriamycin + dexamethasone; VCD, bortezomib + cyclophosphamide + dexamethasone; VD, bortezomib + dexamethasone; VRD, bortezomib + lenalidomide + dexamethasone; VTD, bortezomib + thalidomide + dexamethasone.
Flowchart of different strategies for first-line therapies. *Some patients underwent ASCT at relapse rather than front line, according to the protocol. #Fourteen patients did not undergo ASCT for the following reasons: front-line allo-HSCT (n = 3), progressive disease or early death (n = 3), persistent CR/VGPR after first-line therapy (n = 2), collection failure (n = 1), severe renal impairment (n = 1), and unknown (n = 4). PI refers to bortezomib; IMID refers to either thalidomide or lenalidomide. DCEP, doxorubicin + cyclophosphamide + etoposide + prednisone; MD, missing data; PAD, bortezomib + Adriamycin (doxorubicin) + dexamethasone; TD, thalidomide + dexamethasone; VAD, vincristine + Adriamycin + dexamethasone; VCD, bortezomib + cyclophosphamide + dexamethasone; VD, bortezomib + dexamethasone; VRD, bortezomib + lenalidomide + dexamethasone; VTD, bortezomib + thalidomide + dexamethasone.
Responses and outcomes
Overall response rate after first-line treatment, defined as partial response (PR) and better, was 95%; 72% of patients achieved at least a very good partial response (VGPR and CR). These results are summarized in Table 2. No data on minimal residual disease (MRD) are available. Survival and follow-up data were evaluable for 182 of the 189 patients diagnosed with symptomatic MM (flowchart is presented in supplemental Figure 1). Median follow-up was 76 months (IQR1-3, 44-123 months). Median progression free-survival (PFS) was 41 months (IQR1-3, 36-54 months). The estimated median OS was 175 months (IQR1-3, 121 months-not reached) among patients with symptomatic MM, and the estimated OS was 84% and 59% at 5 and 10 years, respectively (Figure 2). At 5 years, the relative survival was 83.5% (95% confidence interval [CI], 78-89). The standardized mortality ratio was estimated at 69.9 (95% CI, 52.7-91.1), meaning that patients diagnosed with MM at ≤40 years of age have a 69.9-fold increase in mortality risk compared with the general population.
First-line treatment characteristics
| Characteristic | Value | Valid data (n) |
|---|---|---|
| Total population, n (%) | 214 (100) | |
| Induction type, n (%) | 213 | |
| VD/VCD/PAD | 64 (30) | |
| VTD/VRD | 78 (36.6) | |
| VAD/DCEP | 55 (25.8) | |
| Other (thalidomide + dexamethasone) | 3 (1.4) | |
| No treatment (except radiotherapy) | 13 (6.1) | |
| ASCT, n (%) | 184 (93) | 198 |
| Single | 142 (77) | |
| Double | 42 (23) | |
| Consolidation OR maintenance therapy, n (%) | 108 (58.7) | 184 |
| Consolidation AND maintenance therapy, n (%) | 29 (15.8) | 184 |
| PI OR IMID first line, at any time, n (%) | 159 (79.9) | 199 |
| PI + IMID first line, at any time, n (%) | 104 (52.3) | 199 |
| Allo-HSCT, n (%) | 46 (24.9) | 185 |
| First line | 13 (28.9) | 45 |
| Second line | 22 (48.9) | 45 |
| Beyond second line | 10 (22.2) | 45 |
| Response to first-line therapy,* n (%) | 191 | |
| CR | 73 (38.2) | |
| VGPR | 64 (33.5) | |
| PR | 46 (24.1) | |
| Stable disease | 4 (2.1) | |
| Progressive disease | 4 (2.1) |
Number of patients is expressed in absolute value (n) whereas percentage (%) is calculated among valid data, after exclusion of ND and NA values. DCEP, cyclophosphamide + etoposide + doxorubicin + prednisone; PAD, bortezomib + Adriamycin + dexamethasone; VAD, vincristine + Adriamycin + dexamethasone; VCD, bortezomib + cyclophosphamide + dexamethasone; VD, bortezomib + dexamethasone; VRD, bortezomib + lenalidomide + dexamethasone; VTD, bortezomib + thalidomide + dexamethasone.
Response to first-line therapy was assessed by using International Myeloma Working Group criteria.
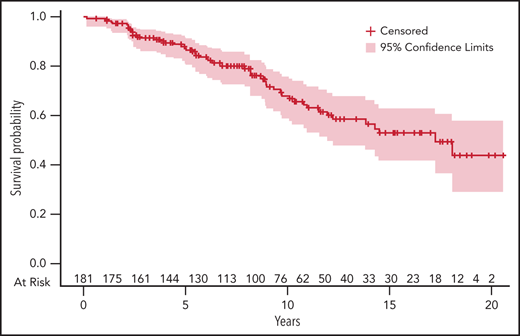
Five percent estimate of OS of patients diagnosed with symptomatic MM at age ≤40 years. The number of patients at risk at different time points is indicated on the upper side of the x-axis. Time (in years) is indicated on the lower side of the x-axis.
Five percent estimate of OS of patients diagnosed with symptomatic MM at age ≤40 years. The number of patients at risk at different time points is indicated on the upper side of the x-axis. Time (in years) is indicated on the lower side of the x-axis.
Prognostic factors for response and outcomes
Response rates were not affected by the choice of first-line therapy or by cytogenetic abnormalities, and most of the patients with high-risk cytogenetics reached a VGPR or better (supplemental Table 2). The choice of first-line treatment did not influence the outcome, as similar OS was observed among patients treated with either PI- and IMID-free chemotherapy, PI-based chemotherapy, or PI plus IMID triplet therapy (Table 3).
Univariate analysis of OS
| Parameter | Death/N | HR | 95% CI | P |
|---|---|---|---|---|
| Age, y | ||||
| <30 | 2/19 | 1.00 | ||
| 30-35 | 13/38 | 2.04 | 0.66-8.86 | .26 |
| >35 | 36/121 | 1.89 | 0.68-7.85 | .29 |
| MGUS history | ||||
| No | 46/160 | 1.00 | ||
| Yes | 1/12 | 0.27 | 0.01-1.22 | .19 |
| Isotype | ||||
| IgG | 36/110 | 1.00 | ||
| IgA | 7/23 | 1.19 | 0.54-2.37 | .63 |
| MM light chain | ||||
| No | 42/133 | 1.00 | ||
| Yes | 8/43 | 0.59 | 0.27-1.15 | .15 |
| Bone lesions | ||||
| No | 6/36 | 1.00 | ||
| Yes | 41/133 | 3.15 | 1.37-9.13 | .01* |
| Hypercalcemia | ||||
| ≤2.75 mmol/L | 41/146 | 1.00 | ||
| >2.75 mmol/L | 7/18 | 1.82 | 0.79-3.66 | .12 |
| GFR, mL/min | ||||
| ≥60 | 38/141 | 1.00 | ||
| <60 | 10/28 | 1.57 | 0.74-3.02 | .20 |
| Proteinuria >1g/L | ||||
| No | 25/95 | 1.00 | ||
| Yes | 8/29 | 1.13 | 0.52-2.27 | .73 |
| Anemia | ||||
| No | 26/110 | 1.00 | ||
| Yes | 22/59 | 2.07 | 1.19-3.60 | .009* |
| ISS | ||||
| 1 | 18/87 | 1.00 | ||
| 2 | 13/40 | 1.84 | 0.89-3.74 | .09* |
| 3 | 12/30 | 2.63 | 1.25-5.41 | .009* |
| High-risk cytogenetics | ||||
| No | 37/152 | 1.00 | ||
| Yes | 14/31 | 2.75 | 1.53-4.93 | <.001* |
| First-line treatment | ||||
| VAD/DCEP | 24/49 | 1.00 | ||
| VD/VCD/PAD | 15/53 | 0.85 | 0.43-1.62 | .61 |
| VTD/VRD | 11/73 | 0.72 | 0.33-1.48 | .37 |
'Death/N' represents the number of deaths per number of patients.
DCEP, cyclophosphamide + etoposide + doxorubicin + prednisone; GFR, glomerular filtration rate; IgA, immunoglobulin A; MGUS, monoclonal gammopathy of unknown significance; PAD, bortezomib + Adriamycin + dexamethasone; VAD, vincristine + Adriamycin + dexamethasone; VCD, bortezomib + cyclophosphamide + dexamethasone; VD, bortezomib + dexamethasone; VRD, bortezomib + lenalidomide + dexamethasone; VTD, bortezomib + thalidomide + dexamethasone.
Parameters were selected for multivariate analysis.
In univariate analysis, the presence of bone lesions (HR, 3.15; 95% CI, 1.37-9.13; P = .01), anemia (HR, 2.07; 95% CI, 1.19-3.60; P = .009), higher ISS score (ISS-3: HR, 2.63 [95% CI, 1.25-5.41; P = .009]; ISS-2: HR, 1.84 [95% CI, 0.89-3.74; P = .09] compared with ISS-1), and high-risk cytogenetics (HR, 2.75; 95% CI, 1.53-4.93; P < .001) significantly shortened the OS. In multivariate analysis, the presence of bone lesions at diagnosis (HR, 3.95; 95% CI, 1.37-11.38; P = .011), ISS-3 (HR, 2.14; 95% CI, 1.07-4.27; P = .03), and high-risk cytogenetics (HR, 4.54; 95% CI, 2.26-9.11; P < .0001) were finally identified as independent predictors of poor OS (Table 4). As the definition of high-risk cytogenetics evolved over time, we verified the impact of a more recent definition that also included t(14;16), +1q, and del1p32. This updated version of high-risk cytogenetics was also strongly predictive of a shorter OS, both in univariate and multivariate analyses (supplemental Table 3).
Multivariate analysis of OS
| Parameter | HR | 95% CI | P |
|---|---|---|---|
| ISS-3 vs ISS-1 | 2.14 | 1.07-4.27 | .03 |
| High-risk cytogenetics | 4.54 | 2.26-9.11 | <.0001 |
| Bone lesions | 3.95 | 1.37-11.38 | .01 |
| Parameter | HR | 95% CI | P |
|---|---|---|---|
| ISS-3 vs ISS-1 | 2.14 | 1.07-4.27 | .03 |
| High-risk cytogenetics | 4.54 | 2.26-9.11 | <.0001 |
| Bone lesions | 3.95 | 1.37-11.38 | .01 |
All variables that reached P < 0.1 significance in univariate analysis were entered into the multivariate model.
Among predefined time-dependent covariables, only onset of progression (HR, 13.2; 95% CI, 5.6-37.3; P < .0001) and allo-HSCT (HR, 2.4; 95% CI, 1.2-4.2; P = .006) after first treatment initiation were significantly associated with worse survival in univariate analysis. Achievement of CR had no significant impact on OS (HR, 0.7; 95% CI, 0.3-1.7; P = .53). In multivariate analysis, only onset of progression significantly worsened the OS (Table 5).
Statistical analysis of OS for time-dependent covariables
| Parameter | HR | 95% CI | P | |
|---|---|---|---|---|
| Univariate | ||||
| Achievement of CR | 0.745 | 0.258 | 1.705 | .53 |
| Onset of progression | 13.227 | 5.589 | 37.252 | <.0001 |
| allo-HSCT | 2.351 | 1.249 | 4.243 | .006 |
| Multivariate | ||||
| allo-HSCT | 1.781 | 0.953 | 3.186 | .06 |
| Onset of progression | 12.278 | 5.171 | 34.652 | <.0001 |
Discussion
MM is rare before 40 years of age, and this population is poorly understood. We present here a large multicentric cohort of 214 patients with MM diagnosed before age 40 years and prospectively included in the IFM cytogenetics database between 2000 and 2015. We found no specific characteristics in this young population, except that nearly one-half of them had low-risk ISS (ISS-1), which is twice as high as what is usually found in older patients. This finding is consistent with previously published cohorts of very young patients diagnosed with MM and may explain in part the long OS found in this population.4,5 In fact, the 5-year OS was 84%, and the estimated median OS was 14.5 years, whereas most of the studies reported a median OS of ∼8 to 9 years for patients diagnosed at <60 to 65 years of age.1,14 To account for their increased life expectancy due to young age, we also estimated their relative survival. The 5-year relative survival was estimated at 83.5% (95% CI, 78-89), very similar to the OS because of the very low risk of death in the general population aged ≤40 years. Nevertheless, the standardized mortality ratio estimate highlighted the high increase in mortality due to MM, nearly 70-fold higher than expected in the general population.
The impact of contemporary drug regimens and immunotherapies on OS is unclear. The Swedish registry found no OS improvement for patients ≤65 years old, comparing the data from 2008 to 2010 vs 2011 to 2015, including the patients diagnosed between 21 and 40 years old, possibly due to limited follow-up for this young population.1,15 Conversely, US registries showed that the 5- and 10-year relative OS almost doubled between years earlier than 1995 vs later than 2003 in patients diagnosed at age ≤40 years, except for the Hispanic population.16 Because ethnic statistics are not allowed in France, we cannot comment on these data for our cohort.
Regarding prognostics factors for OS, only bone lesions, ISS-3 score, and high-risk cytogenetics were significant in multivariate analysis, regardless of initial response or therapies. Considering that patients were included over a 15-year time period, some factors may have affected these findings, such as the heterogenicity of front-line therapies. Some therapies are now outdated, as no next-generation PIs and IMIDs, nor monoclonal antibodies, have been used, and no MRD assessment was routinely performed at this time. Nevertheless, these limitations are inherent to the rare incidence of MM in this age group, requiring a long inclusion time. The retrospective nature of our study is also a limitation, although a prospective evaluation of this specific population is difficult to set up for the same reason.
Emerging immunotherapies, including new antibodies anti-CD38 such as isatuximab, anti-SLAMF7 or anti–B-cell maturation antigen, and bispecific antibodies, are promising therapies that may further improve the treatment of MM in very young patients.17-22 The development of engineered chimeric antigen receptor T-cell therapies, especially those targeting B-cell maturation antigen, may offer additional therapeutic options to treat this population from early onset of the disease, although further improvements are required to extend the duration of the response.23,24 These very young patients usually remain fit enough to receive multiple lines of treatment after relapse, such as second ASCT, which are likely to improve the OS and might contribute to this favorable outcome.25-27 The gap between the short PFS and the contrasting long OS also strengthens this hypothesis, suggesting that life expectancy remains long even for relapsing patients.
Among the time-dependent variables, only time to progression worsens the OS, whereas onset of allogeneic HSCT failed to reach significance in multivariate analysis. Interestingly, the onset of CR after first-line therapy had no impact on OS, whereas it is well established that deep responses significantly improve outcomes.28,29 This might be related to the limited number of events in this rare population of young patients. A similar result has been published from the Swedish registry, with a similar relative OS across CR, VGPR, and PR in patients aged ≤65 years.1 The absence of a fine-tuned distinction of CR and stringent CR, as well as the absence of MRD assessment may explain this finding. Reaching this level of response assessment may be of importance, especially for patients with high-risk cytogenetics.30 Indeed, a negative MRD result further improves the PFS even in patients reaching CR after first-line therapy.31 The prolonged OS in patients reaching MRD negativity has been recently confirmed in a meta-analysis, which showed a decrease in the risk of death by 50%.32
Given the long OS we observed and the expected future improvements in therapies, it is worth monitoring these very young patients for long-term complications. However, our retrospective study was not designed to comment on this factor. In particular, PI and IMIDs may induce long-term cardiovascular toxicities that could affect the outcome of young patients.33 Prolonged exposure to IMIDs may favor secondary malignancies, especially in a maintenance setting. Nevertheless, the marked benefit of IMID therapy on OS still overcomes the risk of developing secondary malignancy.34,35 Recent work also suggests that intensive treatment such as melphalan before ASCT induces DNA damage, but whether the mutational landscape shapes the course of the disease over the years remains unclear.36 The benefit of ASCT has been confirmed in the era of PI plus IMID combinations, at least by improving the PFS, and is still recommended in eligible patients.37,38 Whether emerging immunotherapies might overcome the benefit of ASCT has yet to be evaluated. Monitoring the long-term effects of multiple treatments in this very young population is of high interest and should be included in the overall framework for quality of life assessments in future work.39,40
In summary, in this large retrospective cohort of patients with MM diagnosed at ≤40 years of age, we found that baseline and disease characteristics are very similar to those of older patients. These very young patients present a long OS, despite subsequent relapses shown by the short PFS, but a high increase in mortality compared with the general population. Common adverse predictors of OS in older patients are confirmed to worsen OS in this particular population. Notably, we confirmed that high-risk cytogenetics was a reliable predictor of poor OS. Our data were collected before the development of novel immunotherapies, whose incorporation early in the course of the disease will most likely improve the outcomes in these young patients. Ultimately, the development of MRD-adjusted strategies are also promising approaches to further extend the encouraging OS of patients diagnosed with MM earlier than age 40 years, while ensuring their quality of life.
Acknowledgments
The authors thank all the contributors of the study, especially those who collected data. They also thank the following: the research assistants who helped to complete the database, especially Elodie Deruche (CHU Amiens); Hervé Avet-Loiseau, who provided access to the database; Nathaniel R. Braffman for proofreading of the manuscript; and the patients who granted agreement for collection of data in the database.
Authorship
Contribution: B.R., P.M., M.R., and H.A.-L. supervised the work; A.C., P.M., and B.R. analyzed the data; and all authors collected the data, and all authors wrote the article.
Conflict-of-interest disclosure: B.R. receives advisory fees from Takeda, Janssen, Amgen, and Celgene. M.R. received lecture fees from Amgen, Celgene/BMS, Janssen, and Takeda. A.-M.S. receives honoraria from Celgene, Janssen, Takeda, Sanofi, and Amgen; and advisory fees from Celgene, Janssen, Takeda, Sanofi, and GSK. L.G. receives advisory fees from Sanofi, Celgene/BMS, Janssen, Takeda, and Amgen. A.P. receives advisory fees from Amgen, BMS/Celgene, Janssen, Sanofi, and Takeda. X.L. receives honoraria from Janssen, BMS, Amgen, Sanofi, Merck, Oncopeptides, Karyopharm, Novartis, AbbVie, Takeda, Incyte, Gilead, Roche, and CARsgen. The remaining authors declare no competing financial interests.
Correspondence: Bruno Royer, Service d’Immunohématologie, Hôpital Saint-Louis, 1 Ave Claude Vellefaux, 75010 Paris, France; e-mail: bruno.royer@aphp.fr.
The online version of this article contains a data supplement.
There is a Blood Commentary on this article in this issue.
The publication costs of this article were defrayed in part by page charge payment. Therefore, and solely to indicate this fact, this article is hereby marked “advertisement” in accordance with 18 USC section 1734.

This feature is available to Subscribers Only
Sign In or Create an Account Close Modal