

Key Points
Low-burden TP53 mutations in CLL do not significantly affect the response duration to chemo- and/or immunotherapy, but shorten OS.
Clonal expansion of low-burden TP53 mutations in CLL is associated with intense chemoimmunotherapy, but not with targeted therapy.

Abstract
Patients with chronic lymphocytic leukemia (CLL) bearing TP53 mutations experience chemorefractory disease and are therefore candidates for targeted therapy. However, the significance of low-burden TP53 mutations with <10% variant allele frequency (VAF) remains a matter for debate. Herein, we describe clonal evolution scenarios of low-burden TP53 mutations, the clinical impact of which we analyzed in a “real-world” CLL cohort. TP53 status was assessed by targeted next-generation sequencing (NGS) in 511 patients entering first-line treatment with chemo- and/or immunotherapy and 159 patients in relapse before treatment with targeted agents. Within the pretherapy cohort, 16% of patients carried low-burden TP53 mutations (0.1% to 10% VAF). Although their presence did not significantly shorten event-free survival after first-line therapy, it affected overall survival (OS). In a subgroup with TP53 mutations of 1% to 10% VAF, the impact on OS was observed only in patients with unmutated IGHV who had not received targeted therapy, as patients benefited from switching to targeted agents, regardless of initial TP53 mutational status. Analysis of the clonal evolution of low-burden TP53 mutations showed that the highest expansion rates were associated with fludarabine, cyclophosphamide, and rituximab regimen in both first- and second-line treatments (median VAF increase, 14.8× and 11.8×, respectively) in contrast to treatment with less intense treatment regimens (1.6×) and no treatment (0.8×). In the relapse cohort, 33% of patients carried low-burden TP53 mutations, which did not expand significantly upon targeted treatment (median VAF change, 1×). Sporadic cases of TP53 mutations' clonal shifts were connected with the development of resistance-associated mutations. Altogether, our data support the incorporation of low-burden TP53 variants in clinical decision making.
Introduction
TP53 defects in chronic lymphocytic leukemia (CLL) are a well-established marker for poor prognosis and chemotherapy-resistant disease. Patients with TP53 defects strongly benefit from targeted therapy with BcR pathway or bcl2 inhibitors that are presumed to act independent of the p53 pathway.1-3 CLL treatment has progressed rapidly in recent years, and current European Society for Medical Oncology guidelines recommend that all patients with unmutated IGHV, irrespective of TP53 status, should be treated with the targeted agents in the first-line setting.4 Unfortunately, this treatment strategy is currently not applicable in common practice in many countries because of financial constraints and/or no registration in this indication. Therefore, testing for TP53 gene mutations and deletions of the corresponding locus [del(17p)] remain indispensable in treatment decision making.5-7 Current guidelines are based on studies showing the negative impact of TP53 mutations detectable by Sanger sequencing.8-10 The detection limit of Sanger sequencing is ∽10% variant allele frequency (VAF), which corresponds to the recommended threshold for clinical reporting.6 Next-generation sequencing (NGS) allows for the identification of TP53 variants present even below 1% VAF, and it has been documented that standard chemoimmunotherapy (CIT) triggering apoptosis via the p53 pathway often leads to the clonal expansion of these small mutant subclones during relapse, with the exact risk being unknown.11-15 In contrast, it has been suggested that TP53 defects do not provide selective fitness to ibrutinib treatment16; however, data on the clonal evolution of low-burden TP53 mutations upon treatment with targeted agents are limited.17
The clinical significance of low-burden TP53 mutations has been widely discussed and several studies have been published with discordant results that may be, at least in part, attributable to different cohort composition.14,18-22 Three of 4 publications focusing on early disease stages showed a negative impact of low-burden mutations,14,18,22 whereas 1 study did not.19 Regarding the patients requiring treatment, in 2 of the studies, small cohorts were analyzed at initiation of treatment (53 and 61 patients), showing the negative impact of small TP53-mutated (TP53-mut) subclones on OS.14,19 In contrast, a recently published study,20 performed on patients included in the UK LRF CLL4 trial, failed to demonstrate a significant difference in survival between patients carrying low-burden TP53 mutations and either the TP53 wild-type (TP53-wt) or TP53 mutations ≥12% VAF, suggesting that these cases represent an intermediate-risk group. Similarly, shortened OS for patients with low-burden TP53 mutations was not observed in those with relapsed disease who were included in the Complement 2 trial.21
In our study, we used NGS to identify TP53 mutations present in as low as 0.1% VAF in a single-center, consecutive, “real-world” cohort of 511 patients with CLL entering first-line treatment with chemo- and/or immunotherapy and 159 patients with relapsed disease treated with targeted agents. We evaluated the clinical impact of low-burden TP53 mutations, and we assessed the risk of clonal expansion in the context of different treatment modalities and analyzed the factors involved in the process.
Material and methods
Patients and samples
The study was performed on tumor cells separated from peripheral blood obtained from patients with CLL monitored at the University Hospital Brno. For all samples, written informed consent approved by the Ethics Committee of University Hospital Brno was obtained in accordance with the Declaration of Helsinki. Patients were diagnosed, monitored, and treated according to International Workshop on CLL National Cancer Institute guidelines.23 The following patients with available blood samples were analyzed: (1) 511 patients entering first-line treatment from 2008 through 2017; (2) 159 patients in relapse entering treatment with BcR or bcl2 inhibitors from 2013 through 2019. For details on patient cohorts see supplemental Data, available on the Blood Web site. The patients were further monitored during remission and relapse (supplemental Methods).
TP53 mutation analysis by deep NGS
TP53 mutation analysis of the whole coding region was performed with amplicon-based targeted NGS, as described previously24,25 (supplemental Methods). The presence of all TP53 variants identified in pretherapy samples was confirmed by a repeated analysis of affected exon/repeated sample (starting from the PCR amplification of affected exon). The ability of the methodology to reach the limit of 0.1% VAF has been documented in our previous studies by the analysis of serial samples from individual patients24,26 and by the sequencing of 10 replicates of a dilution series of 8 variants (supplemental Methods; supplemental Figure 2). Neutral and/or germline variants as assessed by the International Agency for Research on Cancer (IARC) TP53 database27 and Seshat,28 were excluded from further analyses (supplemental Table 4).
Statistical analyses
The Kaplan-Meier survival analysis was used to assess the probability of event-free survival (EFS) from initiation of treatment to any of the following events: progression, therapy change, or death of any cause. Overall survival (OS) was estimated from initiation of treatment to death of any cause. Statistical methods are detailed in the supplemental Methods.
Results
Low-burden TP53 defects are frequent in pretherapy samples and have the same profile as high-burden mutations
Altogether, 511 patients entering first-line treatment were included in the study (Table 1). The patients were treated mainly with CIT (85%), with fludarabine, cyclophosphamide, and rituximab (FCR), and with bendamustine and rituximab (BR) as the most common regimens. Non-CIT regimens involved mainly corticoid-based treatment, alemtuzumab, or chlorambucil (supplemental Table 5). EFS and OS by treatment are shown in supplemental Figure 3. Using NGS analysis of separated B lymphocytes, 284 TP53 mutations were identified in 141 patients (28%). More than 1 TP53 mutation was detected in 36 patients (2-27 mutations per patient; supplemental Table 6; supplemental Figure 4). When stratified based on allelic fraction, 59 patients carried a mutation with ≥10% VAF (12%; referred to as high-burden mutations), and 82 patients had mutations with VAF of <10% only (16%; referred to as low-burden mutations). Of the patients with low-burden mutations, 53 harbored mutations with VAF <1% (10% of the whole cohort; Figure 1). Comparison of the characteristics of low- and high-burden mutations did not show any differences in codon distribution and functional impact (supplemental Figure 5).
Characteristics of the patients treated with first-line treatment
| Whole cohort | TP53 wt | High-burden TP53 mutation (≥10% VAF) | Low-burden TP53 mutation (1-10% VAF) | Low-burden TP53 mutation (<1% VAF) | P* | |||||
|---|---|---|---|---|---|---|---|---|---|---|
| No. of patients | 511 | 370 (72) | 59 (12) | 29 (6) | 53 (10) | — | ||||
| Age at first-line treatment, median y (range) | 67.31 (35.0-94.0) | 66.8 (37.43-88.7) | 68.8 (35.1-81.3) | 67.6 (49.0-94.0) | 69.0 (41.6-81.1) | — | ||||
| Sex | — | |||||||||
| Female | 176 (34) | 120 (32) | 21 (36) | 12 (41) | 23 (43) | |||||
| Male | 335 (66) | 250 (68) | 38 (64) | 17 (59) | 30 (57) | |||||
| IGHV status† | Mut >10% vs wt; P = .003 | |||||||||
| Mutated | 142 (28) | 115 (32) | 6 (10) | 6 (21) | 15 (28) | |||||
| Unmutated | 362 (72) | 250 (68) | 52 (90) | 22 (79) | 38 (72) | |||||
| Discordant‡/NA | 4/3 | 3/2 | 0/1 | 1/0 | 0 | |||||
| FISH hierarchical§ | Del(17p) mut >10% vs all groups; P < .0001 | |||||||||
| Del(17p) | 41 (8) | 7 (2) | 34 (58) | 0 | 0 | |||||
| Del(11q) | 136 (27) | 108 (29) | 6 (10) | 6 (21) | 16 (30) | |||||
| +12 | 67 (13) | 56 (15) | 0 | 5 (17) | 6 (11) | |||||
| Del(13q) | 160 (31) | 116 (31) | 14 (24) | 12 (41) | 19 (36) | |||||
| Normal | 105 (21) | 82 (22) | 5 (8) | 6 (21) | 12 (23) | |||||
| NA | 2 | 2 | 0 | 0 | 0 | |||||
| CLL IPI | A | B | A | B | A | B | Not applicable | |||
| Low | 26 (6) | 26 (6) | 26 (8) | 0 | 0 | 0 | 0 | 0 | ||
| Intermediate | 102 (23) | 84 (19) | 84 (27) | 0 | 9 (36) | 0 | 9 (19) | 0 | ||
| High | 254 (57) | 203 (46) | 198 (63) | 2 (3) | 16 (64) | 2 (8) | 38 (81) | 1 (2) | ||
| Very high | 63 (14) | 132 (30) | 7 (2) | 56 (97) | 0 | 23 (92) | 0 | 46 (98) | ||
| NA | 66 | 55 | 1 | 4 | 6 | |||||
| TTFT, median mo (range) | 22.2 (0-246.6) | 24.2 (0-246.6) | 12.7 (0-127.6) | 18.1 (0-212.3) | 31.9 (0-168.3) | Mut >10% vs wt; P < .0001 and vs mut 1-10% P < 0.0001 | ||||
| First-line treatment | ||||||||||
| FCR | 263 (51) | 204 (55) | 17 (29) | 18 (62) | 24 (45) | FCR: mut>10% vs wt; P = .002; | ||||
| BR | 113 (22) | 89 (24) | 3 (5) | 6 (21) | 15 (28) | BR: mut >10% vs wt; P = .0005 | ||||
| Other|| | 135 (26) | 77 (21) | 39 (66) | 5 (17) | 14 (26) | Mut >10% vs mut <1%; P = .014 | ||||
Data are number of patients (percentage of subgroup), unless otherwise indicated. CLL-IPI, according to International CLL-IPI Working Group.29 CLL-IPI A: TP53 mutations >10% VAF considered as TP53 defect. CLL-IPI B: All TP53 mutations, irrespective of VAF, considered as a TP53 defect.
NA, not available; TTFT, time to first treatment.
All groups were mutually compared. Only significant comparisons are shown.
Based on 98% identity threshold.
More than 1 clone with discordant mutational status detected.
According to Döhner et al.46
For complete list of treatment see supplemental Table 5.

TP53 defects in the analyzed cohort. (A) Composition of TP53 defects. (B) TP53 mutations in 141 patients with CLL, in order according the highest VAF. Black, highest mutation VAF; white, cumulative mutation VAF.
TP53 defects in the analyzed cohort. (A) Composition of TP53 defects. (B) TP53 mutations in 141 patients with CLL, in order according the highest VAF. Black, highest mutation VAF; white, cumulative mutation VAF.
Compared with patients bearing TP53-wt, the subgroup with high-burden TP53 mutations was significantly associated with unmutated immunoglobulin genes (IGHV; 90% vs 69%; P = .003). Patients received FCR as a first-line treatment less frequently (29% vs 55%; P < .0001), in line with the recommendation to preferably avoid CIT regimens in patients carrying TP53 mutations.7 The subgroup of patients with low-burden TP53 mutations was not significantly different from patients with TP53-wt in IGHV mutational status, age, and treatment type (Table 1).
Del(17p) was detected by interphase fluorescence in situ hybridization (I-FISH) in 41 patients (8%; for allelic composition, see Figure 1A). In addition, genomic arrays revealed TP53 gene deletions not detected by I-FISH in 2 patients and a copy-neutral loss of heterozygosity (cn-LOH) of the TP53 locus in 8 patients (supplemental Figure 4B). Del(17p) was not identified in any of the patients with low-burden mutations, which was related, at least in part, to the limit of detection for del(17p) analysis (5% positive nuclei).
High-burden, but not low-burden, TP53 mutations shorten the duration of remission after first-line CIT treatment
Analysis of EFS after first-line treatment in patients stratified according to the different TP53 mutation burden showed that only patients with TP53 mutations ≥10% VAF had significantly shortened EFS compared with TP53-wt patients (P < .0001; Figure 2A; Table 2). Shortened EFS was observed irrespective of the presence of del(17p) (supplemental Figure 6A). EFS in patients with TP53 mutations below 10% VAF did not differ significantly from that in patients with TP53-wt (P = .083; supplemental Figure 6B). This finding was in line with the observation that only patients with TP53 mutations of ≥10%, not <10%, VAF had a lower response rate (supplemental Table 7). Low-burden TP53 mutations shortened EFS when neither a 1% nor a 5% threshold was applied (Figure 2A; supplemental Figure 6C).
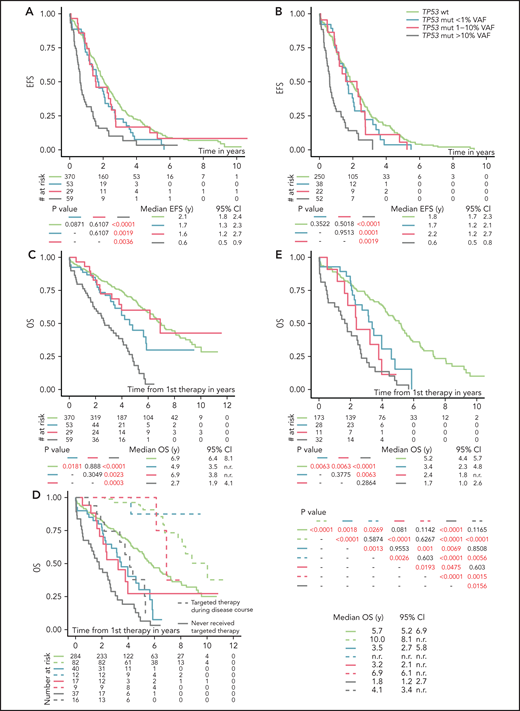
EFS and OS from first line-treatment, stratified according to the TP53 mutation load. (A) EFS of the whole cohort. (B) EFS in patients with unmutated IGHV. (C) OS of the whole cohort. (D) OS in patients stratified according to a targeted treatment. Dashed line, patients received targeted treatment with either BcR inhibitors (ibrutinib, idelalisib, or acalabrutinib) or bcl2 inhibitor (venetoclax) in later stages of the disease. Patients undergoing allogeneic hemapoietic stem cell transplant were excluded (n = 14). (E) OS in a cohort with unmutated IGHV, with patients switched to targeted agents or undergoing allogeneic hemapoietic stem cell transplant excluded. All analyses were also performed for time to second treatment and for FCR-treated patients only, and very similar results were obtained (data not shown).
EFS and OS from first line-treatment, stratified according to the TP53 mutation load. (A) EFS of the whole cohort. (B) EFS in patients with unmutated IGHV. (C) OS of the whole cohort. (D) OS in patients stratified according to a targeted treatment. Dashed line, patients received targeted treatment with either BcR inhibitors (ibrutinib, idelalisib, or acalabrutinib) or bcl2 inhibitor (venetoclax) in later stages of the disease. Patients undergoing allogeneic hemapoietic stem cell transplant were excluded (n = 14). (E) OS in a cohort with unmutated IGHV, with patients switched to targeted agents or undergoing allogeneic hemapoietic stem cell transplant excluded. All analyses were also performed for time to second treatment and for FCR-treated patients only, and very similar results were obtained (data not shown).
Cox proportional hazards model for EFS and OS in univariate and multivariate analyzes in patients entering first-line treatment
| n | EFS | OS | ||||||||||||||||
|---|---|---|---|---|---|---|---|---|---|---|---|---|---|---|---|---|---|---|
| Univariate | Multivariate n = 49 (387 events) | Univariate | Multivariate n = 469 (216 events) | |||||||||||||||
| HR | 95% Cl | P | HR | 95% Cl | P | HR | 95% Cl | P | HR | 95% Cl | P | |||||||
| Age at FLT | ||||||||||||||||||
| <60 y | 129 | — | — | — | — | — | — | — | — | — | — | — | — | — | — | — | — | |
| >60 y | 382 | 1.18 | 0.94 | 1.48 | .1465 | 2.20 | 1.58 | 3.06 | <.0001 | 1.32 | 0.9 | 1.94 | .1558 | |||||
| Sex | ||||||||||||||||||
| Female | 176 | — | — | — | — | — | — | — | — | — | — | — | — | — | — | — | — | |
| Male | 335 | 1.16 | 0.93 | 1.43 | .1855 | — | — | — | — | 0.95 | 0.73 | 1.25 | .7234 | — | — | — | — | |
| RAI | ||||||||||||||||||
| 0+I+II | 208 | — | — | — | — | — | — | — | — | — | — | — | — | — | — | — | — | |
| III+IV | 299 | 1.52 | 1.24 | 1.86 | <.0001 | 1.28 | 1.04 | 1.56 | .0216 | 1.40 | 1.08 | 1.83 | .0120 | 1.13 | 0.85 | 1.51 | .3885 | |
| B2M | ||||||||||||||||||
| <3.5 mg/L | 234 | — | — | — | — | — | — | — | — | — | — | — | — | — | — | — | — | |
| >3.5 mg/L | 257 | 1.17 | 0.95 | 1.43 | .1330 | 2.05 | 1.56 | 2.69 | <.0001 | 1.62 | 1.2 | 2.19 | .0016 | |||||
| TP53 mutation | ||||||||||||||||||
| VAF continual, % | 141 | 1.02 | 1.01 | 1.02 | <.0001 | — | — | — | — | 1.02 | 1.01 | 1.02 | <.0001 | — | — | — | — | |
| TP53 mutation | ||||||||||||||||||
| No | 370 | — | — | — | — | — | — | — | — | — | — | — | — | — | — | — | — | |
| >10% VAF | 59 | 2.84 | 2.11 | 3.83 | <.0001 | 1.98 | 1.31 | 2.98 | .0013 | 3.75 | 2.67 | 5.26 | <.0001 | 2.81 | 1.65 | 4.78 | .0001 | |
| 1-10% VAF | 29 | 1.11 | 0.73 | 1.70 | .6269 | 1.16 | 0.75 | 1.77 | .5100 | 1.04 | 0.59 | 1.83 | .9020 | 1.68 | 1.08 | 2.62 | .0211 | |
| <1% VAF | 53 | 1.34 | 0.97 | 1.84 | .0722 | 1.36 | 0.99 | 1.87 | .0620 | 1.69 | 1.12 | 2.56 | .0124 | 2.02 | 1.13 | 3.62 | .0174 | |
| IGHV* | ||||||||||||||||||
| Mutated | 142 | — | — | — | — | — | — | — | — | — | — | — | — | — | — | — | — | |
| Nonmutated | 362 | 1.92 | 1.50 | 2.46 | <.0001 | 1.76 | 1.35 | 2.28 | <.0001 | 2.07 | 1.47 | 2.92 | <.0001 | 2.78 | 1.9 | 4.06 | <.0001 | |
| FISH† | ||||||||||||||||||
| Normal | 105 | — | — | — | — | — | — | — | — | — | — | — | — | — | — | — | — | |
| Del(17p) | 41 | 3.24 | 2.18 | 4.81 | <.0001 | 2.01 | 1.19 | 3.39 | .0086 | 4.29 | 2.71 | 6.78 | <.0001 | 2.3 | 1.18 | 4.48 | .0140 | |
| Del(11q) | 136 | 1.74 | 1.30 | 2.33 | <.0001 | 1.55 | 1.15 | 2.08 | .0041 | 1.41 | 0.96 | 2.09 | .0825 | 1.43 | 0.95 | 2.15 | .0888 | |
| Trisomy 12 | 67 | 0.88 | 0.61 | 1.28 | .5162 | 0.87 | 0.6 | 1.26 | .4600 | 1.31 | 0.82 | 2.10 | .2648 | 1.1 | 0.66 | 1.84 | .7083 | |
| Del(13q) | 160 | 0.95 | 0.71 | 1.28 | .7506 | 0.98 | 0.73 | 1.33 | .9000 | 1.12 | 0.76 | 1.66 | .5713 | 1.31 | 0.87 | 1.97 | .2009 | |
| Inhibitor treatment‡ | ||||||||||||||||||
| Yes | 119 | — | — | — | — | — | — | — | — | — | — | — | — | — | — | — | — | |
| No | 378 | — | — | — | — | — | — | — | — | 3.29 | 2.24 | 4.83 | <.0001 | 4.16 | 2.79 | 6.21 | <.0001 | |
Statistically significant parameters (P < .05) are shown in bold. Only parameters with P < 0.1 were analyzed in the multivariate models. The following patients with missing data were excluded: for EFS: RAI (n = 4), IGHV (n = 7), and FISH (n = 2); for OS: in addition to patients excluded in EFS, B2M (n = 16), allogeneic stem cell transplantation (excluded from category inhibitor treatment yes/no; n = 14). TP53 mutation VAF was analyzed as a continual parameter only in univariate analysis. In the multivariate model, presence of TP53 mutations was analyzed only as a categorical parameter.
CI, confidence interval; FLT, first-line treatment.
Based on 98% identity threshold.
According to Döhner et al.46
Treatment with BcR or bcl2 inhibitor later during the course of the disease.
Factors significantly influencing EFS in a multivariate model included the presence of high-burden TP53 mutations and del(17p), del(11q), RAI stage, and IGHV mutation status (Table 2). As IGHV mutational status represented the strongest factor that affected EFS, we analyzed patients with mutated and unmutated IGHV separately. EFS in patients with unmutated IGHV corresponded to the results obtained when analyzing the whole cohort (Figure 2B). In patients with mutated IGHV, we did not observe shortened EFS in any TP53-mut subgroup (supplemental Figure 6D), which may be partly attributable to the low number of patients in the individual subgroups.
All TP53 mutations, irrespective of mutation burden, have an inferior impact on OS in CIT-treated patients
OS from first-line therapy was significantly shortened in patients with TP53 mutations of ≥10% VAF compared with those with TP53-wt (P < .0001; supplemental Figure 7A; Table 2). The separate subgroup of patients with low-burden TP53 mutations of <1% VAF also showed a shortened survival (P = .0302), whereas survival of patients with mutations 1% to 10% was similar to TP53-wt–bearing patients (P = .888; Figure 2C).
In a multivariate model, all TP53 mutations, irrespective of VAF, showed an independent impact on OS (Table 2). This finding was true also of mutations 1% to 10% VAF, which did not show significant impact in a univariate model (hazards ratio [HR], 1.04; P = .9020), but it turned out to be significant after removing the impact of other variables (HR, 2.03; P = .0170). Targeted treatment in later stages of the disease was revealed to have the strongest independent impact on OS (HR, 4.16; in patients who did not receive inhibitor treatment; P < .0001). When we stratified the analysis based on the administration of targeted treatment in relapse, prolonged OS was confirmed for all groups of patients switched to targeted treatment (Figure 2D). When only patients who did not receive targeted treatment were considered, the shortest OS was confirmed for high-burden TP53 mutations (Figure 2D), irrespective of the presence of del(17p) (P < .0001; supplemental Figure 7B). Patients with TP53 mutations <10% VAF also showed shortened OS, which was different from patients with TP53-wt (P = .0004) or high-burden TP53-mut (P = .0011; supplemental Figure 7C). The difference from TP53-wt was statistically significant in the subgroup carrying mutations <1% VAF (P = .0018) and showed a trend for mutations that were 1% to 10% VAF (P = .081; Figure 2D). After further stratification of patients based on a 5% VAF threshold, we observed shortened survival only for mutations of 5% to 10% but not of 1% to 5% (P = .005 and P = .4918, respectively; supplemental Figure 7D). When IGHV mutational status was considered, all subgroups of patients carrying TP53 mutations, irrespective of VAF, showed significantly shortened OS in IGHV-unmutated patients (Figure 2E), whereas we were not able to prove significantly different OS between the subgroups in those with mutated IGHV (supplemental Figure 7E).
Next, we explored whether incorporating low-burden TP53 mutations into the CLL-International Prognostic Index (IPI) prognostication model29 would lead to better patient stratification. Both models, CLL-IPI A, involving only high-burden TP53 mutations, and CLL-IPI B, involving all TP53 mutations irrespective of VAF, were significant. However, CLL-IPI B better differentiated patients with a worse prognosis. Reclassification of the patients with low-burden TP53 mutations into higher risk categories led to the identification of patients with significantly shorter survival, compared with patients who remained in the lower risk category (supplemental Table 8; supplemental Figure 8).
FCR treatment represents the main factor driving clonal evolution of low-burden TP53 mutations
In patients with sole low-burden TP53 mutations, we further monitored the evolution of mutated subclones (supplemental Figure 9). Samples from first relapse were available in 52 of 82 (63%) patients, and, in 17 patients, we analyzed residual CLL cells present in remission by using separation based on CLL-specific ROR1 expression.30
In most of the patients, an increase in the TP53 mutation burden was observed (Figure 3A; supplemental Figure 10A-B; supplemental Table 9). Nevertheless, the mutations persisted at a low level or VAF even decreased in some patients. Such a scenario was observed mainly for mutations with <1% VAF.
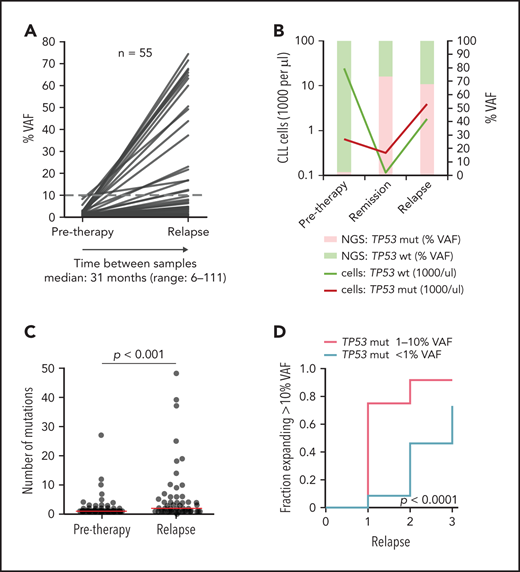
Clonal evolution of low-burden TP53 mutations in patients treated with first-line chemo- and/or immunotherapy. All patients analyzed in relapse and 3 patients with a TP53 mutation expanded in remission with no relapse sample available were included (n = 55; supplemental Figure 9). Mutation with the highest VAF was considered in each case, irrespective of whether it was the same mutation as in a pretreatment sample (for details, see supplemental Table 9). (A) Mutation burden before therapy and during relapse in patients with low-burden TP53 mutations. Dashed line, 10% VAF threshold. For cumulative VAF see supplemental Figure 10B. (B) Estimated fraction of TP53-mutated (TP53-mut) (red line) and TP53-wt cells (green line) before therapy, during remission and after TP53-mut/cnLOH expansion in relapse in patient 1507. Bars, NGS result (right y-axis). (C) Number of mutations before therapy and during relapse. Before treatment: multiple mutations in 18 of 82 (22%) patients, median 1 mutation per patient (range, 1-27); relapse: multiple mutations in 31 of 53 (58%) patients, median 2 mutations per patient (range, 1-48). Red line, median. (D) Proportion of patients, in whom the TP53 mutation exceeded 10% VAF threshold in relapse stratified according to pretherapy subclone size. In total, during median follow-up of 4.1 years (range, 1.3-11.6; median number of therapy lines 2, range 1-3) we observed that the TP53-mut subclone expanded above the 10% VAF threshold in 29 patients.
Clonal evolution of low-burden TP53 mutations in patients treated with first-line chemo- and/or immunotherapy. All patients analyzed in relapse and 3 patients with a TP53 mutation expanded in remission with no relapse sample available were included (n = 55; supplemental Figure 9). Mutation with the highest VAF was considered in each case, irrespective of whether it was the same mutation as in a pretreatment sample (for details, see supplemental Table 9). (A) Mutation burden before therapy and during relapse in patients with low-burden TP53 mutations. Dashed line, 10% VAF threshold. For cumulative VAF see supplemental Figure 10B. (B) Estimated fraction of TP53-mutated (TP53-mut) (red line) and TP53-wt cells (green line) before therapy, during remission and after TP53-mut/cnLOH expansion in relapse in patient 1507. Bars, NGS result (right y-axis). (C) Number of mutations before therapy and during relapse. Before treatment: multiple mutations in 18 of 82 (22%) patients, median 1 mutation per patient (range, 1-27); relapse: multiple mutations in 31 of 53 (58%) patients, median 2 mutations per patient (range, 1-48). Red line, median. (D) Proportion of patients, in whom the TP53 mutation exceeded 10% VAF threshold in relapse stratified according to pretherapy subclone size. In total, during median follow-up of 4.1 years (range, 1.3-11.6; median number of therapy lines 2, range 1-3) we observed that the TP53-mut subclone expanded above the 10% VAF threshold in 29 patients.
We have also recorded a prominent clonal shift favoring the TP53-mut subpopulation in 5 of 17 patients analyzed during remission. Absolute CLL cell counts dramatically decreased in remission in both TP53-wt and TP53-mut cells, but the shrinkage of the TP53-mut subpopulation was less prominent, leading to a change in the ratio between TP53-wt and TP53-mut cells (Figure 3B; supplemental Figure 11). Of patients in whom the samples were analyzed both in remission and in subsequent relapse, the expansion observed in remission was confirmed in relapse in 2 cases. On the other hand, in 4 patients with a stable mutation burden in remission, no significant clonal expansion was observed in relapse.
Overall median VAF fold change of the highest mutation between pretherapy and first relapse samples was 7.2x (range, 0-530; Figure 3A), with a significant increase in the number of TP53 mutations (P < .0001; Figure 3C).
When the increase in proportion of mutations above the currently accepted clinically relevant threshold of 10% VAF was considered, the increase was more frequent in the subgroup with pretreatment TP53 mutations of 1% to 10% VAF than in the group with <1% VAF mutations (P < .0001; Figure 3D). Samples in subsequent relapses were available for 22 (relapse 2) and 5 (relapse 3) patients and showed a gradual expansion of low-burden mutations (Figure 3D; supplemental Table 9).
The clonal expansion of TP53 mutations was accompanied by the deletion of the second allele in 8 of 23 cases with I-FISH and/or single-nucleotide polymorphism array results available, whereas cnLOH was identified in 5 of 10 del(17p)-negative cases with single-nucleotide array results available. In 5 cases, the clone expanded without the inactivation of the second allele (supplemental Table 9). We did not observe any impact of the allele status at expansion on EFS or OS (data not shown).
Next, we analyzed the risk of clonal expansion in first relapse in relation to mutations’ and patients’ characteristics. Of the molecular features analyzed, only mutations classified in the IARC TP53-database as hot spots showed a higher risk of clonal expansion (HR, 4.83; P = .0053; Figure 4A). Analyzing patient characteristics, we found that the factors significantly influencing clonal expansion were FCR treatment and younger age; these were mutually connected, as FCR treatment was indicated for younger patients (Figure 4A-B). Patients with higher expansion rates also tended to have pretherapy VAF >1% and to achieve a complete remission (CR) more often (Figure 4A,C). In a multivariate analysis, only FCR treatment significantly increased the risk of clonal expansion (HR, 6.44; P = .036). The mutation VAF increase in patients treated with FCR was significantly greater than in other patients: 14.8x vs 1.6x (1.9x for BR and 1.4x for other regimens; P = .001 for both comparisons; Figure 4D). The risk of clonal expansion of TP53 mutations in the first relapse >10 times was 64% in patients treated with FCR vs 9% in patients treated with other regimens (Figure 4B; P = .0003).
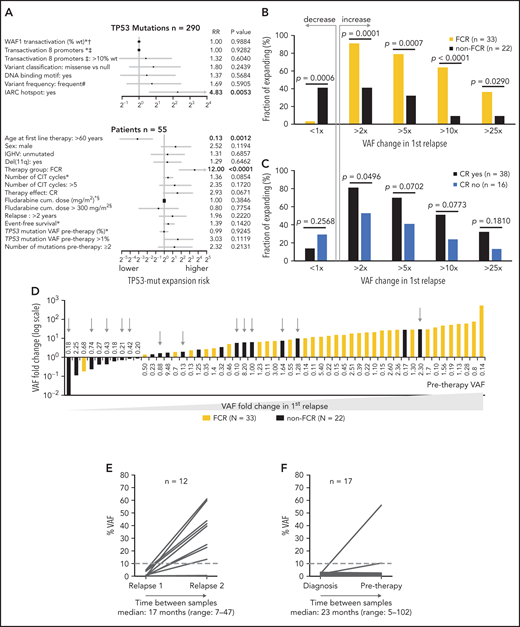
Factors influencing clonal expansion of TP53-mutated subclones. (A) Forrest plot depicting the factors influencing the risk of clonal expansion above the median fold change. *Continual parameter. †As assessed by Kato et al,47 data downloaded from Seshat.28 ‡Average of promoters: WAF1, MDM2, BAX, 14_3_3_s, AIP, GADD45, NOXA, and p53R2, as assessed by Kato et al,7 data downloaded from Seshat.28 Null mutations: nonsense, frameshift, and splice site. In frame mutations excluded from analysis. DNA binding motif as classified by Cho et al.48 #Frequency of mutations categorized according to Seshat28: frequent (very frequent+frequent) vs not frequent+rare+unique+never identified. CR, complete remission. §Fludarabine cumulative dose calculated in FCR-treated patients only. (B) Risk of clonal expansion for patients treated with FCR (orange) and other regimens (black). (C) Risk of clonal expansion for patients reaching (dark blue) and not reaching (light blue) CR. (D) Fold change in mutation proportion in first relapse compared with pretherapy sample in order according fold change. Logarithmic scale x-axis label shows pretherapy VAF. Patients treated with FCR are depicted in orange. Patients treated with other regimens are in black. Patients treated with BR are depicted with a gray arrow. (E) Mutation burden in the first and second relapse in patients with low-burden TP53 mutations treated with second-line FCR. Dashed line, 10% VAF threshold. For cumulative VAF see supplemental Figure 10C. (F) Mutation burden in untreated patients at diagnosis and before therapy in patients with low-burden TP53 mutations. Dashed line, 10% VAF threshold.
Factors influencing clonal expansion of TP53-mutated subclones. (A) Forrest plot depicting the factors influencing the risk of clonal expansion above the median fold change. *Continual parameter. †As assessed by Kato et al,47 data downloaded from Seshat.28 ‡Average of promoters: WAF1, MDM2, BAX, 14_3_3_s, AIP, GADD45, NOXA, and p53R2, as assessed by Kato et al,7 data downloaded from Seshat.28 Null mutations: nonsense, frameshift, and splice site. In frame mutations excluded from analysis. DNA binding motif as classified by Cho et al.48 #Frequency of mutations categorized according to Seshat28: frequent (very frequent+frequent) vs not frequent+rare+unique+never identified. CR, complete remission. §Fludarabine cumulative dose calculated in FCR-treated patients only. (B) Risk of clonal expansion for patients treated with FCR (orange) and other regimens (black). (C) Risk of clonal expansion for patients reaching (dark blue) and not reaching (light blue) CR. (D) Fold change in mutation proportion in first relapse compared with pretherapy sample in order according fold change. Logarithmic scale x-axis label shows pretherapy VAF. Patients treated with FCR are depicted in orange. Patients treated with other regimens are in black. Patients treated with BR are depicted with a gray arrow. (E) Mutation burden in the first and second relapse in patients with low-burden TP53 mutations treated with second-line FCR. Dashed line, 10% VAF threshold. For cumulative VAF see supplemental Figure 10C. (F) Mutation burden in untreated patients at diagnosis and before therapy in patients with low-burden TP53 mutations. Dashed line, 10% VAF threshold.
Focusing on patients with decreasing TP53 mutation burden, they were mainly treated with non-FCR regimens, in contrast to patients with increasing mutation burden (Figure 4D; P = .0006), and they tended to have pretherapy VAF below 1% more often (P = .0503; supplemental Table 10). Admittedly, it was not possible to reliably assess the exact proportion of decreasing mutations because of the variance in the NGS method, which is VAF dependent (supplemental Figure 2B).
In addition, we wanted to explore whether novel, previously undetectable, high-burden mutations occur in relapse. Therefore, we analyzed the TP53 gene in the first relapse in patients classified as TP53-wt before treatment. Of the 205 patients with available samples obtained during relapse, we found 3 (1%) with novel high-burden and 44 (21%) with novel low-burden TP53 mutations.
To verify that intensive CIT accelerates clonal expansion of TP53-mut cells even in patients with relapsed disease, we analyzed paired samples in 12 patients with low-burden TP53 mutations from the original cohort who entered second-line treatment with FCR. The observed expansion rate of low-burden TP53 mutations in the second relapse was similar to first-line treatment (median VAF fold change, 11.8x; range, 0-463.1; Figure 4E; supplemental Table 11).
To further corroborate the impact of selective pressure, we investigated the clonal evolution in untreated patients between diagnosis and initiation of treatment. We analyzed TP53 status in 94 patients, in whom diagnostic samples taken >6 months before first-line treatment were available (for details, see supplemental Methods). Low-burden TP53 mutation was identified in 22 patients, whereas high-burden mutation was found in 5. In most patients, the mutation burden between diagnostic and pretherapy sample remained stable (median VAF fold change, 0.81x; range, 0-29.5); however, in a minority of cases, subclone expansion was recorded even in the absence of therapy selection pressure (Figure 4F; supplemental Table 12).
Targeted agents do not accelerate expansion of TP53-mutated subclones in patients with relapsed CLL in contrast to CIT
To explore TP53 clonal evolution upon treatment with novel agents, we analyzed the TP53 gene in separated B cells in the cohort of patients with relapsed or refractory disease entering treatment with BcR and bcl2 inhibitors (supplemental Table 1). In concordance with the aforementioned finding that the frequency and number of mutations increase during the disease course, we detected 704 mutations in 110 of 159 patients (70%; 57 patients with high-burden and 53 patients with low-burden mutations; median, 2 mutations; range, 0-58 mutations per patient; Figure 5A-B; supplemental Table 13). OS after initiation of targeted treatment in patients in the TP53-mut group did not significantly differ from those in the TP53-wt group, irrespective of VAF (supplemental Figure 12). Factors significantly associated with increased risk of shortened OS in a multivariate model were the number of prior therapy lines >2, the presence of del(17p), and the type of inhibitor treatment (supplemental Table 14).
![TP53 defects and clonal evolution of low-burden TP53 mutations in patients with relapsed disease treated with targeted agents. (A) Composition of TP53 defects. (B) TP53 mutations in 110 patients with CLL, in order according the highest VAF. The highest mutation VAF is depicted in black, and the cumulative mutation VAF is in white. (C) Swimmer plots depicting treatment and TP53 mutation history in patients with low-burden TP53 mutations show patients investigated at the beginning and at the end of inhibitor treatment (top) and patients investigated during inhibitor treatment (bottom). In patients with longer intervals between event and sampling, no intervening CIT was administered. (D) Mutation burden in 20 patients with low-burden TP53 mutations before treatment with targeted agents (ibrutinib, n = 11; acalabrutinib, n = 1; and idelalisib, n = 11), and at the end of treatment. Dashed line, 10% VAF threshold. Three patients were subsequently treated with second inhibitor (blue lines). For cumulative VAF see supplemental Figure 13B. (E) Mutation burden in patients with low-burden TP53 mutations before and during (>1 year) treatment with targeted agents (ibrutinib, n = 11; idelalisib, n = 8; and venetoclax n = 1). For cumulative VAF see supplemental Figure 13C. (F) TP53 mutation VAF fold change in different treatment context. Red line, median; black lines, quartiles. Only significant differences are depicted with asterisks. **P < .01; ***P < .001; ****P < .0001. (G) FISH plots depicting clonal evolution in patients treated with targeted agents with significant clonal shifts in TP53-mut cell population. Patient 338: the most abundant TP53 mutation changed from 1.75% before inhibitor treatment to 54.7% VAF in progression (accompanied with del[17p]), BTKC481S in progression, 71% VAF. Patient 842: the most frequent TP53 mutation changed from 79.2% before inhibitor treatment to 1.1% VAF at the time of Richter’s transformation; BCL2D103E mutation at the time of Richter’s transformation, 41% VAF. Data for creating FISH plots were obtained by whole-exome sequencing from purified peripheral blood CLL cells (supplemental Methods). BTK mutation: NM_000061.2:c.1442G>C, NP_000052.1:p.Cys481Ser; BCL2 mutation: NM_000633.2:c.309C>A, NP_000624.2:p.Asp103Glu.](https://ash.silverchair-cdn.com/ash/content_public/journal/blood/138/25/10.1182_blood.2020009530/6/m_bloodbld2020009530f5.png?Expires=1765907503&Signature=eCGssdrZOzA3D~XYu0af~xVdxlX0wtAw6IUyP2VLCVi8SYrVYzyPiU8lCj7kwIzQYqSBahrRkNXGBNSvuTJDEh0qvJQXiuPGEv5AY7vD337DtxpWsV1tV0cIIqo~nQC2rwsQNmioATkt9bAo4iraXuv2Vu~WUEr9CJ1jaqFZcgxS6RXSDD85atzxBq2E5Z4U10vjDlkt0idzxW44R~eHbIQMFThFPBPkBcuX2kwWD5HUpg7t5s3w5XQuRcoatW8Ud9N5OJsmeC5YfvIU7YHo9-kQxdUlCME9-1u0Aa0-l3yQ25h8UN1XH7DPrcbZfw5I1iS7gzz0wgp98JELsYhJpA__&Key-Pair-Id=APKAIE5G5CRDK6RD3PGA)
TP53 defects and clonal evolution of low-burden TP53 mutations in patients with relapsed disease treated with targeted agents. (A) Composition of TP53 defects. (B) TP53 mutations in 110 patients with CLL, in order according the highest VAF. The highest mutation VAF is depicted in black, and the cumulative mutation VAF is in white. (C) Swimmer plots depicting treatment and TP53 mutation history in patients with low-burden TP53 mutations show patients investigated at the beginning and at the end of inhibitor treatment (top) and patients investigated during inhibitor treatment (bottom). In patients with longer intervals between event and sampling, no intervening CIT was administered. (D) Mutation burden in 20 patients with low-burden TP53 mutations before treatment with targeted agents (ibrutinib, n = 11; acalabrutinib, n = 1; and idelalisib, n = 11), and at the end of treatment. Dashed line, 10% VAF threshold. Three patients were subsequently treated with second inhibitor (blue lines). For cumulative VAF see supplemental Figure 13B. (E) Mutation burden in patients with low-burden TP53 mutations before and during (>1 year) treatment with targeted agents (ibrutinib, n = 11; idelalisib, n = 8; and venetoclax n = 1). For cumulative VAF see supplemental Figure 13C. (F) TP53 mutation VAF fold change in different treatment context. Red line, median; black lines, quartiles. Only significant differences are depicted with asterisks. **P < .01; ***P < .001; ****P < .0001. (G) FISH plots depicting clonal evolution in patients treated with targeted agents with significant clonal shifts in TP53-mut cell population. Patient 338: the most abundant TP53 mutation changed from 1.75% before inhibitor treatment to 54.7% VAF in progression (accompanied with del[17p]), BTKC481S in progression, 71% VAF. Patient 842: the most frequent TP53 mutation changed from 79.2% before inhibitor treatment to 1.1% VAF at the time of Richter’s transformation; BCL2D103E mutation at the time of Richter’s transformation, 41% VAF. Data for creating FISH plots were obtained by whole-exome sequencing from purified peripheral blood CLL cells (supplemental Methods). BTK mutation: NM_000061.2:c.1442G>C, NP_000052.1:p.Cys481Ser; BCL2 mutation: NM_000633.2:c.309C>A, NP_000624.2:p.Asp103Glu.
TP53 defects and clonal evolution of low-burden TP53 mutations in patients with relapsed disease treated with targeted agents. (A) Composition of TP53 defects. (B) TP53 mutations in 110 patients with CLL, in order according the highest VAF. The highest mutation VAF is depicted in black, and the cumulative mutation VAF is in white. (C) Swimmer plots depicting treatment and TP53 mutation history in patients with low-burden TP53 mutations show patients investigated at the beginning and at the end of inhibitor treatment (top) and patients investigated during inhibitor treatment (bottom). In patients with longer intervals between event and sampling, no intervening CIT was administered. (D) Mutation burden in 20 patients with low-burden TP53 mutations before treatment with targeted agents (ibrutinib, n = 11; acalabrutinib, n = 1; and idelalisib, n = 11), and at the end of treatment. Dashed line, 10% VAF threshold. Three patients were subsequently treated with second inhibitor (blue lines). For cumulative VAF see supplemental Figure 13B. (E) Mutation burden in patients with low-burden TP53 mutations before and during (>1 year) treatment with targeted agents (ibrutinib, n = 11; idelalisib, n = 8; and venetoclax n = 1). For cumulative VAF see supplemental Figure 13C. (F) TP53 mutation VAF fold change in different treatment context. Red line, median; black lines, quartiles. Only significant differences are depicted with asterisks. **P < .01; ***P < .001; ****P < .0001. (G) FISH plots depicting clonal evolution in patients treated with targeted agents with significant clonal shifts in TP53-mut cell population. Patient 338: the most abundant TP53 mutation changed from 1.75% before inhibitor treatment to 54.7% VAF in progression (accompanied with del[17p]), BTKC481S in progression, 71% VAF. Patient 842: the most frequent TP53 mutation changed from 79.2% before inhibitor treatment to 1.1% VAF at the time of Richter’s transformation; BCL2D103E mutation at the time of Richter’s transformation, 41% VAF. Data for creating FISH plots were obtained by whole-exome sequencing from purified peripheral blood CLL cells (supplemental Methods). BTK mutation: NM_000061.2:c.1442G>C, NP_000052.1:p.Cys481Ser; BCL2 mutation: NM_000633.2:c.309C>A, NP_000624.2:p.Asp103Glu.
Of the patients with low-burden TP53 mutations present before first or second inhibitor treatment, samples from the termination of therapy were available in 20 (Figure 5C; supplemental Figure 13A) and did not show a marked expansion rate (median VAF fold change: 1x; range, 0-31.3; Figure 5D; supplemental Figure 13B; supplemental Table 15). Similar results were obtained when analyzing residual CLL cells in samples of 20 patients during inhibitor therapy (>1 year from initiation of therapy; median VAF fold change, 0.8x; range, 0-8.1; Figure 5E; supplemental Figure 13C). These findings were in sharp contrast to expansion rates after both first- and second-line FCR (P < .0001 and P = .0021, respectively) and comparable to expansion rates in untreated patients and patients treated with other regimens (Figure 5F). We observed prominent expansion of the TP53 defect in only one patient, who was found to be carrying the BTKC481S mutation at the time of progression, suggesting that it arose within a TP53Y103 subclone (patient 338; Figure 5G). Conversely, the elimination of the TP53-mut subclone was recorded in 2 patients. The first patient progressed during treatment with ibrutinib, with a novel BTKC481S mutation having occurred and a TP53Y205D mutation having decreased from 5.2% (sample taken 2 months after initiation of therapy) to 0.15% VAF in progression (patient 5). The other patient died of Richter’s transformation after venetoclax therapy accompanied by a decrease in the TP53R273C mutation and concurrent expansion of the BCL2D103E mutation (patient 842; Figure 5G). Apart from this patient, the variant allelic fraction remained stable in patients carrying high-burden TP53 mutations (n = 20; median fold change, 1x; supplemental Figure 13D). Of 15 patients with TP53-wt, a new low-burden TP53 mutation was identified in 3 at the end of targeted treatment, all of them present in very low VAFs (0.13%, 0.21%, and 0.22%; supplemental Figure 13D).
Discussion
According to current TP53 recommendations published by the European Research Initiative on Chronic Lymphocytic Leukemia in 2018,6 only TP53 mutations above the consensual Sanger sequencing–like threshold of 10% VAF should be clinically reported. When reporting mutations between 5-10% VAF, the notion about their uncertain clinical significance should always be included. In 2021, this recommendation is still valid, and the reasons for maintaining this conservative threshold for reporting are technical difficulties in detecting low-burden mutations31 and lack of clinical evidence. Because TP53 gene mutations remain a predominant indication for treatment with targeted agents in many countries, there is a need to reevaluate the 10% VAF threshold to expand the group of patients eligible for this type of treatment. To conduct this reassessment, sufficient evidence is needed from patient cohorts requiring treatment in line with CLL guidelines for TP53 testing.5 However, most studies published on this topic have thus far used samples taken at diagnosis or in early stages of the disease14,18,19,22; therefore, we focused on patients entering first-line treatment in common clinical practice.
We showed that minor clone TP53 mutations are frequent at the initiation of treatment, and these mutations share the same molecular characteristics as high-burden mutations, confirming that they do not represent sequencing artifacts. By analyzing the clinical impact of mutations with different allelic burden, we confirmed the unequivocal negative impact of TP53 mutations >10% VAF on EFS after treatment, as well as on OS, independent of the presence of del(17p). This result was prominent in all patient subgroups analyzed, except for those with mutated IGHV, in which case we were unable to confirm shortened survival of the TP53-mut subgroup because of the low patient count and insufficient follow-up. The previously published data showed that patients with mutated IGHV and TP53 defects may have a better prognosis than patients with a TP53 defect and unmutated IGHV32-34; however, the prognostic impact of TP53 mutations within the IGHV-mutated subgroup remains unclear and warrants investigation in larger cohorts.
In patients with low-burden TP53 mutations, no significant impact on duration of remission was observed when compared with that of patients carrying an intact TP53 gene. In contrast, OS was shortened in those patients. However, a significant difference from the TP53-wt in the whole cohort was proved only in patients carrying mutations of <1%, not in those with mutations between 1% and 10% VAF. This result may seem paradoxical, but it was most likely influenced by 2 factors: first, OS was strongly influenced by switching to targeted treatment, which significantly prolonged the survival of patients with later-expanded TP53 mutation; second, IGHV mutational status plays an important independent role. These presumptions were supported by the results obtained after having limited the cohort to unmutated IGHV and after having excluded patients receiving inhibitor treatment; this analysis showed a negative impact of all low-burden TP53 mutations irrespective of VAF. The median OS of patients with low-burden TP53 mutations was between the OS of those with high-burden TP53-mut and TP53-wt, in concordance with the results from the UK LRF CLL4 trial,20 in which, similar to our cohort, patients at initiation of first-line treatment were included. Studies focusing on early stages of the disease, with a larger proportion of patients bearing mutated IGHV, have mostly shown OS of patients with low-burden TP53 mutations to be similar to those with high-burden mutations.14,18,22 In contrast, a study of patients in relapse included in the Complement 2 trial21 suggested shortened response duration, but not OS, in patients with low-burden TP53 mutations. The reason for the different result may be the short follow-up for showing the difference in OS and a larger proportion of TP53 mutations with 5% to 10% VAF in this trial, which shortened progression-free survival.
The different impact of low-burden TP53 mutations on EFS and OS, observed in our cohort is most likely attributable to the fact that the mutated subclones often expanded during relapse, and their negative impact manifested only when the clonal burden reached a certain threshold. The critical threshold at which the TP53-mut subpopulation manifests is debatable. The current conventional threshold of 10% is arbitrary, and the 5% VAF threshold accepted in TP53 recommendations for reporting is also currently under discussion. Our analysis of patients with mutations between 5% and 10% VAF suggests that these patients may in fact have a prognosis similar to patients carrying high-burden TP53 mutations. Admittedly, this subcohort does not contain enough patients to derive any reliable conclusions (n = 6), and a large multicenter series would be needed to arrive at a clinically relevant threshold.
As our data suggest that clonal expansion is likely the main factor contributing to the inferior survival of patients with low-burden TP53 mutations, we further performed longitudinal monitoring of the clonal evolution of these subclones to assess the risk of clonal expansion and to explore which factors are involved. For most of the low-burden TP53 mutations, we observed that the mutation burden increased during relapse after chemo- and/or immunotherapy, but persisting and diminishing mutations were also recorded, mainly among mutations <1% VAF. According to our observation, the risk of an expanding TP53 mutation crossing the current threshold of 10% VAF in first relapse is significantly higher in patients carrying mutations of >1% VAF, compared with those with <1% that often expanded in later relapses. This result reflects the kinetics of clonal expansion, allowing for mutations of >1% to reach the 10% threshold earlier. In line with the gradual-expansion hypothesis, novel previously undetectable high-burden TP53 mutations identified in relapse were rare, whereas novel low-burden mutations were observed frequently.
The analysis of factors influencing the risk of TP53 mutation clonal expansion revealed that, apart from assigned IARC hot spots, the most important parameter involved is treatment with the FCR regimen. This result corresponds with a previous study analyzing copy number alterations (CNAs) in serial samples from individuals treated in the CLL8 trial, where the clinical feature significantly associated with CNA evolution was FCR therapy compared with fludarabine and cyclophosphamide treatment.15 In this study, the FCR superiority regarding CNA evolution was attributed to early low minimal residual disease and thus was likely caused by the strong overall selection pressure imposed by CIT. Despite lacking information on minimal residual disease in our study, our data regarding clinical response are in line with this, as patients with higher expansion rates tended to achieve CR more often. This observation advocates that elimination of the TP53-wt population represents a key factor in the clonal selection of TP53-deficient cells, as was also shown in the remission samples. Regarding response duration, the situation is more complex, as, on the one hand, patients reaching CR have longer responses; on the other, a changing ratio of CLL cells in favor of an aggressive TP53-mut subclone may be followed by rapid disease relapse.
Upon treatment with less intense therapeutic regimens and in patients during the “watch-and-wait” period, only isolated cases of expansion were observed. These events may be ascribed to the fact that, although CIT treatment strongly accelerates clonal expansion, p53 inactivation results in an aggressive phenotype compared with cells with intact p53 even if no therapy is administered.35,36 In addition, TP53 defects may facilitate the coexistence of other aggressive genomic features.37
Contrary to the first-line and relapse FCR treatment, targeted treatment did not accelerate the clonal expansion of low-burden TP53-mutated subclones in our cohort of patients with relapsed disease. In line with the premise that CLL cells under targeted treatment favor defects overcoming the selective pressure (ie, those causing treatment resistance),38-40 we observed TP53-mut clonal shifts only in patients developing novel resistance-associated mutations after both ibrutinib and venetoclax treatment. This result is in agreement with published data,41 suggesting that genetic events driving resistance to targeted treatment may overcome the clonal advantage of TP53-deficient cells or may arise within a TP53-deficient subclone. Our observation that BcR and bcl-2 inhibitors do not accelerate low-burden TP53-mut clonal evolution should be confirmed in cohorts of patients treated with novel agents in the frontline setting. This issue has not been explored in clinical studies, and the published data are preliminary.17 Another limitation of our study consists in scarce data regarding venetoclax; the selection pressure upon this type of treatment should be explored on larger cohorts.
Patients with high-burden TP53 defects greatly benefit from targeted treatment, as was also confirmed in the present study in patients in relapse treated outside the clinical trial. Nevertheless, TP53 defects appear to maintain their adverse prognostic effect, even after treatment with inhibitor therapies.4,42-45 Increased risks associated with high-burden TP53 defects support the use of targeted agents for patients with low-burden TP53 mutations in the first-line setting to prevent undesirable clonal expansion that can facilitate genomic instability and further clonal evolution. Hence, when the technical quality is guaranteed,31 we propose that mutations below 10% VAF should also be clinically reported.
Acknowledgments
The authors thank CF Genomics Central European Institute of Technology, Masaryk University (CEITEC MU) supported by the National Centre of Medical Genomics (NCMG) research infrastructure (LM2018132 funded by Ministry of Education, Youth, and Sport of the Czech Republic [MEYS CR]) for their support in obtaining the scientific data presented herein; Hana Skuhrova Francova, diagnostician, and Kamila Stranska, researcher, for providing the data on IGHV mutation status; Andrea Mareckova and Alzbeta Vasikova, diagnosticians, for providing data on resistance-associated mutations; and Francesco Muto for proofreading the manuscript.
This work was supported by European Regional Development Fund-Project “A-C-G-T” (CZ.02.1.01/0.0/0.0/16_026/0008448); projects MZCR-RVO 65269705, GA19-15737S, GA19-11299S, MUNI/A/1595/2020, and MH CR-AZV NV19-03-00091; and in part, by research funding from Abbvie company (M.D.).
Authorship
Contribution: J. Malcikova, S. Pavlova, and B.K.V. designed the study, performed experimental work and wrote the manuscript; K. Plevova, J.K., M.Z., B.D., K.Z., and E.O. performed the experimental work; L.R. performed the statistical analyses; J.H., K. Pal, and N.T. contributed the bioinformatics; A.P., Y.B., and M.D. provided patient data; B.T. helped with the NGS design; and J. Mayer, M.D., and S. Pospisilova designed the study.
Conflict-of-interest disclosure: M.D. received a research grant from Abbvie. The remaining authors declare no competing financial interests.
Correspondence: Sarka Pospisilova, Masaryk University and University Hospital Brno, Kamenice 5, 625 00 Brno, Czech Republic; e-mail: sarka.pospisilova@ceitec.muni.cz.
For original data, please contact sarka.pospisilova@ceitec.muni.cz.
The online version of this article contains a data supplement.
There is a Blood Commentary on this article in this issue.
The publication costs of this article were defrayed in part by page charge payment. Therefore, and solely to indicate this fact, this article is hereby marked “advertisement” in accordance with 18 USC section 1734.

This feature is available to Subscribers Only
Sign In or Create an Account Close Modal