

Key Points
A T-cell bispecific antibody targeting intracellular WT1 presented on HLA-A2 for treatment of AML is characterized in vitro and in vivo.
The novel, clinical-stage WT1-TCB mediated high-level killing of primary AML cells, which was enhanced by the addition of lenalidomide.

Abstract
Antibody-based immunotherapy is a promising strategy for targeting chemoresistant leukemic cells. However, classical antibody-based approaches are restricted to targeting lineage-specific cell surface antigens. By targeting intracellular antigens, a large number of other leukemia-associated targets would become accessible. In this study, we evaluated a novel T-cell bispecific (TCB) antibody, generated by using CrossMAb and knob-into-holes technology, containing a bivalent T-cell receptor–like binding domain that recognizes the RMFPNAPYL peptide derived from the intracellular tumor antigen Wilms tumor protein (WT1) in the context of HLA-A*02. Binding to CD3ε recruits T cells irrespective of their T-cell receptor specificity. WT1-TCB elicited antibody-mediated T-cell cytotoxicity against AML cell lines in a WT1- and HLA-restricted manner. Specific lysis of primary acute myeloid leukemia (AML) cells was mediated in ex vivo long-term cocultures by using allogeneic (mean ± standard error of the mean [SEM] specific lysis, 67 ± 6% after 13-14 days; n = 18) or autologous, patient-derived T cells (mean ± SEM specific lysis, 54 ± 12% after 11-14 days; n = 8). WT1-TCB–treated T cells exhibited higher cytotoxicity against primary AML cells than an HLA-A*02 RMF-specific T-cell clone. Combining WT1-TCB with the immunomodulatory drug lenalidomide further enhanced antibody-mediated T-cell cytotoxicity against primary AML cells (mean ± SEM specific lysis on days 3-4, 45.4 ± 9.0% vs 70.8 ± 8.3%; P = .015; n = 9-10). In vivo, WT1-TCB–treated humanized mice bearing SKM-1 tumors exhibited a significant and dose-dependent reduction in tumor growth. In summary, we show that WT1-TCB facilitates potent in vitro, ex vivo, and in vivo killing of AML cell lines and primary AML cells; these results led to the initiation of a phase 1 trial in patients with relapsed/refractory AML (#NCT04580121).
Introduction
Recruitment of T cells to tumor cells by T-cell–recruiting antibody constructs is a proven and effective way to treat cancer independently of preexisting tumor-specific T cells.1-5 Blinatumomab, a bispecific T-cell engager (BiTE, Amgen, Thousand Oaks, CA) consisting of 2 single-chain variable fragments directed against CD3xCD19, has been approved for the treatment of Philadelphia chromosome–positive and –negative, relapsed or refractory B-cell precursor acute lymphoblastic leukemia.6,7 Several other bispecific antibodies having different targets, mainly lineage antigens, are currently being evaluated in clinical trials.8-15 However, these targets are indiscriminate between healthy and tumor cells. Whereas a depleted healthy compartment is manageable in cases of B-cell malignancy, targeting lineage antigens in myeloid malignancies is associated with the risk of hematotoxicity and poses a potential safety concern.16,17
In contrast, the intracellular antigen Wilms tumor protein (WT1) displays a rather restricted expression profile. It is a transcriptional and post-transcriptional regulator playing crucial roles in embryonic development and organ homeostasis.18,19 In adults, WT1 expression is restricted to a few tissues (kidney podocytes; Sertoli and granulosa cells in the testes and ovaries, respectively; a few mesothelial cells; and 1% of bone marrow cells).18-21 In addition to its physiological role in healthy cells, WT1 has reportedly contributed to the development of cancer, although its specific function in relation to this observation is not completely understood. WT1 is overexpressed in leukemias and solid cancers and is therefore widely regarded as a potential target antigen for immunotherapeutic approaches.22,23
Targeting intracellular antigens with antibody constructs requires their binding to an HLA-restricted peptide epitope. For WT1, several epitopes have been identified. In particular, the nonapeptide WT1126–134 (RMFPNAPYL; “RMF”), which is presented on HLA-A*02, has been targeted in the context of several cancer entities, including acute myeloid leukemia (AML).24-26
Few approaches for targeting WT1 have reached clinical development. In a phase 1/2 clinical trial, adoptive transfer of donor-derived ex vivo–expanded, WT1-specific CD8+ T cells was shown to be safe and to result in antileukemic activity.27 Adoptively transferred WT1RMF-specific T-cell receptor (TCR)-transgenic T cells were also shown to be safe and to persist in patients with refractory AML or high-risk myelodysplastic syndrome taking part in a phase 1 clinical trial; they were able to prevent relapse if administered posttransplant, supporting further evaluation of this target.28,29 In a phase 2 clinical trial for postremission therapy of AML, vaccination with dendritic cells electroporated with WT1 messenger RNA (mRNA) was shown to reduce the risk of relapse after standard chemotherapy.30,31 Various WT1 peptide vaccines have been tested in phase 1 and phase 2 clinical trials.32 In preclinical studies, the therapeutic efficacy of WT1-specific chimeric antigen receptor T cells was shown in a xenograft mouse model.33 Antibody-based immunotherapeutic approaches with TCR-mimicking T cell–recruiting antibodies have also been developed but could not be translated from mouse models into the clinic.34-37 WT1 has thus been validated as a safe and promising target antigen independently of the genetic subtype of AML.
In the current study, we evaluated a novel T-cell bispecific (TCB) antibody based on the TCR-like antibody 11D06 for the immunotherapy of AML. The TCB is directed against WT1 by recognition of the WT1RMF peptide, which is processed and presented on HLA-A*02. In contrast to the aforementioned approaches, the construct relies on bivalent recognition of the tumor antigen, which is facilitated by an additional Fab domain fused to the N terminus of the VL domain of a CrossMAbVH-VL.38-40 This results in a trivalent “2 + 1” immunoglobulin G (IgG) antibody for bivalent recognition of WT1–peptide major histocompatibility complexes (pMHC). Complementary monovalent binding to CD3ε in the TCR complex recruits T cells irrespective of their specificity. The TCB is based on human IgG1 and contains a mutated Fc region with a P329G LALA mutation; this confers extended half-life properties but excludes complement-dependent cellular cytotoxicity and antibody-dependent cellular cytotoxicity. Upon crosslinking, T cells are activated to form an immunologic synapse, which induces apoptosis in tumor cells via the perforin/granzyme apoptosis pathway.41
Methods
Patients
Peripheral blood (PB) or bone marrow samples were collected from healthy donors (HDs) and patients with AML at primary diagnosis, relapse, or complete remission after written informed consent was received in accordance with the Declaration of Helsinki and approval was granted by the Institutional Review Board of the Ludwig-Maximilian-Universität (Munich, Germany).
WT1-TCB antibody generation and selection
Antibodies specific for the WT1-RMF peptide HLA-A*02 complex were generated by using phage display using standard protocols (further details are given in the supplemental Data, available on the Blood Web site).42 Of 34 complex-recognizing clones, the 11D06 antibody was selected due to its selectivity profile and characterization in cell assay, and reformatted into a trivalent 2 + 1 IgG TCB antibody for bivalent recognition of the WT1–pMHC complex and monovalency for the CD3ε chain of the TCR. This was facilitated by fusion of a second Fab domain to the N terminus of the VL domain of the anti-CD3ε Fab, resulting in a heterotrimeric CrossMAbVH-VL.38 Introduction of a P329G LALA mutation43 renders it inactive for complement-dependent cytotoxicity. For the work presented here, two different CD3ε binders were incorporated, one based on the humanized antibody V9 derived from UCHT1, resulting in “WT1-TCB,” and one related to the antibody Sp34 termed CH2527, yielding “WT1-TCB*.” Both variants exhibited comparable potency in vitro and in vivo (supplemental Figure 1; Table 1). Accordingly, “WT1-TCB” is used throughout the article to refer to both constructs.
Affinities of WT1-TCB
| pMHC affinity | pMHC avidity | CD3 affinity |
|---|---|---|
| KD = 50 nM (25°C) ka = 7.7 ± 0.0 ×10⁵ 1/M s (37°C) kd = 3.7 ± 0.0 ×10⁻² 1/s (37°C) | 0.45 nM | WT1-TCB KD = 3.7 ± 0.8 nM (25°C) 11.3 ± 0.1 nM (37°C) ka = 1.4 ± 0.0 ×10⁵ 1/M s (37°C) kd = 1.6 ± 0.0 ×10⁻³ 1/s (37°C) WT1-TCB* KD = 3.0 ± 0.1 nM (25°C) 6.3 ± 0.2 nM (37°C) ka = 2.1 ± 0.1 ×10⁶ 1/M s (37°C) kd = 1.3 ± 0.0 ×10⁻² 1/s (37°C) |
KD, equilibrium dissociation constant; ka, association rate constant; kd, dissociation rate constant.
All antibodies were purified from transiently transfected HEK293-EBNA or CHO cells via protein A affinity chromatography and size exclusion chromatography.41,44,45 Affinities and avidities were characterized in surface plasmon resonance experiments by using a Biacore T200 (GE Healthcare, Chicago, IL).
Flow cytometry, cytokine quantification, and real-time polymerase chain reaction
Surface expression of CD33 (REA775), CD2 (REA972; both Miltenyi Biotec, Bergisch Gladbach, Germany), CD69 (FN50), PD1 (29F.1A12), TIM-3 (F38-2E2), CD45RA (HI100), and CCR7 (G43H7; all BioLegend, San Diego, CA) was assessed by using flow cytometry (CytoFLEX S, Beckman Coulter, Krefeld, Germany). Cytokine concentrations in cell culture supernatants were quantified by using the Human Th1/Th2 Cytokine Kit (BD Biosciences, Heidelberg, Germany). Alternatively, cytokines were measured on a Luminex 100 Analyzer (Bio-Rad, Hercules, CA) by using a custom ProcartaPlex panel (Invitrogen, Vienna, Austria). WT1 expression levels were quantified by using real-time quantitative polymerase chain reaction (qPCR), as previously described.46
In vitro dose–response assays
T cells were isolated from PB of HDs and cocultured with tumor cell lines at an effector-to-target (E:T) ratio of 4:1 in the presence of various concentrations of WT1-TCB*. Mean specific lysis was assessed by flow cytometry and calculated relative to a control antibody construct (Ctrl-TCB) that recognizes a nontumor target derived from the human antibody germline repertoire.
Ex vivo short- and long-term cytotoxicity assays
Primary AML cells were thawed and pre-cultivated on a feeder layer of irradiated murine MS5 stromal cells in a 6-well plate for 3 to 4 days. For short-term cytotoxicity assays, cells were subsequently labeled with CellTrace Far Red (Life Technologies, Eugene, OR) to assess specific lysis. Cells were cocultured for 72 hours with autologous or HD peripheral blood mononuclear cells (PBMCs) at an E:T ratio of 5:1 and with various concentrations of WT1-TCB.
Ex vivo long-term cytotoxicity assays were performed as previously described.47 After pre-cultivation on MS5 cells, primary AML cells were transferred onto a fresh feeder layer in a 96-well plate. WT1-TCB* was added at a concentration of 10 nM and HD T cells at an E:T ratio of 1:4 to 1:5 for 14 days.
Downstream TCR signaling
Downstream TCR signaling was measured by cocultivation of primary AML cells with NFAT Luciferase Reporter Jurkat cells (MilliporeSigma, Burlington, MA). Primary AML cells were precultured in the aforementioned culture system, followed by cocultivation with reporter cells in the presence of WT1-TCB* at an E:T ratio of 1:1 for 16 hours. Luminescence was induced by using the Bright-Glo Luciferase Assay System (Promega, Fitchburg, WI) and measured on an Infinite M1000 Plate Reader (Tecan, Männedorf, Switzerland).
In vivo studies with humanized mice
NSG mice (NOD.Cg-Prkdcscid-Il2rgtm1Wjl/SzJ) were humanized with human HLA-A*02+ CD34+ cord blood cells (details are provided in the supplemental Data). After successful engraftment and development of human T cells, 1 × 10⁷ WT1-expressing HLA-A*02+ SKM-1 tumor cells were subcutaneously inoculated. After 7 days, when tumor size reached an average volume of 150 mm3, mice received weekly administrations of 1 mg/kg WT1-TCB or histidine buffer (vehicle) for 6 weeks. The experimental study protocol was reviewed and approved by local government authorities (2011-128).
In vivo study with AML patient–derived xenograft cells
NSG mice were engrafted with patient-derived xenograft (PDX) cells expressing enhanced firefly luciferase, and tumor burden was monitored by bioluminescence imaging as previously described.48 After successful engraftment, HD T cells were transplanted, followed by weekly administration of 3 mg/kg WT1-TCB or Ctrl-TCB beginning on day 30. One WT1-TCB–treated mouse died during imaging on day 32. The experimental study protocol was reviewed and approved by local government authorities (ROB-55.2-2532.Vet_02-20-159).
Results
Quantitative PCR shows WT1 is expressed in >90% of AML samples at initial diagnosis and at relapse
We analyzed WT1 expression levels in PBMCs of 112 patients with AML by using quantitative real-time PCR at initial diagnosis, in remission, and at time of relapse or in refractory patients (Figure 1A). WT1 expression, defined as >10 WT1 copies per 104 copies of ABL, was observed in 59 of 65 AML patient samples taken at the time of initial diagnosis.49 Moreover, WT1 expression levels correlated with the percentage of AML blasts: expression was observed in 2 of 26 samples taken at the time of complete remission with a blast percentage <5%. Conversely, upon relapse or in refractory disease, WT1 was expressed in 17 of 21 cases. Furthermore, WT1 expression was observed in 79% (n = 38) of cancer cell lines (Figure 1B).
![Analysis of WT1 expression in primary AML cells and tumor cell lines by real-time qPCR. (A) WT1 expression in primary AML cells at different time points during the course of the disease (primary diagnosis, n = 65; posttherapy, n = 26; relapsed/refractory, n = 21). (B) WT1 expression in tumor cell lines (n = 37). (C) Correlation of blast count and WT1 expression in bone marrow (BM) samples of patients with AML at primary diagnosis (n = 38) and posttherapy (n = 24). (D) Correlation of WT1 expression and NPM1 (wild-type [wt], n = 37; mutant [mut], n = 25), FLT3-ITD (wt, n = 45; mut, n = 17), and CEBPA (wt, n = 34; mut, n = 6) mutational status. Bars represent mean ± SEM. Statistical analysis: Mann-Whitney U test. **P < .01, ****P < .0001.](https://ash.silverchair-cdn.com/ash/content_public/journal/blood/138/25/10.1182_blood.2020010477/8/m_bloodbld2020010477f1.png?Expires=1763475512&Signature=z29FN-S9~H7yg6FH6E5Tn668JJegG6vPCfFQociKZnTPjT~INzCYS1tIoAYIN4-IYIlTnEaDyQPi8yDjNYQL3LEE4MPQKU9x5bCL818loWE8uBCOAsBZ50nSYSDHCET0BBCi1bdVC6kUBIFr4089AsY4DLu7VApYLs5XGWNrBFZfPgsOTaBzzkm8DRI2xDwVY7YbqQZRY9~4H318QWvg8Go7mPCxdc~gCO8p3iUv0ZNcpKje9GJn~zLJGvT~1vI3O7lWaVgtOzideh-r6AA0ci7wOBBzi9GoUuIxbiGPzruFBb~YCfo1MDl2rxBWZl88cJMVKFNBHucDzS9ZHoSgEA__&Key-Pair-Id=APKAIE5G5CRDK6RD3PGA)
Analysis of WT1 expression in primary AML cells and tumor cell lines by real-time qPCR. (A) WT1 expression in primary AML cells at different time points during the course of the disease (primary diagnosis, n = 65; posttherapy, n = 26; relapsed/refractory, n = 21). (B) WT1 expression in tumor cell lines (n = 37). (C) Correlation of blast count and WT1 expression in bone marrow (BM) samples of patients with AML at primary diagnosis (n = 38) and posttherapy (n = 24). (D) Correlation of WT1 expression and NPM1 (wild-type [wt], n = 37; mutant [mut], n = 25), FLT3-ITD (wt, n = 45; mut, n = 17), and CEBPA (wt, n = 34; mut, n = 6) mutational status. Bars represent mean ± SEM. Statistical analysis: Mann-Whitney U test. **P < .01, ****P < .0001.
Analysis of WT1 expression in primary AML cells and tumor cell lines by real-time qPCR. (A) WT1 expression in primary AML cells at different time points during the course of the disease (primary diagnosis, n = 65; posttherapy, n = 26; relapsed/refractory, n = 21). (B) WT1 expression in tumor cell lines (n = 37). (C) Correlation of blast count and WT1 expression in bone marrow (BM) samples of patients with AML at primary diagnosis (n = 38) and posttherapy (n = 24). (D) Correlation of WT1 expression and NPM1 (wild-type [wt], n = 37; mutant [mut], n = 25), FLT3-ITD (wt, n = 45; mut, n = 17), and CEBPA (wt, n = 34; mut, n = 6) mutational status. Bars represent mean ± SEM. Statistical analysis: Mann-Whitney U test. **P < .01, ****P < .0001.
Similarly, WT1 expression in bone marrow samples correlated to the percentage of blasts (Figure 1C). WT1 expression was observed in 35 of 38 samples taken at primary diagnosis. In posttherapy samples, WT1 expression was detected in 1 of 8 cases in which the blast percentage was <5%. On the contrary, 10 of 16 samples were WT1 positive if the blast percentage exceeded 5% as a result of relapsed or refractory disease.
The WT1 expression level (mean ± standard error of the mean [SEM]) tended to be higher for NPM1 mutant samples compared with wild-type (1055 ± 251 vs 985 ± 429 WT1 copies/104 ABL copies; P = .1) and was higher in samples with mutated FLT3-ITD (2155 ± 922 vs 582 ± 103 WT1 copies/104 ABL copies; P < .05) and lower in CEBPA mutant samples (92 ± 43 vs 1299 ± 482 WT1 copies/104 ABL copies; P < .005) (Figure 1D).
Specific binding to WT1RMF–pMHC complexes
For the work presented here, trivalent 2 + 1 IgG TCB antibodies were generated with bivalent recognition of the WT1RMF–pMHC complex and monovalency for the CD3ε chain of the TCR (Figure 2A). The monovalent affinities of WT1-TCB for CD3ε and WT1–pMHC as determined by surface plasmon resonance are shown in Table 1.
![Structure of WT1-TCB, mode of action, binding motif, and crystallography. (A) Scheme of WT1-TCB–mediated T-cell engagement. (B) Binding motif as determined by alanine scanning and pMHC array. Anchor residues Met2 and Leu9 (marked in blue) can be replaced by few amino acids, whereas Arg1, Phe3, Asn5, and Ala6 (red) are important for recognition of the RMF–pMHC complex by 11D06. Residues Pro4, Pro7, and Tyr8 (black) are less critical for binding. (C) Single-substitution plot for RMF peptide in the context of HLA-A*02–β2m heterodimer bound by 11D06 antibody. Each bar corresponds to substitution with 1 of 20 amino acids, and a deletion is shown by the last bar. The height of each bar indicates the signal intensity. Bars are ordered as follows: the 8 nonpolar residues (AFILMVWP; orange); the 7 polar/neutral residues (GSYCQTN; green); the 3 positively charged residues (RKH; blue); and the 2 negatively charged residues (DE; pink). (D) Crystal structures of the 11D06–RMF–pMHC (pdb entry 7BBG) and ESK1–RMF-pMHC (pdb entry 4WUU) complexes. (E) View of the peptide-binding site of pMHC in the Fab 11D06–HLA-A*02 RMF–pMHC complex. Heavy and light chains of Fab 11D06 are colored in blue and cyan, respectively, and the RMF peptide is colored in magenta. The HLA-A*02 pMHCI is shown as a transparent surface in white, with selected side chains highlighted in green. (F) Quantification of endogenous RMF peptide purified from a primary AML patient sample. Mass spectrometry chromatogram overlay of dioxidized endogenous RMF peptide precursor ion [m/z = 570.7790 (2+); red] and dioxidized internal standard 13C6, 15N4-labeled peptide precursor ion [m/z = 575.7831 (2+); blue]. Endogenous RMF peptide was immunoprecipitated by using WT1-TCB. Figure 2A created with BioRender.com.](https://ash.silverchair-cdn.com/ash/content_public/journal/blood/138/25/10.1182_blood.2020010477/8/m_bloodbld2020010477f2.png?Expires=1763475512&Signature=0VvB5KD09SoGjozv9pwyiehrotTc0LzK7Z04UAKO~a5WxaacTxwcbkNYZ~siktFF4bZuEdF2KHQg6APoHOZbUjaNgsA5-4BEZcwq8NxsfL9F0oCnhrYrh87-cttvT9IAiQQFNPfQyQRbX0472hkPgnhrEAp0yhRTQoUpky5fXS1khq1d9~t8~uXFw6X01HYwp9a8RU5HtdCHj0oFz1UTK0ZxYKF95gjFMWF5BycrGY6yptm038tnky4Q~HX3WHIRadD4y4BrvHyXkvl6m3wS3kkyp9mABothvYZbMq-XsDbmhv3106OfTmeB8nNGEP~cYJAYX-IXHcWoXwWucK9B1A__&Key-Pair-Id=APKAIE5G5CRDK6RD3PGA)
Structure of WT1-TCB, mode of action, binding motif, and crystallography. (A) Scheme of WT1-TCB–mediated T-cell engagement. (B) Binding motif as determined by alanine scanning and pMHC array. Anchor residues Met2 and Leu9 (marked in blue) can be replaced by few amino acids, whereas Arg1, Phe3, Asn5, and Ala6 (red) are important for recognition of the RMF–pMHC complex by 11D06. Residues Pro4, Pro7, and Tyr8 (black) are less critical for binding. (C) Single-substitution plot for RMF peptide in the context of HLA-A*02–β2m heterodimer bound by 11D06 antibody. Each bar corresponds to substitution with 1 of 20 amino acids, and a deletion is shown by the last bar. The height of each bar indicates the signal intensity. Bars are ordered as follows: the 8 nonpolar residues (AFILMVWP; orange); the 7 polar/neutral residues (GSYCQTN; green); the 3 positively charged residues (RKH; blue); and the 2 negatively charged residues (DE; pink). (D) Crystal structures of the 11D06–RMF–pMHC (pdb entry 7BBG) and ESK1–RMF-pMHC (pdb entry 4WUU) complexes. (E) View of the peptide-binding site of pMHC in the Fab 11D06–HLA-A*02 RMF–pMHC complex. Heavy and light chains of Fab 11D06 are colored in blue and cyan, respectively, and the RMF peptide is colored in magenta. The HLA-A*02 pMHCI is shown as a transparent surface in white, with selected side chains highlighted in green. (F) Quantification of endogenous RMF peptide purified from a primary AML patient sample. Mass spectrometry chromatogram overlay of dioxidized endogenous RMF peptide precursor ion [m/z = 570.7790 (2+); red] and dioxidized internal standard 13C6, 15N4-labeled peptide precursor ion [m/z = 575.7831 (2+); blue]. Endogenous RMF peptide was immunoprecipitated by using WT1-TCB. Figure 2A created with BioRender.com.
Structure of WT1-TCB, mode of action, binding motif, and crystallography. (A) Scheme of WT1-TCB–mediated T-cell engagement. (B) Binding motif as determined by alanine scanning and pMHC array. Anchor residues Met2 and Leu9 (marked in blue) can be replaced by few amino acids, whereas Arg1, Phe3, Asn5, and Ala6 (red) are important for recognition of the RMF–pMHC complex by 11D06. Residues Pro4, Pro7, and Tyr8 (black) are less critical for binding. (C) Single-substitution plot for RMF peptide in the context of HLA-A*02–β2m heterodimer bound by 11D06 antibody. Each bar corresponds to substitution with 1 of 20 amino acids, and a deletion is shown by the last bar. The height of each bar indicates the signal intensity. Bars are ordered as follows: the 8 nonpolar residues (AFILMVWP; orange); the 7 polar/neutral residues (GSYCQTN; green); the 3 positively charged residues (RKH; blue); and the 2 negatively charged residues (DE; pink). (D) Crystal structures of the 11D06–RMF–pMHC (pdb entry 7BBG) and ESK1–RMF-pMHC (pdb entry 4WUU) complexes. (E) View of the peptide-binding site of pMHC in the Fab 11D06–HLA-A*02 RMF–pMHC complex. Heavy and light chains of Fab 11D06 are colored in blue and cyan, respectively, and the RMF peptide is colored in magenta. The HLA-A*02 pMHCI is shown as a transparent surface in white, with selected side chains highlighted in green. (F) Quantification of endogenous RMF peptide purified from a primary AML patient sample. Mass spectrometry chromatogram overlay of dioxidized endogenous RMF peptide precursor ion [m/z = 570.7790 (2+); red] and dioxidized internal standard 13C6, 15N4-labeled peptide precursor ion [m/z = 575.7831 (2+); blue]. Endogenous RMF peptide was immunoprecipitated by using WT1-TCB. Figure 2A created with BioRender.com.
Alanine scanning revealed the key amino acids required for binding of the RMF peptide (Figure 2B; supplemental Figure 2A-B). These data were confirmed by using a novel peptide–MHC array in which the binding contribution of each amino acid can be investigated by replacement of the remaining amino acids (Figure 2C; supplemental Figure 2C). Both methods showed that apart from the anchor residues Met2 and Leu9, the residues Arg1, Phe3, Asn5, and Ala6 are particularly important for recognition of the RMF–pMHC complex by 11D06, whereas residues Pro4, Pro7, and Tyr8 are less critical for binding.
The X-ray structure of the HLA-A*02/RMF–pMHC complex bound by the 11D06 Fab fragment, resolved at 2.64 Å (pdb code 7BBG), allowed a closer examination of the binding motif compared with the known crystal structure of the ESK1 antibody (Figure 2D-E).34 The structure shows that the Fab 11D06 bound to MHC by contributions of all complementarity-determining regions. The RMF–pMHC–11D06 complex is characterized by a contact surface area of ∼397 Å2 in the center of the pMHC complex, which corresponds to a peptide contribution of ∼107 Å2 (27%); for the ESK1 antibody, the contact surface area is ∼505 Å2 with a peptide contribution of ∼60 Å2 (12%) that is shifted to the N terminus.37 ESK1 binds HLA via Arg1 of the RMF peptide, whereas 11D06 interacts with the central bulge of the peptide, mainly through Asn5. The peptide’s central core is arranged similarly to the natural TCR-HLA assemblies, with the CDR3 loops of both chains arranged around the peptide amino acids 4-6. A similar pattern of binding is observed in the complex formed between the affinity-enhanced WT1_α7β2 TCR and A2-RMF (supplemental Figure 3; supplemental Tables 1-3).50
Targeted quantification of HLA-A*02 presented WT1RMF peptide using immunoprecipitation combined with mass spectrometry
To provide evidence for RMF peptide presentation on MHC, we developed a novel mass spectrometry–based approach (details are given in the supplemental Data). To test the performance of the method, the RMF peptide was pulsed on T2 cells. The exogenously loaded peptide was recovered and detected with a concentration-dependent signal. Furthermore, the existence of the endogenous peptide on SKM-1 cells was confirmed by its detection, albeit at very low levels (supplemental Figure 4). The workflow has been further optimized for primary AML cells, including immunoprecipitation by WT1-TCB and sample upscaling. Thereby, the endogenous RMF peptide was quantified up to 17 fmol, which is equivalent to 152 copies per cell for AML patient no. 1 (Figure 2F). Patient characteristics are provided in supplemental Table 8.
Antibody binding is dependent on WT1 and HLA-A*02 expression and results in T-cell cytotoxicity against tumor cells
We evaluated the WT1-TCB*–mediated T-cell cytotoxicity by coculturing T cells from HDs with different tumor cell lines. Flow cytometry measurements showed that WT1-TCB* elicited antibody-mediated T-cell cytotoxicity in cocultures with RMF peptide–pulsed T2 cells in a WT1-TCB and RMF peptide dose-dependent manner. No lysis was observed in cocultures with unpulsed T2 cells, HLA-A*02− WT1+ HL-60 cells, or Ctrl-TCB (Figure 3A). Killing of HLA-A*02+ tumor cells expressing the RMF peptide from endogenous WT1 protein by WT1-TCB was assessed on a panel of cell lines by counting living target cells or analyzing distinct dead cell protease activity. The most potent killing was observed by using the HLA-A*02:07 cell line SKM-1; other tested HLA-A*02:01 AML cell lines, including OCI-AML3, were killed with lower potency, whereas non-HLA-A*02–expressing cells were not killed (Figure 3B; Table 2).
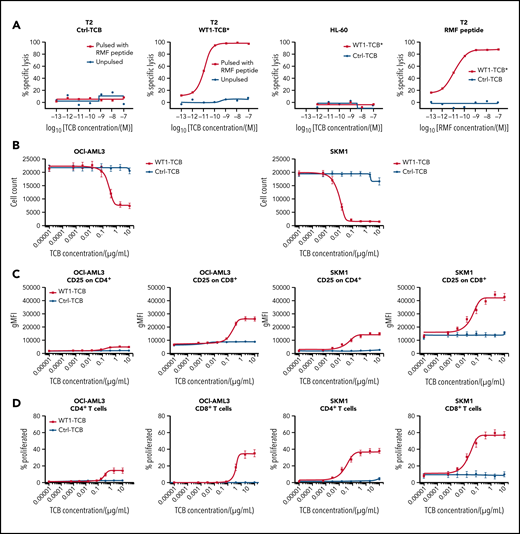
Dose–response relationship after treatment with WT1-TCB in cocultures of tumor cell lines with HD T cells. (A) Transporter associated with antigen processing–deficient HLA-A*02+ T2 cells, unpulsed (black) vs RMF peptide pulsed (red) after treatment with Ctrl-TCB (left) or WT1-TCB* (second from left). Second from right: control with HLA-A02− HL-60 cells and Ctrl-TCB (black) or WT1-TCB* (red). Right: T2 cells pulsed with increasing doses of RMF peptide and treatment with 10−8 M Ctrl-TCB (black) or WT1-TCB* (red). (B) Killing assay performed on AML cell lines (OCI-AML3 and SKM-1) and treated with varying concentrations of WT1-TCB (red) or Ctrl-TCB (black). Tumor cell killing was evaluated after 44 hours (SKM-1) or 68 hours (OCI-AML3); n = 10. CD25 expression (C) and proliferation of CD4+ and CD8+ T cells (D) after 3 days in killing assays using AML cell lines (OCI-AML3 and SKM-1) at varying concentrations of WT1-TCB (red) or Ctrl-TCB (black); n = 6. gMFI, geometric mean fluorescence intensity.
Dose–response relationship after treatment with WT1-TCB in cocultures of tumor cell lines with HD T cells. (A) Transporter associated with antigen processing–deficient HLA-A*02+ T2 cells, unpulsed (black) vs RMF peptide pulsed (red) after treatment with Ctrl-TCB (left) or WT1-TCB* (second from left). Second from right: control with HLA-A02− HL-60 cells and Ctrl-TCB (black) or WT1-TCB* (red). Right: T2 cells pulsed with increasing doses of RMF peptide and treatment with 10−8 M Ctrl-TCB (black) or WT1-TCB* (red). (B) Killing assay performed on AML cell lines (OCI-AML3 and SKM-1) and treated with varying concentrations of WT1-TCB (red) or Ctrl-TCB (black). Tumor cell killing was evaluated after 44 hours (SKM-1) or 68 hours (OCI-AML3); n = 10. CD25 expression (C) and proliferation of CD4+ and CD8+ T cells (D) after 3 days in killing assays using AML cell lines (OCI-AML3 and SKM-1) at varying concentrations of WT1-TCB (red) or Ctrl-TCB (black); n = 6. gMFI, geometric mean fluorescence intensity.
Summary of cell line killing mediated by WT1-TCB
| Cell line | Disease of tissue origin | WT1 mRNA | HLA-A typing based on TRON database | Time of EC50 evaluation (h) | EC50 (nM) T-cell killing in vitro | EC50 (µg/mL) T-cell killing in vitro |
|---|---|---|---|---|---|---|
| SKM-1 | AML | + | 33:03, 02:07 | 44 | 0.16-1.25 | 0.032-0.25 |
| OCI-M1 | AML | + | 03:01, 02:01 | 68 | 0.75-2.15 | 0.15-0.43 |
| OCI-AML3 | AML | + | 23:01, 02:01 | 68 | 0.20-6.75 | 0.04-1.35 |
| Set-2 | AML | + | 33:03, 02:01 | 48 | 0.8-7.6 | 0.16-1.52 |
| COV318 | Ovarian carcinoma | + | 03:01, 02:01 | 48 | 4 | 0.8 |
| Ovcar-3 | Ovarian carcinoma | + | 02:01, 29:02 | 48 | 10.8 | 2.16 |
| T98G | Glioblastoma | + | 02:01, 02:01 | 48 | 0.5 | 0.1 |
| MDA-MB-231 | Breast adenocarcinoma | + | 02:01, 02:17 | 48 | 0.87 | 0.174 |
| BV173 | Blast phase chronic myelogenous leukemia | + | 30:01, 02:01 | 48 | 0.97-13.75 | 0.19-2.75 |
| SW480 | Colorectal adenocarcinoma | + | 02:01, 24:02 | 48 | 0.05-5.4 | 0.01-1.08 |
| SW620 | Colorectal adenocarcinoma | + | 02:01, 24:02 | 48 | 5.8-8.5 | 1.16-1.7 |
| HEC-50B | Endometrial adenocarcinoma | + | 02:07, 02:07 | 48 | 5.95-6.2 | 1.19-1.24 |
| ARH-77 | Plasma cell leukemia | — | 02:01, 03:01 | NA | NA | NA |
| HL-60 | Promyelocytic leukemia | + | 01:01 | NA | NA | NA |
NA; not applicable.
We also assessed the ability of WT1-TCB to activate and expand T cells by measuring upregulation of CD25 and proliferation of dye-labeled cells. Consistent with the results regarding tumor cell killing, T-cell activation and proliferation were strongest in the SKM-1 cell line and lower with OCI-AML3. In addition, T-cell activation and proliferation were consistently higher for CD8+ compared with CD4+ T cells (Figure 3C-D).
Finally, we assessed the killing of other HLA-A*02+ tumor cell lines that either express or do not express WT1 (based on mRNA values). The killing of non-AML cell lines was not as efficacious as the killing of SKM-1 cells, with 50% effective concentration (EC50) values in most cases being >10-fold higher (Table 2).
Induction of downstream TCR signaling in cocultures with primary AML cells
We monitored downstream TCR signaling by coculturing NFAT Luciferase Reporter Jurkat cells with primary AML cells in the presence of WT1-TCB* (10 nM). WT1-TCB* significantly induced downstream TCR signaling in cocultures with HLA-A*02+ primary AML cells but not with cells from HLA-A*02− patients. No signal was observed if the nonspecific Ctrl-TCB was used (Figure 4A). Induction of TCR signaling was dose dependent, with an EC50 of WT1-TCB* of 5.7 nM in HLA-A*02+ AML cells (supplemental Figure 5).
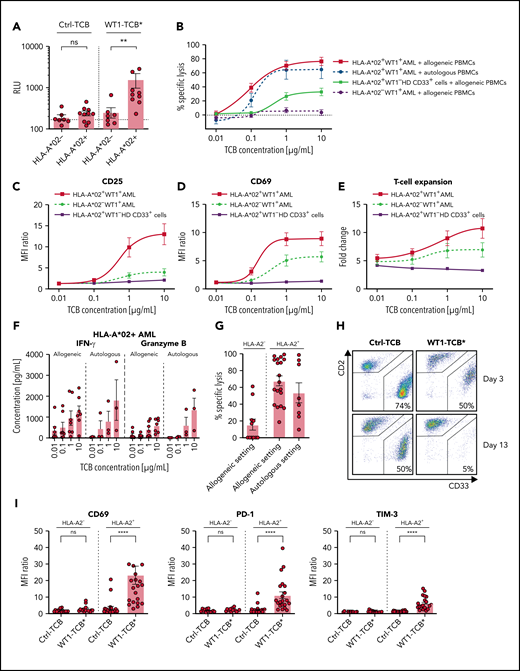
WT1-TCB–mediated T-cell cytotoxicity and T-cell activation. (A) Induction of downstream TCR signaling in NFAT Jurkat Reporter cells upon recognition of RMF peptide–MHC complexes on primary AML cells. Statistical analysis, Mann-Whitney U test (n = 10). (B) Dose-dependent specific lysis of primary HLA-A*02+ AML cells by allogeneic (black solid line; n = 9) or autologous (black dashed line; n = 3) PBMCs after 48 hours in short-term cytotoxicity assays with WT1-TCB. Controls: HLA-A*02+ WT1– CD33+ HD cells (gray solid line; n = 6) and primary HLA-A*02− AML cells (gray dashed line; n = 10). CD25 (C) and CD69 (D) expression on CD3+ T cells after 48 hours in killing assays with allogeneic PBMCs and primary HLA-A*02+ AML cells (black solid line; n = 9), primary HLA-A*02− AML cells (gray dashed line; n = 10), or HLA-A*02+ WT1− CD33+ HD cells (gray solid line; n = 6). (E) T-cell proliferation after 96 hours in killing assays with allogeneic PBMCs and primary HLA-A*02+ AML cells (black solid line; n = 8), primary HLA-A*02− AML cells (gray dashed line; n = 7), or HLA-A*02+ WT1− CD33+ HD cells (gray solid line; n = 3). (F) Secretion of interferon-γ (IFN-γ) and granzyme B in allogeneic and autologous settings after 72 hours in a short-term cytotoxicity assay with primary HLA-A*02 AML cells. (G) Specific lysis of primary AML cells by allogeneic T cells (left: HLA-A*02− AML, n = 11; center: HLA-A*02+ AML, n = 19) or autologous T cells (right: HLA-A*02+ AML, n = 8) after 10 to 13 days in long-term cocultures and treatment with WT1-TCB*. (H) Representative dot plots from flow cytometry analysis showing CD2 and CD33 expression in long-term coculture samples. (I) Upregulation of activation and surrogate exhaustion markers on CD3+ T cells on days 3 to 4 in long-term cocultures with primary HLA-A*02+ and HLA-A*02− AML cells (n = 14-22). Bars represent the mean ± SEM. Statistical analysis: Kruskal-Wallis test and subsequent Dunn’s test. **P < .01, ****P < .0001. MFI, mean fluorescence intensity; n.s., not significant; RLU, relative luminescence units.
WT1-TCB–mediated T-cell cytotoxicity and T-cell activation. (A) Induction of downstream TCR signaling in NFAT Jurkat Reporter cells upon recognition of RMF peptide–MHC complexes on primary AML cells. Statistical analysis, Mann-Whitney U test (n = 10). (B) Dose-dependent specific lysis of primary HLA-A*02+ AML cells by allogeneic (black solid line; n = 9) or autologous (black dashed line; n = 3) PBMCs after 48 hours in short-term cytotoxicity assays with WT1-TCB. Controls: HLA-A*02+ WT1– CD33+ HD cells (gray solid line; n = 6) and primary HLA-A*02− AML cells (gray dashed line; n = 10). CD25 (C) and CD69 (D) expression on CD3+ T cells after 48 hours in killing assays with allogeneic PBMCs and primary HLA-A*02+ AML cells (black solid line; n = 9), primary HLA-A*02− AML cells (gray dashed line; n = 10), or HLA-A*02+ WT1− CD33+ HD cells (gray solid line; n = 6). (E) T-cell proliferation after 96 hours in killing assays with allogeneic PBMCs and primary HLA-A*02+ AML cells (black solid line; n = 8), primary HLA-A*02− AML cells (gray dashed line; n = 7), or HLA-A*02+ WT1− CD33+ HD cells (gray solid line; n = 3). (F) Secretion of interferon-γ (IFN-γ) and granzyme B in allogeneic and autologous settings after 72 hours in a short-term cytotoxicity assay with primary HLA-A*02 AML cells. (G) Specific lysis of primary AML cells by allogeneic T cells (left: HLA-A*02− AML, n = 11; center: HLA-A*02+ AML, n = 19) or autologous T cells (right: HLA-A*02+ AML, n = 8) after 10 to 13 days in long-term cocultures and treatment with WT1-TCB*. (H) Representative dot plots from flow cytometry analysis showing CD2 and CD33 expression in long-term coculture samples. (I) Upregulation of activation and surrogate exhaustion markers on CD3+ T cells on days 3 to 4 in long-term cocultures with primary HLA-A*02+ and HLA-A*02− AML cells (n = 14-22). Bars represent the mean ± SEM. Statistical analysis: Kruskal-Wallis test and subsequent Dunn’s test. **P < .01, ****P < .0001. MFI, mean fluorescence intensity; n.s., not significant; RLU, relative luminescence units.
Lysis of primary AML cells is dose dependent
We assessed WT1-TCB–mediated cytotoxicity against primary AML cells by autologous or HD PBMCs in conjunction with various concentrations of WT1-TCB. WT1-TCB mediated the killing of HLA-A*02+ AML cells in the allogeneic and autologous settings (mean ± SEM specific lysis after 48 hours with 10 µg/mL TCB, 76.6 ± 5.9% and 64.7 ± 12.4%; n = 9 and 3, respectively). Lysis of AML cells was dose dependent, with an EC50 value of ∼0.1 µg/mL (0.5 nM) for both settings. Conversely, no lysis of HLA-A*02− AML cells was observed, and only low levels of lysis in HD-derived HLA-A*02+ WT1− myeloid cells were recorded (Figure 4B). Correspondingly, using HLA-A*02+ AML cells, we observed dose-dependent T-cell activation, expansion, interferon-γ secretion, and granzyme B secretion (Figure 4C-F).
T-cell cytotoxicity against primary AML cells ex vivo
To further support the potency of WT1-TCB* against primary AML cells, we cocultured primary AML cells with HD or autologous T cells in a feeder layer–based long-term culture system. This action enabled us to assess the specific lysis of AML cells over a therapeutically relevant time frame. WT1-TCB* induced specific cytotoxicity of primary HLA-A*02+ AML cells upon addition of allogeneic T cells from HDs (mean ± SEM specific lysis, 67 ± 6% after 13-14 days; n = 19). WT1-TCB* also mediated the killing of primary AML cells in an autologous setting (mean ± SEM specific lysis, 54 ± 12% after 11-14 days; n = 8). HLA-A*02− AML cells were not significantly killed (Figure 4G-H). Corresponding upregulation of T-cell activation and checkpoint molecules was only observed with HLA-A*02+ AML cells (mean ± SEM fluorescence intensity fold change: CD69, 9.3 ± 1.5; PD-1, 5.1 ± 0.7; TIM-3, 4.7 ± 0.6; n = 22) (Figure 4I).
Lysis of healthy, bone marrow–derived CD34+ cells is low
To evaluate on-target off-leukemia WT1-TCB–mediated cytotoxicity against healthy HLA-A*02+ bone marrow cells, we prepared cocultures with autologous T cells and varying concentrations of WT1-TCB. Specific lysis of CD34+ cells was observed in a dose-dependent manner at 48 hours, and the EC50 value was 0.15 µg/mL. The effect was minimal at 0.1 µg/mL (mean ± SEM specific lysis, 8.3 ± 3.3%; n = 8) (supplemental Figure 6A) and increased to 34.2 ± 9.0% at 1 µg/mL. Expression of the activation marker CD69 was low after 24 hours in the presence of WT1-TCB at concentrations equal to the EC50 value or lower (mean ± SEM fluorescence intensity ratio, 62.4 ± 39.0; n = 8; 0.1 µg/mL TCB). Pulsing with the RMF peptide exacerbated the lysis of CD34+ cells at all concentrations and increased T-cell activation (supplemental Figure 6B). To further validate the absence of negative effects on healthy hematopoiesis, we performed colony-forming unit assays with HD bone marrow cells. No difference in colony formation was observed for samples treated for 48 hours with either 0.1 or 2 µg/mL WT1-TCB compared with Ctrl-TCB (n = 3 and 1, respectively) (supplemental Figure 6C).
The cytotoxicity against AML cells is higher compared with a WT1RMF-specific T-cell clone
We compared the cytotoxicity of T cells mediated by WT1-TCB* vs that of a WT1RMF-specific T-cell clone isolated from HDs by streptamer technology.51 A WT1RMF-specific T-cell clone was cocultured with primary AML cells for 3 days in a feeder layer–based long-term culture system with or without WT1-TCB*. To determine the extent of nonspecific background lysis, we prepared additional control samples with HD T cells or an unrelated T-cell clone without addition of WT1-TCB*. Specific lysis was calculated relative to these controls.
No specific lysis of HLA-A*02− primary AML cells by WT1RMF-specific T-cell clone was observed. Surprisingly, specific lysis against HLA-A*02+ primary AML cells was only observed after we loaded target cells with RMF peptide (mean ± SEM specific lysis, −3 ± 4% [unpulsed]; 58 ± 11% (pulsed); n = 9) (Figure 5A). Conversely, addition of WT1-TCB* induced specific lysis of HLA-A*02+ primary AML cells also without RMF peptide loading (mean ± SEM specific lysis, 67 ± 11% [unpulsed], 88 ± 5% [pulsed]; n = 9) (Figure 5B]. Similar results were obtained by using an unrelated T-cell clone as a reference instead of HD T cells (mean ± SEM specific lysis, 71 ± 13% [unpulsed]; 88 ± 3% [pulsed]; n = 6) (Figure 5C-D).
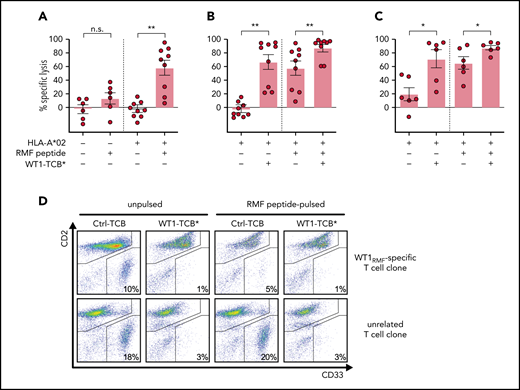
WT1-TCB* vs WT1-specific T cells. (A) Specific lysis of unpulsed and RMF peptide–pulsed primary AML cells from HLA-A*02− and HLA-A*02+ patients by WT1RMF-specific T-cell clone after 3 days in feeder layer–based long-term cocultures. Specific lysis was calculated by subtraction of unspecific lysis by HD T cells under the same conditions (n = 6-9). (B) Specific lysis of primary AML cells after 3 days in feeder layer–based long-term cocultures with WT1RMF-specific T-cell clone and treatment with WT1-TCB* compared with HD T cells (n = 9). (C) Specific lysis of primary AML cells (all NPM1 wild-type) after 3 days in feeder layer–based long-term cocultures with WT1RMF-specific T-cell clone and treatment with WT1-TCB*. Specific lysis was calculated by subtraction of unspecific lysis by a T-cell clone targeting an unrelated epitope of mutated NPM1 (n = 6 ). (D) Representative dot plots from flow cytometry analysis showing CD2 and CD33 expression in lysis experiments. Bars represent mean ± SEM. Statistical analysis: Mann-Whitney U test. *P < .05, **P < .01. n.s, not significant.
WT1-TCB* vs WT1-specific T cells. (A) Specific lysis of unpulsed and RMF peptide–pulsed primary AML cells from HLA-A*02− and HLA-A*02+ patients by WT1RMF-specific T-cell clone after 3 days in feeder layer–based long-term cocultures. Specific lysis was calculated by subtraction of unspecific lysis by HD T cells under the same conditions (n = 6-9). (B) Specific lysis of primary AML cells after 3 days in feeder layer–based long-term cocultures with WT1RMF-specific T-cell clone and treatment with WT1-TCB* compared with HD T cells (n = 9). (C) Specific lysis of primary AML cells (all NPM1 wild-type) after 3 days in feeder layer–based long-term cocultures with WT1RMF-specific T-cell clone and treatment with WT1-TCB*. Specific lysis was calculated by subtraction of unspecific lysis by a T-cell clone targeting an unrelated epitope of mutated NPM1 (n = 6 ). (D) Representative dot plots from flow cytometry analysis showing CD2 and CD33 expression in lysis experiments. Bars represent mean ± SEM. Statistical analysis: Mann-Whitney U test. *P < .05, **P < .01. n.s, not significant.
Lenalidomide enhances cytotoxicity against primary AML cells
The addition of lenalidomide (AbMole BioScience, Brussels, Belgium) enhanced WT1-TCB*–mediated T-cell cytotoxicity in cocultures of primary AML cells and HD T cells (mean ± SEM specific lysis on days 3-4, 45.4 ± 9.0% vs 70.8 ± 8.3%; P = .015; n = 9-10) (Figure 6A). Similarly, addition of lenalidomide with WT1-TCB* increased the secretion of pro-inflammatory cytokines and reduced levels of IL-10 (Figure 6B). Furthermore, combination with lenalidomide promoted the differentiation of naive T cells toward a memory phenotype characterized by downregulation of CD45RA (Figure 6C-D).
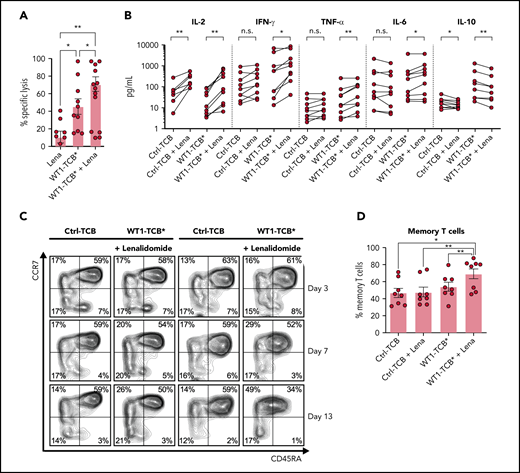
WT1-TCB*–mediated cytotoxicity in combination with lenalidomide (Lena). (A) WT1-TCB–mediated specific lysis of primary AML cells significantly increased in combination with Lena after 4 days of coculture with HD T cells (n = 9-10). Lena was added at a concentration of 10 μM together with 10 nM WT1-TCB* in ex vivo cytotoxicity assays with primary AML cells and HD T cells at an E:T ratio of 1:2 for 4 days. (B) Levels of proinflammatory cytokines increase after combination of WT1-TCB* with Lena and levels of the anti-inflammatory interleukin 10 (IL-10) decrease (n = 9). (C) Representative example of CD45RA and CCR7 expression analysis. (D) Percentages of central memory T cells after 7 to 10 days of treatment (n = 8). Bars represent the mean ± SEM. Statistical analysis: Wilcoxon matched-pairs signed-rank test. *P < .05, **P < .01. n.s., not significant; TNF-α, tumor necrosis factor α.
WT1-TCB*–mediated cytotoxicity in combination with lenalidomide (Lena). (A) WT1-TCB–mediated specific lysis of primary AML cells significantly increased in combination with Lena after 4 days of coculture with HD T cells (n = 9-10). Lena was added at a concentration of 10 μM together with 10 nM WT1-TCB* in ex vivo cytotoxicity assays with primary AML cells and HD T cells at an E:T ratio of 1:2 for 4 days. (B) Levels of proinflammatory cytokines increase after combination of WT1-TCB* with Lena and levels of the anti-inflammatory interleukin 10 (IL-10) decrease (n = 9). (C) Representative example of CD45RA and CCR7 expression analysis. (D) Percentages of central memory T cells after 7 to 10 days of treatment (n = 8). Bars represent the mean ± SEM. Statistical analysis: Wilcoxon matched-pairs signed-rank test. *P < .05, **P < .01. n.s., not significant; TNF-α, tumor necrosis factor α.
Tumor growth inhibition in in vivo mouse models
We assessed the pharmacokinetic parameters of WT1-TCB in a human FcRn transgenic mouse model and observed a mean terminal elimination half-life of 10.7 days (supplemental Figure 7). Next, we evaluated the antitumor activity of WT1-TCB in a SKM-1 xenograft model in NSG mice engrafted with human stem cells (hSC-NSG). We tested doses of 0.05, 0.1, and 1 mg/kg WT1-TCB* administered once weekly and observed a dose-dependent efficacy (Figure 7A-B).

Antitumor efficacy of WT1-TCB in humanized mouse models. (A-B) Tumor growth curves of the SKM-1 model in hSC-NSG mice treated once weekly with vehicle control or 0.05, 0.1, or 1 mg/kg of WT1-TCB. (C) Cytometric analysis of the CD34+CD133+ stem cell population in the bone marrow of SKM-1 tumor-bearing hSC-NSG mice engrafted with cord blood from HLA-A*02+ donors after 54 days of treatment with WT1-TCB*. (D-E) Tumor growth in AML PDX mice (AML573) treated once weekly with 3 mg/kg WT1-TCB or Ctrl-TCB beginning on day 30, assessed by in vivo imaging. One WT1-TCB–treated mouse died during imaging on day 32.
Antitumor efficacy of WT1-TCB in humanized mouse models. (A-B) Tumor growth curves of the SKM-1 model in hSC-NSG mice treated once weekly with vehicle control or 0.05, 0.1, or 1 mg/kg of WT1-TCB. (C) Cytometric analysis of the CD34+CD133+ stem cell population in the bone marrow of SKM-1 tumor-bearing hSC-NSG mice engrafted with cord blood from HLA-A*02+ donors after 54 days of treatment with WT1-TCB*. (D-E) Tumor growth in AML PDX mice (AML573) treated once weekly with 3 mg/kg WT1-TCB or Ctrl-TCB beginning on day 30, assessed by in vivo imaging. One WT1-TCB–treated mouse died during imaging on day 32.
Notably, WT1-TCB* treatment did not result in adverse effects on CD34+ hSCs when tested in hSC-NSG mice engrafted with HLA-A*02+ stem cells (Figure 7C). Although WT1-TCB* mediated potent antitumor efficacy at concentrations of 1 and 10 mg/kg, it did not induce signs of weight loss or depletion of CD34+ stem cells in the bone marrow of hSC-NSG mice at day 57. This supports the in vivo specificity of WT1-TCB* (based on the 11D06 binder) in a system expressing HLA-A*02 on hSCs and in the derived cell lineages in blood, bone marrow, and lymphoid tissues.
In addition, antitumor activity of WT1-TCB was seen in an AML PDX model. We observed a reduction of the tumor burden after weekly administration of WT1-TCB compared with Ctrl-TCB, as assessed by in vivo imaging (Figure 7D-E). In a second experiment using a different PDX model, WT1-TCB–treated mice had a reduced number of human CD45+CD33+ cells in spleen and bone marrow compared with Ctrl-TCB–treated mice after 10 days of treatment (supplemental Figure 8).
Discussion
The current study evaluated a novel 2 + 1 TCB antibody construct that targets an epitope of the intracellular antigen WT1 in the context of HLA-A*02. WT1 is overexpressed in a number of tumor entities, including AML, and is thus a universal target antigen in immunotherapeutic strategies. It has been extensively described as a leukemia-associated antigen with a disease-restricted expression profile.22,23 Analysis of WT1 expression in bone marrow sampled from patients with AML during the course of the disease revealed a strong correlation between the percentage of leukemic blasts in the bone marrow and the number of copies of WT1 mRNA. Accordingly, WT1 has been used as a prognostic marker for assessing minimal residual disease.49,52-55 The recurrence of WT1 expression at time of relapse supports the hypothesis that WT1 plays a pathophysiological role in leukemic cell survival. Several in vitro studies have shown the modulation of leukemic cell growth by upregulation and downregulation of WT1; however, the precise role of WT1 in leukemia remains elusive.56-58
WT1-TCB was designed to specifically recognize the WT1-derived RMF peptide in the context of HLA-A*02. Alanine scanning and a novel peptide MHC array method showed that 6 of the 9 residues of the RMF peptide are important for binding WT1-TCB. A TCR-mimicking antibody targeting the same epitope, named ESK1, has been reported.34,35,59,60 However, this antibody has not entered clinical development, most likely owing to off-target binding, as epitope binding of ESK1 relies almost exclusively on peptide residue Arg1, allowing recognition of several other self peptides.37 X-ray crystallography of the RMF–pMHC complex bound to the WT1-TCB Fab fragment further revealed a considerably higher contribution of the RMF peptide to the overall contact surface area compared with ESK1.37,50
The confirmation that the RMF peptide is presented as part of a pMHC complex relies on cellular data, but so far the RMF peptide could not be extracted from cancer cells.61,62 By developing a novel mass spectrometry–based approach, we provide qualitative evidence for endogenous RMF peptide presentation using SKM-1 cells. Further optimization, including immunoprecipitation by WT1-TCB, allowed the first quantification of endogenous RMF peptide presentation on an AML patient sample. This provides evidence that HLA-A*02/RMF-pMHC complexes are presented on primary AML cells at a reasonable density and also shows the selectivity of WT1-TCB toward this complex.
In short-term cytotoxicity experiments, we observed the dose-dependent WT1-TCB–mediated lysis of primary AML cells, underlining that endogenous RMF peptide is presented. Using our pre-established ex vivo long-term culture system for AML cells,47 we observed WT1-TCB–mediated cytotoxicity against primary AML cells by allogeneic and autologous T cells over a therapeutically relevant time frame. Interestingly, cytotoxicity was higher in the allogeneic setting, which supports previous findings on T-cell dysfunction in AML.63,64 Importantly, our in vitro findings were supported by our in vivo demonstration of tumor growth inhibition by WT1-TCB using different AML PDX models and a SKM-1-xenograft model. In the latter model, some animals exhibited tumor progression after initial tumor control. In an RNA-sequencing analysis of the possible escape mechanisms, we did not observe downregulation of WT1, in contrast to HLA-A*02; however, this was not the case in all samples.
Because low frequency of WT1 RNA–expressing hSCs has been reported,21 we evaluated WT1-TCB–mediated on-target, off-leukemia cytotoxicity against HD CD34+ bone marrow cells. We observed only low WT1-TCB–mediated target cell lysis and T-cell activation and did not observe killing of CD34+ hSCs in the humanized NSG mouse model. This indicates that the RMF peptide is not presented on the surface of HLA-A*02+ healthy CD34+ cells to an extent that WT1-TCB initiates T-cell activation. This observation is consistent with results from a clinical trial with WT1RMF-TCR transgenic T cells that reported no corresponding adverse events.29
Target antigen recognition by WT1-TCB mimics the physiological MHC–TCR interaction but differs by bivalent vs monovalent binding. WT1-TCB mediated the lysis of unpulsed and RMF peptide–pulsed primary AML cells, whereas a WT1RMF-specific T-cell clone mediated the killing of only peptide-pulsed target cells. One explanation for these findings is that the 2 + 1 molecular format confers higher avidity (double-digit nanomolar affinity for the pMHC complex as opposed to the micromolar affinity that is typical for TCRs), thus enabling target cell lysis even if only low numbers of pMHC complexes are presented. The TCR affinities for nonmutated self peptides such as WT1 have been shown to be lower than those for foreign antigens, which also impedes the generation of high-affinity TCR transgenic T cells for adoptive transfer. Nevertheless, the adoptive transfer of WT1-specific T cells or TCR transgenic T cells has exhibited antileukemic activity in clinical trials.27,29 Recently, WT1RMF-TCR transgenic T cells were reported to prevent AML relapse in a small cohort of patients after hematopoietic cell transplantation, providing proof-of-concept for targeting WT1.29
To further augment cytotoxicity, we evaluated the combination of WT1-TCB with lenalidomide, a drug that has been shown to have a stimulatory effect on T cells.65,66 We observed a significant increase of specific cytotoxicity and levels of pro-inflammatory cytokines, as well as a shift in the T-cell compartment toward the memory phenotype. The latter is likely a secondary effect due to increased secretion of interl-2, resulting in increased T-cell proliferation and activation. Our observations are consistent with results from other trials of lenalidomide combinations, underlining the rationale behind this combinatorial approach.67-69
In summary, we showed that WT1-TCB facilitates potent in vitro, ex vivo, and in vivo killing of AML cell lines and primary AML cells. These properties led to the initiation of an entry-into-human clinical trial (#NCT04580121) for the treatment of relapsed/refractory AML.
Acknowledgments
The authors thank Sabine Sandner-Thiede, Marina Leeping, Elke Habben, Ewelina Zientara, Sabine Reinkunz, and Anne-Sophie Neumann (University Hospital, LMU Munich) for their excellent technical support. They thank Christoph Lampert and Victor Levitsky (both previously with Roche) for the initial experiments on precursors of WT1-TCB. Thanks also go to Elfriede Nößner and Andreas Moosmann for their expert advice. The authors also acknowledge the iFlow Core Facility of the University Hospital, LMU Munich (INST 409/225-1 FUGG) for assistance with the generation of flow cytometry data.
The work was supported by a German Research Council (DFG) grant provided within the Sonderforschungsbereich SFB 1243 (K.S.; I.J.) and research grant SU197/3-1 (application number 451580403, M. Subklewe), the Bavarian Elite Graduate School “i-target” (M.R.), the Wilhelm-Sander Stiftung (project number 2018.087.1, G.H.) and the European Research Council (Consolidator Grant 681524 [I.J.]). L.V. acknowledges support by the Italian Ministry of Health (RF-2011-02348034 and TRANSCAN HLALOSS), by the Associazione Italiana per la Ricerca sul Cancro (Start-Up Grant 14162), and by the DKMS Mechtild Harf Foundation (DKMS Mechtild Harf Research Grant 2015). This study was supported, in part, by research funding from Roche to M.S.
Authorship
Contribution: C. Klein, W.X., P.U., and M. Subklewe designed the study and supervised the project; C.A., C. Klein, V.P., G.H., M. Subklewe, M.v.B.-B., and F.S.L. wrote the manuscript; C.A., G.H., V.P., L.J.H., A.A., J.C., K.H., P.E.R., A.S., J.S., E.L., A.D., D.O.-F., J.B., A.B., C.G., A.C., V.L., and J.P. performed the experiments and analyzed and/or interpreted the data; M. Subklewe, W.X., C. Krupka, M.R., F.S.L., L.V., B.V., I.J., E.M.-B., and A.-C.W. were involved in research design and data interpretation; N.K. and K.S. performed the real-time qPCR analyses; A.T. and M. Schmitz generated and provided the WT1-specific T-cell clones; and A.B. and J.B. determined and analyzed the crystal structure.
Conflict-of-interest disclosure: C. Klein, L.J.H., J.S., V.P., A.S., J.C., and P.U. are, and W.X. was, employed at the Roche Innovation Center Zurich. F.S.L., A.C., A.B., and C.G. are, and C. Krupka was, employed at the Roche Innovation Center Munich, and E.M.-B., A.-C.W., A.D., J.B. A.A., E.L., and D.O.-F. are employed at the Roche Innovation Center Basel. V.L. and J.P. were employed at Roche NimbleGen. These authors also declare patents and ownership of Roche stock. M. Subklewe has received industry research support from Amgen, Gilead, Miltenyi Biotec, MorphoSys, Roche, and Seattle Genetics; has served as a consultant/advisor to Amgen, BMS, Celgene, Gilead, Pfizer, Novartis, and Roche; sits on the advisory boards of Amgen, Celgene, Gilead, Janssen, Novartis, Pfizer, and Seattle Genetics; and serves on the speakers bureau at Amgen, Celgene, Gilead, Janssen, and Pfizer. The remaining authors declare no competing financial interests.
Correspondence: Christian Klein, Roche Pharma Research & Early Development, Roche Innovation Center Zurich, Schlieren, Switzerland; e-mail: christian.klein.ck1@roche.com; or Marion Subklewe, Department of Medicine III, University Hospital, LMU Munich, Munich, Germany; e-mail: marion.subklewe@med.uni-muenchen.de.
The online version of this article contains a data supplement.
There is a Blood Commentary on this article in this issue.
The publication costs of this article were defrayed in part by page charge payment. Therefore, and solely to indicate this fact, this article is hereby marked “advertisement” in accordance with 18 USC section 1734.

This feature is available to Subscribers Only
Sign In or Create an Account Close Modal