

Key Points
In the human blood system, HLF expression is specific to stem cell populations in primary anatomical sites and during ex vivo expansion.
CRISPR/rAAV6-mediated integration of a genomic HLF reporter allows selective and stable genetic labeling of human HSCs ex vivo and in vivo.

Abstract
Hematopoietic stem cells (HSCs) sustain blood cell homeostasis throughout life and can regenerate all blood lineages after transplantation. Despite this clear functional definition, highly enriched isolation of human HSCs can currently only be achieved through combinatorial assessment of multiple surface antigens. Although several transgenic HSC reporter mouse strains have been described, no analogous approach to prospectively isolate human HSCs has been reported. To identify genes with the most selective expression in human HSCs, we profiled population and single-cell transcriptomes of unexpanded and ex vivo cultured cord blood–derived hematopoietic stem and progenitor cells as well as peripheral blood, adult bone marrow, and fetal liver. On the basis of these analyses, we propose the master transcription factor HLF (hepatic leukemia factor) as one of the most specific HSC marker genes. To directly track its expression in human hematopoietic cells, we developed a genomic HLF reporter strategy, capable of selectively labeling the most immature blood cells on the basis of a single engineered parameter. Most importantly, HLF-expressing cells comprise all stem cell activity in culture and in vivo during serial transplantation. Taken together, these results experimentally establish HLF as a defining gene of the human HSC state and outline a new approach to continuously mark these cells with high fidelity.
Introduction
The existence of rare, serially transplantable, and multipotent hematopoietic stem cells (HSCs) was first demonstrated >60 years ago in mice.1-3 Since then, HSCs have been studied extensively, not only because of their unique biology but also because of their paramount regenerative potential that is now widely exploited in the clinic.4
Despite their high clinical relevance, the molecular identity of human HSCs remains poorly defined, and their purification invariably requires profiling of complex stem cell–associated surface marker combinations.5 Because many of these surface markers are mediators of cellular homing or signaling, their expression is often regulated in response to changing physiological conditions, significantly affecting utility during certain experimental procedures, most notably ex vivo culture.6,7
In mice, several HSC-enriched genes encoding intracellular proteins have been identified and, using transgenic reporter strains, been demonstrated to label repopulating cells with high accuracy.8-14 Collectively, these studies suggest that some intracellular proteins, particularly transcriptional and chromatin regulators, are more specifically expressed than most, if not all, currently used surface HSC markers.
With recent advancements in targeted gene editing using CRISPR and recombinant adeno-associated viruses (rAAVs)15 and in functional expansion of human HSCs in culture,16-20 the use of genetic reporter alleles in these cells has become conceivable. Moreover, improved characterization of developmental gene expression networks using single-cell transcriptomics has set the stage for population marker gene identification with unmatched resolution. Through combination of these key advancements, we set out to identify the most selectively expressed candidate genes in human HSCs and engineer a genomic reporter allowing prospective identification of bona fide human HSCs in culture and in vivo.
Methods
Analyses of bulk transcriptomes
Endothelial protein C receptor (EPCR)– and integrin α3 (ITGA3)-specific data sets were previously reported. In brief, differentially expressed genes from the ITGA3 data set were determined exactly as in the study by Tomellini et al,21 using the Kallisto/Sleuth pipeline and the full GRCh38 v92 annotation (including noncoding genes). The EPCR data set7 was reanalyzed for consistency. Expression-weighted fold change (β value) and P value (sleuth) cutoff values were designated based on ITGA3 (β ± 0.844; P = .0071) and EPCR (β ± 1.412; P = 3.32e−7) in the respective data sets. The intersection of positive and negative differentially expressed genes yielded 17 and 9 genes, respectively.
Analyses of single-cell transcriptomes from nonexpanded and UM171-expanded CB
CD34+ cord blood (CB) cells, either nonexpanded thawed or culture-expanded with UM171 (35 nM) were single-cell sequenced on a Chromium Single-Cell Controller (10X Genomics) using the Single Cell 3' Reagent Kit (version 2) according to the manufacturer’s instructions. Target cell numbers were 6000 per condition. Single-cell RNA sequencing libraries were sequenced on an Illumina NovaSeq device using an S2 (paired ends, 28 × 91) setup or on an Illumina HiSEQ 4000 using 26 × 98 cycles. A standard Cellranger (version 3.0.1) pipeline was used for read mapping (GRCh38 annotation) and cell demultiplexing. Subsequent analyses were performed in Seurat (version 3) based on Cellranger prefiltered barcode/feature matrices and included (1) exclusion of cells with fewer genes or unique molecular identifiers than the respective medians minus 2 standard deviations, (2) exclusion of cells with more genes or unique molecular identifiers than the respective medians plus 2 standard deviations (multiplets), and (3) exclusion of cells with >7% mitochondrial gene expression (apoptotic cells). Expression counts were normalized using the SCTransform wrapper in Seurat including regression on cell-cycle scores and mitochondrial gene content. Seurat integration was performed using the top 241 integration anchors (250 minus sex-specific genes) in the first 30 dimensions, followed by principal component analysis dimensional reduction, FindNeighbors, and FindClusters (resolution, 0.5) in the first 15 integrated dimensions. Cluster markers were identified using the Seurat FindAllMarkers function. SPRING embedding was calculated on the integrated expression matrix using the SPRING Web tool (https://kleintools.hms.harvard.edu/tools/spring.html). For visualization, data imputation was calculated on SCT-transformed data of all genes using the MAGIC wrapper (t = 1) in Seurat.
Nucleofection and transduction of CD34+ cells
Nucleofection of cultured CD34+ cells was carried out with 3 μg of Cas9 and 8 μg of single-guide RNA (sgRNA) and 10e6 cells per 100 μL, using the Amaxa 4D-Nucleofector Core and X units (program DZ100 or CA137 unless indicated otherwise). Four to 5 days before nucleofection, CD34+ cells were thawed and plated at 1.5 × 10e5 cells per mL in hematopoietic stem and progenitor cell (HSPC) expansion media containing UM171 (35 nM). At day 3, cells had typically expanded two- to threefold and were stained with anti–CD34-BV421 (1:50, catalog no. 562577; BD Biosciences) and anti–CD201-allophycocyarin (APC) (1:100, catalog no. 351906; Biolegend) and sorted based on CD201 expression. The sorted cells were plated back in culture at 1.5 × 10e5 cells per mL. Twenty-four to 48 hours later, cells were harvested, washed in phosphate-buffered saline, and taken up in 1-M or P3 nucleofection buffer (Amaxa) containing 11 μg the preassembled Cas9 sgRNA ribonucleoprotein (RNP) complex and, where indicated, 20 pmol of small interfering RNA (siRNA) against TP53 (siRNA ID s605, catalog no. 4390825; Thermo Fisher Scientific). After nucleofection, the cells were immediately plated at 2 to 4 × 10e5 cells per mL in HSPC media containing reporter-encoding rAAV6. Half-media changes were performed on the following 2 days, analysis was performed as indicated, and transplantation took place on day 3 postnucleofection.
Additional methods
All additional methods are provided in the supplemental Data, available on the Blood Web site.
Results
HLF is a candidate marker gene for human HSC populations
We previously identified surface markers such as EPCR (CD201) and ITGA3 (CD49c) that best define long-term repopulating cells in optimized ex vivo CD34+ CB stem cell expansion conditions.7,21
Integrated transcriptome analysis of these enriched (CD34+/CD201+ and CD34+/CD45RAlow/CD201+/CD90+/CD133+/ITGA3+) vs depleted long-term HSC (LT-HSC) populations yielded a set of genes (n = 17) with strongly LT-HSC–associated expression (supplemental Figure 1). On the basis of expression dynamics between LT-HSCs and differentiated cells, HLF (hepatic leukemia factor) ranked highest in this list and was therefore prioritized as an HSC marker candidate (Figure 1A). Indeed, HLF was found not expressed in mature peripheral blood cells22 (Figure 1B), and single-cell transcriptomes of unexpanded and ex vivo cultured CD34+ CB cells (supplemental Figure 2) confirmed its expression in the HSPC cluster (Figure 1C pink cluster; Figure 1D-E). Moreover, within this cluster, HLF expression continuously decreased as cells progressed toward lineage commitment, a pattern that aligns with the latest models of gradual rather than stepwise HSC differentiation.23,24
![Specific HLF expression in enriched human HSC populations. (A) HLF expression is enriched in cultured human HSC subsets. Differentially expressed genes from CD201+ vs CD201mid/−7 and ITGA3+/CD201+/CD90+/CD133+/C34+/CD45RA− (ITGA3+/CD201+) vs ITGA3−/CD201+/CD90+/CD133+/C34+/CD45RA−21 (ITGA3−/CD201+) after 7-day culture with UM171. Both transcriptomic surveys were integrated to identify consistently up- or downregulated genes. Ranking based on fold change between the most enriched (ITGA3+/CD201+) and most depleted (CD201−) HSC populations is summarized by a waterfall plot (left; log2 transformed). Range of expression is provided for each gene in square brackets. Each population includes biological replicates represented along the x-axis. ITGA3−/CD201+ is abbreviated for the ITGA3−/CD201+/CD90+/CD133+/C34+/CD45RA− population. (B) HLF expression is undetectable in mature blood leukocyte populations. A curated data set from Uhlen et al22 including between 4 and 6 biological replicates per population. (C) Single-cell transcriptomic overview of CB cell populations. CD34+ CB cells that were either thawed and noncultured (day 0) or UM171-expanded (day 7; 2 biological replicates for each condition; 15 921 total cells; fluorescence-activated cell sorting profiles are provided in supplemental Figure 2 green bars) were single-cell RNA sequenced (10X Chromium), integrated, and clustered using Seurat 3.50 Eleven cell clusters were identified in the integrated data set: HSPCs, lymphoid-primed multipotent progenitors (LMPPs), multipotent progenitors (MPPs), granulomonocytic progenitors (GMPs), megakaryocyte erythroid mast cell progenitors (MEMPs), megakaryocytes (mega), eosinophil/basophils (eo/ba), mast cells (mast), erythroid lineage cells (erythroid), neutrophils (neutro), and monocytic/dendritic cells (mono/DCs). Dimensional reduction was calculated using SPRING.51 Combined representation of integrated data. Marker genes for each cluster are provided in supplemental Table 1. (D-E) HSPC-specific HLF expression in thawed noncultured CD34+ cells and after 7-day ex vivo expansion in the presence of UM171. HLF expression is shown in single-cell transcriptomes that are represented separately by treatment. Normalized expression data (z score computed separately by treatment after MAGIC imputation52) is expressed in the color scale. (F) Comparison of HLF expression specificity vs selected HSC-associated genes and common HSC surface marker genes. Gene-wise z score distribution by treatment (fresh CD34+ and UM171 day 7) is represented as density for each cell community (same color code as in panel C). The mean z score for HLF in the HSPC cluster is provided as a dotted reference line for each treatment. (G-I) HLF expression is strongly enriched in HSC clusters in human bone marrow (BM). (G) Overview of cell clusters (Human Cell Atlas; 101 935 cells; integrated data from 8 donors; uniform manifold approximation and projection [UMAP] reduction; preprocessed data, clusters, and labels adopted from Hay et al32). (H) HLF expression (z score normalized after MAGIC imputation). (I) Expression summary of selected HSC-associated genes in human BM (scaled expression averaged for each hematopoietic cell population and donor (n = 8) in the data set; row-normalized color scale). Nonhematopoietic cell populations were excluded from this representation. (J-L) HLF expression is restricted to the HSC/MPP cluster in hematopoietic human fetal liver (FL) cells. (J) Overview of cell communities (Human Cell Atlas; 113 063 cells; integrated data from 14 FLs across 4 developmental stages; UMAP reduction; preprocessed data, clusters, and labels adopted from Popescu et al33). (K) HLF expression (z score normalized after MAGIC imputation). (L) Expression summary of HSC-associated genes in FL (scaled expression was averaged for each hematopoietic cell population and 4 gestation stages [7-8, 9-11, 12-14, and 15-17 postconception weeks]; row-normalized color scale). Nonhematopoietic cell populations were excluded. ILC, innate lymphoid cell; L/TL, early lymphoid/T lymphocyte; mac, macrophage; mono-mac, monocyte macrophage; neut-my, neutrophil myeloid; NK, natural killer; PBMC, peripheral blood mononuclear cell; pro, progenitor; TPM, transcripts per kilobase million.](https://ash.silverchair-cdn.com/ash/content_public/journal/blood/138/25/10.1182_blood.2021010745/7/m_bloodbld2021010745f1.png?Expires=1769082333&Signature=iBnO~Qq2kx72dhs0dC4I~F4LJKD1b2CqVOQ8KPJde9uV4NGX3UuygOFsYONmH4dq3H1sJYQOY1uzO750iGgszNQkWvkrUiTggG~9jXIwas7y5uofao5kDkIQ29LQ7coXW4aBSVoNG825BR09iJN4D8RNnSKUMBelcqitYJ-Ijdw31WXMIVWbgGVJ5AyJ1xCZ3pu8MO4rw10k4cqmaAuSrj~rUQUoX700fmpatiNLTgb3WoVsiXcUoO8X8tV7Y8gJId54GLHqe84fHnp4SThMPIWp2qX8z175KBoYTxGE-zT6z~TDzGGTlQ~HU3PN0yLo7egrsaz1ewaQPgQk4q5ieQ__&Key-Pair-Id=APKAIE5G5CRDK6RD3PGA)
Specific HLF expression in enriched human HSC populations. (A) HLF expression is enriched in cultured human HSC subsets. Differentially expressed genes from CD201+ vs CD201mid/−7 and ITGA3+/CD201+/CD90+/CD133+/C34+/CD45RA− (ITGA3+/CD201+) vs ITGA3−/CD201+/CD90+/CD133+/C34+/CD45RA−21 (ITGA3−/CD201+) after 7-day culture with UM171. Both transcriptomic surveys were integrated to identify consistently up- or downregulated genes. Ranking based on fold change between the most enriched (ITGA3+/CD201+) and most depleted (CD201−) HSC populations is summarized by a waterfall plot (left; log2 transformed). Range of expression is provided for each gene in square brackets. Each population includes biological replicates represented along the x-axis. ITGA3−/CD201+ is abbreviated for the ITGA3−/CD201+/CD90+/CD133+/C34+/CD45RA− population. (B) HLF expression is undetectable in mature blood leukocyte populations. A curated data set from Uhlen et al22 including between 4 and 6 biological replicates per population. (C) Single-cell transcriptomic overview of CB cell populations. CD34+ CB cells that were either thawed and noncultured (day 0) or UM171-expanded (day 7; 2 biological replicates for each condition; 15 921 total cells; fluorescence-activated cell sorting profiles are provided in supplemental Figure 2 green bars) were single-cell RNA sequenced (10X Chromium), integrated, and clustered using Seurat 3.50 Eleven cell clusters were identified in the integrated data set: HSPCs, lymphoid-primed multipotent progenitors (LMPPs), multipotent progenitors (MPPs), granulomonocytic progenitors (GMPs), megakaryocyte erythroid mast cell progenitors (MEMPs), megakaryocytes (mega), eosinophil/basophils (eo/ba), mast cells (mast), erythroid lineage cells (erythroid), neutrophils (neutro), and monocytic/dendritic cells (mono/DCs). Dimensional reduction was calculated using SPRING.51 Combined representation of integrated data. Marker genes for each cluster are provided in supplemental Table 1. (D-E) HSPC-specific HLF expression in thawed noncultured CD34+ cells and after 7-day ex vivo expansion in the presence of UM171. HLF expression is shown in single-cell transcriptomes that are represented separately by treatment. Normalized expression data (z score computed separately by treatment after MAGIC imputation52) is expressed in the color scale. (F) Comparison of HLF expression specificity vs selected HSC-associated genes and common HSC surface marker genes. Gene-wise z score distribution by treatment (fresh CD34+ and UM171 day 7) is represented as density for each cell community (same color code as in panel C). The mean z score for HLF in the HSPC cluster is provided as a dotted reference line for each treatment. (G-I) HLF expression is strongly enriched in HSC clusters in human bone marrow (BM). (G) Overview of cell clusters (Human Cell Atlas; 101 935 cells; integrated data from 8 donors; uniform manifold approximation and projection [UMAP] reduction; preprocessed data, clusters, and labels adopted from Hay et al32). (H) HLF expression (z score normalized after MAGIC imputation). (I) Expression summary of selected HSC-associated genes in human BM (scaled expression averaged for each hematopoietic cell population and donor (n = 8) in the data set; row-normalized color scale). Nonhematopoietic cell populations were excluded from this representation. (J-L) HLF expression is restricted to the HSC/MPP cluster in hematopoietic human fetal liver (FL) cells. (J) Overview of cell communities (Human Cell Atlas; 113 063 cells; integrated data from 14 FLs across 4 developmental stages; UMAP reduction; preprocessed data, clusters, and labels adopted from Popescu et al33). (K) HLF expression (z score normalized after MAGIC imputation). (L) Expression summary of HSC-associated genes in FL (scaled expression was averaged for each hematopoietic cell population and 4 gestation stages [7-8, 9-11, 12-14, and 15-17 postconception weeks]; row-normalized color scale). Nonhematopoietic cell populations were excluded. ILC, innate lymphoid cell; L/TL, early lymphoid/T lymphocyte; mac, macrophage; mono-mac, monocyte macrophage; neut-my, neutrophil myeloid; NK, natural killer; PBMC, peripheral blood mononuclear cell; pro, progenitor; TPM, transcripts per kilobase million.
Specific HLF expression in enriched human HSC populations. (A) HLF expression is enriched in cultured human HSC subsets. Differentially expressed genes from CD201+ vs CD201mid/−7 and ITGA3+/CD201+/CD90+/CD133+/C34+/CD45RA− (ITGA3+/CD201+) vs ITGA3−/CD201+/CD90+/CD133+/C34+/CD45RA−21 (ITGA3−/CD201+) after 7-day culture with UM171. Both transcriptomic surveys were integrated to identify consistently up- or downregulated genes. Ranking based on fold change between the most enriched (ITGA3+/CD201+) and most depleted (CD201−) HSC populations is summarized by a waterfall plot (left; log2 transformed). Range of expression is provided for each gene in square brackets. Each population includes biological replicates represented along the x-axis. ITGA3−/CD201+ is abbreviated for the ITGA3−/CD201+/CD90+/CD133+/C34+/CD45RA− population. (B) HLF expression is undetectable in mature blood leukocyte populations. A curated data set from Uhlen et al22 including between 4 and 6 biological replicates per population. (C) Single-cell transcriptomic overview of CB cell populations. CD34+ CB cells that were either thawed and noncultured (day 0) or UM171-expanded (day 7; 2 biological replicates for each condition; 15 921 total cells; fluorescence-activated cell sorting profiles are provided in supplemental Figure 2 green bars) were single-cell RNA sequenced (10X Chromium), integrated, and clustered using Seurat 3.50 Eleven cell clusters were identified in the integrated data set: HSPCs, lymphoid-primed multipotent progenitors (LMPPs), multipotent progenitors (MPPs), granulomonocytic progenitors (GMPs), megakaryocyte erythroid mast cell progenitors (MEMPs), megakaryocytes (mega), eosinophil/basophils (eo/ba), mast cells (mast), erythroid lineage cells (erythroid), neutrophils (neutro), and monocytic/dendritic cells (mono/DCs). Dimensional reduction was calculated using SPRING.51 Combined representation of integrated data. Marker genes for each cluster are provided in supplemental Table 1. (D-E) HSPC-specific HLF expression in thawed noncultured CD34+ cells and after 7-day ex vivo expansion in the presence of UM171. HLF expression is shown in single-cell transcriptomes that are represented separately by treatment. Normalized expression data (z score computed separately by treatment after MAGIC imputation52) is expressed in the color scale. (F) Comparison of HLF expression specificity vs selected HSC-associated genes and common HSC surface marker genes. Gene-wise z score distribution by treatment (fresh CD34+ and UM171 day 7) is represented as density for each cell community (same color code as in panel C). The mean z score for HLF in the HSPC cluster is provided as a dotted reference line for each treatment. (G-I) HLF expression is strongly enriched in HSC clusters in human bone marrow (BM). (G) Overview of cell clusters (Human Cell Atlas; 101 935 cells; integrated data from 8 donors; uniform manifold approximation and projection [UMAP] reduction; preprocessed data, clusters, and labels adopted from Hay et al32). (H) HLF expression (z score normalized after MAGIC imputation). (I) Expression summary of selected HSC-associated genes in human BM (scaled expression averaged for each hematopoietic cell population and donor (n = 8) in the data set; row-normalized color scale). Nonhematopoietic cell populations were excluded from this representation. (J-L) HLF expression is restricted to the HSC/MPP cluster in hematopoietic human fetal liver (FL) cells. (J) Overview of cell communities (Human Cell Atlas; 113 063 cells; integrated data from 14 FLs across 4 developmental stages; UMAP reduction; preprocessed data, clusters, and labels adopted from Popescu et al33). (K) HLF expression (z score normalized after MAGIC imputation). (L) Expression summary of HSC-associated genes in FL (scaled expression was averaged for each hematopoietic cell population and 4 gestation stages [7-8, 9-11, 12-14, and 15-17 postconception weeks]; row-normalized color scale). Nonhematopoietic cell populations were excluded. ILC, innate lymphoid cell; L/TL, early lymphoid/T lymphocyte; mac, macrophage; mono-mac, monocyte macrophage; neut-my, neutrophil myeloid; NK, natural killer; PBMC, peripheral blood mononuclear cell; pro, progenitor; TPM, transcripts per kilobase million.
Next, we benchmarked the expression of HLF against (1) HSC-associated genes we and others have identified (AVP25 and MLLT326) or that have previously been characterized in mice (PRDM16,27GATA3,11HOXB5,9MEIS1,13MECOM,10FGD5,12 and CTNNAL1 [α-catulin]8), as well as against (2) surface markers commonly used to prospectively isolate human HSCs (CD34,28 CD201 [PROCR],7 CD49c [ITGA3],21 CD133 [PROM1],29 CD90 [THY1],30 and CD49f [ITGA6]31; Figure 1F; supplemental Figure 3). Although varying degrees of HSPC-enriched expression was detectable for most of these genes (pink density profiles in Figure 1F; supplemental Figure 3; supplemental Tables 2 and 3), HLF, AVP, GATA3, MEIS1, HOXB5, MLLT3, and MECOM displayed the most specific expression within HSPCs of freshly purified human CD34+ CB cells (Figure 1F, left panels). Of note, these genes generally performed better than HSC-associated surface antigens, consistent with the requirement to stain for several of these markers in combination to achieve high HSC enrichment. In 7-day UM171-supplemented cultures, HLF, AVP, PRDM16, GATA3, and THY1 exhibited the highest HSPC enrichment (Figure 1F, right panel). When considering both unexpanded and day-7 UM171-expanded conditions, HLF, AVP, PRDM16, and GATA3 exhibited the highest specificity. To extend our analysis to different developmental and physiological contexts, and to assess specificity in a larger diversity of hematopoietic lineages and intermediates, we examined public single-cell transcriptomic data sets of adult bone marrow32 (Figure 1G-I; supplemental Figure 4A) and fetal liver33 (Figure 1J-L; supplemental Figure 4B), each aggregating >100 000 cells from several bioinformatically integrated specimens. These analyses demonstrated GATA3 expression in innate lymphoid cells, T cells, and NK cells and PRDM16 expression in embryonic lymphoid/T-lymphoid precursors and NK cells, eliminating these genes from further consideration (Figure 1I,L; supplemental Figure 4A-B).
Among hematopoietic cells in the adult bone marrow and fetal liver data sets, HLF exhibited pronounced HSPC-restricted expression and only negligible expression in a small subset of naïve T cells in adult bone marrow (Figure 1H-I). In nonhematopoietic cells, HLF expression was detectable in the stromal fraction of adult bone marrow, as well as in fetal liver fibroblasts and hepatocytes (Figure 1G-H).
Although AVP (arginine vasopressin) exhibited a similar expression profile as HLF, we focused on HLF for downstream experiments based on its reported function in HSCs.34-36
In summary, HLF is a gene with highly selective expression in HSC-enriched subpopulations across their most relevant anatomical and ontogenetic sources. As such, it can be regarded as an attractive candidate gene to mark human HSCs independently of developmental or environmental (eg, ex vivo culture) context.
Engineering of a genomic HLF reporter transgene in human cells
We reasoned that HLF expression, if visualized genetically, could provide a readout to identify immature human blood cells. To this end, we devised a strategy to introduce a fluorescent reporter cassette into the endogenous HLF locus using nucleofection of a Cas9/sgRNA RNP complex and delivery of a homologous recombination (HR) template by rAAV6 transduction.37 To maintain HLF protein function, we targeted the 3' end of the HLF open reading frame (Figure 2A; supplemental Figure 5). Several HR templates were designed to knock-in either an in-frame ZsG cassette or an IRES-ZsGreen cassette to capture endogenous HLF expression (supplemental Figure 6). Functional assessment in HLF-expressing HepG2 cells indicated that constructs with IRES-ZsGreen and either a P2A-linked puromycin resistance or truncated EGFR38 yielded the highest reporter expression (Figure 2A; supplemental Figure 6E-F).
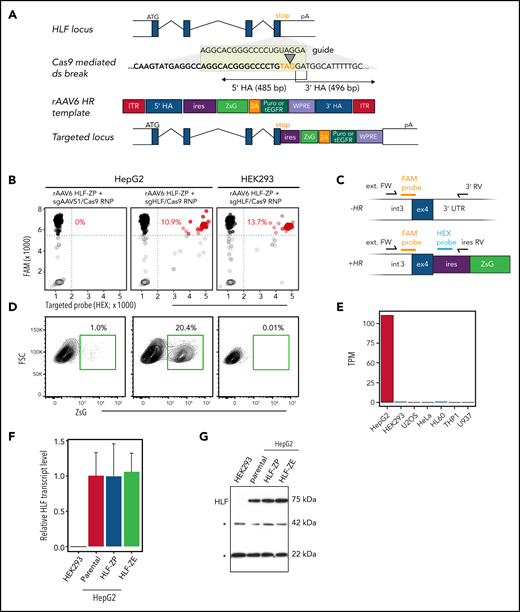
Engineering of a human genomic HLF reporter. (A) Outline of the HLF reporter–targeting strategy using CRISPR/Cas9 and rAAV6. A site-specific double-strand (ds) break at the HLF stop codon (orange) located in exon 4 is generated by a Cas9/sgHLF RNP complex. This stimulates HR with a single-stranded donor template delivered through rAAV6 infection. The resulting HR event results in a transgenic locus that coexpresses the HLF open reading frame and a multifunctional ZsGreen (ZsG) expression cassette connected the endogenous HLF open reading frame by an encephalomyocarditis virus internal ribosome entry site (ires). Gray boxes, HLF exons; white boxes, 5' and 3' untranslated regions; purple box, puromycin (puro) resistance or truncated EGFR (tEGFR) sequence linked to ZsG by a P2A for optional drug- or antibody-mediated selection. (B-E) Validation of the HLF reporter in human cell lines. HepG2 (HLF expressing) and HEK293 (HLF nonexpressing) cells were electroporated with Cas9/sgRNA RNP either as summarized in panel A or using sgAAVS1 as control. HLF-ZP, rAAV6-encoded HLF repair template driving expression of ZsG and puro resistance. Representative data of 2 independent experiments. (B) Droplet digital polymerase chain reaction (ddPCR) genotyping of targeted cell lines. Black dots represent HR− and red dots represent HR+ PCR droplets. HR percentages (red) were calculated as HR+ divided by the total number of specific amplicon-containing droplets (black and red). Representative data of 2 independent experiments. (C) ddPCR strategy. External forward primer (ext. FW) binding to a common region outside the 5' HA; 3' reverse (RV) primer amplifying unrecombined locus; ires RV primer amplifying recombined locus; HR− and HR+ amplicons are detected by a common FAM-labeled probe, and HR+ amplicons are additionally recognized by an HEX-labeled probe that binds to the ires region of the transgene. (D) Fluorescence-activated cell sorting analysis to detect reporter expression. (E) HLF expression levels in selected cell lines. Data curated from Human Protein Atlas.50 (F-G) HLF expression in reporter-targeted HepG2 cells. Parental or reporter-targeted/ZsG-sorted HepG2 cells were subjected to quantitative reverse transcription PCR (F) and Western (G) analyses to assess HLF expression. HEK293 cells served as negative control. Asterisks in panel G point to unspecific bands that were used as loading control. HA, homology arm; pA, endogenous HLF polyadenylation signal; TPM, transcripts per kilobase million; WPRE, woodchuck hepatitis virus posttranscriptional response element.
Engineering of a human genomic HLF reporter. (A) Outline of the HLF reporter–targeting strategy using CRISPR/Cas9 and rAAV6. A site-specific double-strand (ds) break at the HLF stop codon (orange) located in exon 4 is generated by a Cas9/sgHLF RNP complex. This stimulates HR with a single-stranded donor template delivered through rAAV6 infection. The resulting HR event results in a transgenic locus that coexpresses the HLF open reading frame and a multifunctional ZsGreen (ZsG) expression cassette connected the endogenous HLF open reading frame by an encephalomyocarditis virus internal ribosome entry site (ires). Gray boxes, HLF exons; white boxes, 5' and 3' untranslated regions; purple box, puromycin (puro) resistance or truncated EGFR (tEGFR) sequence linked to ZsG by a P2A for optional drug- or antibody-mediated selection. (B-E) Validation of the HLF reporter in human cell lines. HepG2 (HLF expressing) and HEK293 (HLF nonexpressing) cells were electroporated with Cas9/sgRNA RNP either as summarized in panel A or using sgAAVS1 as control. HLF-ZP, rAAV6-encoded HLF repair template driving expression of ZsG and puro resistance. Representative data of 2 independent experiments. (B) Droplet digital polymerase chain reaction (ddPCR) genotyping of targeted cell lines. Black dots represent HR− and red dots represent HR+ PCR droplets. HR percentages (red) were calculated as HR+ divided by the total number of specific amplicon-containing droplets (black and red). Representative data of 2 independent experiments. (C) ddPCR strategy. External forward primer (ext. FW) binding to a common region outside the 5' HA; 3' reverse (RV) primer amplifying unrecombined locus; ires RV primer amplifying recombined locus; HR− and HR+ amplicons are detected by a common FAM-labeled probe, and HR+ amplicons are additionally recognized by an HEX-labeled probe that binds to the ires region of the transgene. (D) Fluorescence-activated cell sorting analysis to detect reporter expression. (E) HLF expression levels in selected cell lines. Data curated from Human Protein Atlas.50 (F-G) HLF expression in reporter-targeted HepG2 cells. Parental or reporter-targeted/ZsG-sorted HepG2 cells were subjected to quantitative reverse transcription PCR (F) and Western (G) analyses to assess HLF expression. HEK293 cells served as negative control. Asterisks in panel G point to unspecific bands that were used as loading control. HA, homology arm; pA, endogenous HLF polyadenylation signal; TPM, transcripts per kilobase million; WPRE, woodchuck hepatitis virus posttranscriptional response element.
Further validation of the reporter construct (Figure 2A) in HepG2 and HEK293 cells revealed that only cognate pairing of guide RNA and repair template (Figure 2B) resulted in targeting to the HLF locus, as demonstrated by ddPCR designed to detect the integrated but not the episomal reporter cassette (Figure 2C). Importantly, targeted reporter integration resulted in stable ZsG expression in HepG2 but not in HEK293 cells (Figure 2D), thus recapitulating endogenous HLF expression levels (Figure 2E). Furthermore, reporter integration had no major effect on HLF expression in targeted HepG2 cells (Figure 2F-G). These results not only provided proof-of-principle of the experimental approach but also demonstrated reporter functionality and selectivity.
Optimization of HLF reporter targeting in CD34+ HSPCs
We next attempted HR to the HLF locus in CB-derived HSPCs using reported settings.37 To this end, we used an rAAV6 HR template that contained a constitutive ubiquitin C promoter–driven ametrine fluorescent protein cassette (supplemental Figures 6A and 7A). Because this promoter drives high expression after genomic integration but not from episomal rAAV vectors,39 it provided a direct readout of insertion into the CRISPR-targeted HLF locus. Indeed, we observed up to 55% of cells with high ametrine expression in sgHLF/Cas9 RNP but not in mock-electroporated cells, indicative of targeted integration (supplemental Figure 7B-C). CD34 profiles were comparable between ametrine-positive and -negative populations, suggesting largely uniform targeting efficiencies (supplemental Figure 7B). Notably, elevated rAAV6 concentrations resulted in marked cell toxicity (supplemental Figure 7C), necessitating careful titration.
We next tested the promoterless HLF reporter construct (Figure 2A; supplemental Figure 6E) in CD34+ cells, which, after 3 days of preexpansion with UM171, were divided into HSC-enriched and -depleted populations based on high or low CD201 surface expression, respectively7 (Figure 3A-B). These subfractions, as well as unsorted (bulk) cells, were expanded for an additional 24 hours, electroporated with Cas9/sgHLF RNP, and transduced with the repair template encoding rAAV6 over a range of virus/cell ratios (multiplicity of infection, MOI100-1000). Finally, after 3 additional days of HSC-supportive culture, ddPCR and fluorescence-activated cell sorting analyses to evaluate HR efficiencies and reporter expression were performed (Figure 3A).
![Optimization of HLF reporter targeting in CD34+ HSPCs. (A) Outline of experimental strategy to optimize reporter integration in CD34+ CB cells. (B) Fluorescence-activated cell sorting (FACS) strategy to enrich/deplete HSCs based on CD201 expression from expanded CD34+ cells at day 3 of culture with UM171. (C) Selective HLF reporter expression in HSC-containing subfractions of CD34+ CB cell cultures. Reporter targeting was carried on day 4 of culture. Total and ZsG+ cell counts were determined by FACS on day 3 posttargeting and normalized to 10e4 cells plated in 96-well plates. HR allele frequencies were determined in 1 of 4 replicate wells. One of 5 independent experiments covering 4 biological replicates is shown. Nucleofection program DZ100. (D) Effect of TP53 knockdown on HR and cell yield. CD201+ cells were sorted and targeted as in panel C (multiplicity of infection 400 [MOI400]; nucleofection program DZ100) and, as an additional condition, electroporated with RNP and siRNA against TP53. Cell counts were acquired using FACS 3 days posttargeting and normalized to 10e4 plated cells. One of 4 independent experiments covering 4 biological replicates is shown. (E-F) Effect of reporter targeting and TP53 knockdown on cell survival. UM171-expanded CD34+ CB cells were sorted based on CD201 expression at day 3 of culture, nucleofected 48 hours postsorting (program CA137), and transduced with rAAV6 (MOI1000) where indicated. (E) Viability was determined at the indicated time points (days 1-3 postnucleofection) using forward scatter (FSC)/side scatter (SSC), annexin V, and 7-AAD, as summarized in the color legend. (F) Live cell counts (normalized to 10e4 plated cells) and ZsG+ and HR frequencies are plotted. HR frequencies were determined by ddPCR using remaining cells of pooled replicate wells after FACS analysis. Four technical replicates per time point are plotted. The presented data represent 3 independent experiments across 3 biological replicates.](https://ash.silverchair-cdn.com/ash/content_public/journal/blood/138/25/10.1182_blood.2021010745/7/m_bloodbld2021010745f3.png?Expires=1769082333&Signature=gUUwiW8PYpNWIslmNv0zxr-~ykvqIREnp8P~8utN~jBii0DY4KkAn5EsjpUErRo-N65S36VdfjkogXbtLihO1JWwh1LwF2D3iS5NAQDx2B4uTNdaG6-CDfxD50W70qXFxh2XQeoTJjRIH448FoGqEivAGY9reD69nJyyY0P0E8Rn--BnbfvZ3Lzy5VNRcusE93RshE4tO4Y1hf3oTd-qeiZISl7PK8EYm1i9gdka1~FBlcQl6G-4oTyofy8ORi-3c7eIMngVbrV6uGaf3fCwi2QLhBvllVH4bx5Shz2FjVCuoDk5ixvkx4CWWc8jpcPwF~EH~qSmnkqRbbLUQWew-Q__&Key-Pair-Id=APKAIE5G5CRDK6RD3PGA)
Optimization of HLF reporter targeting in CD34+ HSPCs. (A) Outline of experimental strategy to optimize reporter integration in CD34+ CB cells. (B) Fluorescence-activated cell sorting (FACS) strategy to enrich/deplete HSCs based on CD201 expression from expanded CD34+ cells at day 3 of culture with UM171. (C) Selective HLF reporter expression in HSC-containing subfractions of CD34+ CB cell cultures. Reporter targeting was carried on day 4 of culture. Total and ZsG+ cell counts were determined by FACS on day 3 posttargeting and normalized to 10e4 cells plated in 96-well plates. HR allele frequencies were determined in 1 of 4 replicate wells. One of 5 independent experiments covering 4 biological replicates is shown. Nucleofection program DZ100. (D) Effect of TP53 knockdown on HR and cell yield. CD201+ cells were sorted and targeted as in panel C (multiplicity of infection 400 [MOI400]; nucleofection program DZ100) and, as an additional condition, electroporated with RNP and siRNA against TP53. Cell counts were acquired using FACS 3 days posttargeting and normalized to 10e4 plated cells. One of 4 independent experiments covering 4 biological replicates is shown. (E-F) Effect of reporter targeting and TP53 knockdown on cell survival. UM171-expanded CD34+ CB cells were sorted based on CD201 expression at day 3 of culture, nucleofected 48 hours postsorting (program CA137), and transduced with rAAV6 (MOI1000) where indicated. (E) Viability was determined at the indicated time points (days 1-3 postnucleofection) using forward scatter (FSC)/side scatter (SSC), annexin V, and 7-AAD, as summarized in the color legend. (F) Live cell counts (normalized to 10e4 plated cells) and ZsG+ and HR frequencies are plotted. HR frequencies were determined by ddPCR using remaining cells of pooled replicate wells after FACS analysis. Four technical replicates per time point are plotted. The presented data represent 3 independent experiments across 3 biological replicates.
Optimization of HLF reporter targeting in CD34+ HSPCs. (A) Outline of experimental strategy to optimize reporter integration in CD34+ CB cells. (B) Fluorescence-activated cell sorting (FACS) strategy to enrich/deplete HSCs based on CD201 expression from expanded CD34+ cells at day 3 of culture with UM171. (C) Selective HLF reporter expression in HSC-containing subfractions of CD34+ CB cell cultures. Reporter targeting was carried on day 4 of culture. Total and ZsG+ cell counts were determined by FACS on day 3 posttargeting and normalized to 10e4 cells plated in 96-well plates. HR allele frequencies were determined in 1 of 4 replicate wells. One of 5 independent experiments covering 4 biological replicates is shown. Nucleofection program DZ100. (D) Effect of TP53 knockdown on HR and cell yield. CD201+ cells were sorted and targeted as in panel C (multiplicity of infection 400 [MOI400]; nucleofection program DZ100) and, as an additional condition, electroporated with RNP and siRNA against TP53. Cell counts were acquired using FACS 3 days posttargeting and normalized to 10e4 plated cells. One of 4 independent experiments covering 4 biological replicates is shown. (E-F) Effect of reporter targeting and TP53 knockdown on cell survival. UM171-expanded CD34+ CB cells were sorted based on CD201 expression at day 3 of culture, nucleofected 48 hours postsorting (program CA137), and transduced with rAAV6 (MOI1000) where indicated. (E) Viability was determined at the indicated time points (days 1-3 postnucleofection) using forward scatter (FSC)/side scatter (SSC), annexin V, and 7-AAD, as summarized in the color legend. (F) Live cell counts (normalized to 10e4 plated cells) and ZsG+ and HR frequencies are plotted. HR frequencies were determined by ddPCR using remaining cells of pooled replicate wells after FACS analysis. Four technical replicates per time point are plotted. The presented data represent 3 independent experiments across 3 biological replicates.
Within corresponding experimental conditions, allelic HR frequencies were similar between bulk, HSC-enriched, and depleted fractions and reached a maximum of ∼50% with the highest tested rAAV6 virus titer of MOI1000 (Figure 3C top panels). Strikingly, although HSC-depleted CD201− cultures gave rise to no ZsG+ cells (Figure 3C, right panel, green and purple) despite successful HR, reporter-expressing cells were readily detectable in all other rAAV6-containing conditions (Figure 3C, green and purple), although at low percentages. In essence, preenrichment of CD201+ cells and rAAV6 transduction at MOI400 yielded the highest number of ZsG+ cells among all tested conditions (Figure 3C, third panel row, data in green), although HR reached only intermediate levels with these parameters. This suggested increased rAAV6 toxicity for HLF-expressing cells compared with bulk cultures (Figure 3C, middle panels; supplemental Figure 7C).
Because the targeting procedure affected overall cell recovery at day 7 compared with untreated controls (Figure 3C, second panel row, blue), we next tested whether transient TP53 inhibition could partially alleviate this effect as suggested.40
Although coelectroporation of synthetic siRNA against TP53 did not increase overall HR efficiency (Figure 3D, top left panel), it resulted in a significantly enhanced recovery of HLF-ZsG expressing cells (Figure 3D, left bottom panel). Importantly, although total cell numbers increased only marginally upon transient TP53 knockdown (Figure 3D, left middle panel), the effect on cell yield was increasingly pronounced in immature HSPC subsets defined by surface marker expression (Figure 3D, right panels, with increasing HSC enrichment from top to bottom).
During further optimization of the targeting protocol with siTP53, striking differences between different nucleofection programs in their abilities to yield reporter-positive cells were observed (supplemental Figure 8A, green bars). In agreement with a previous report,41 CA137 outperformed all other tested nucleofection programs, including those commonly used for gene editing in human HSPCs. Importantly, this was largely independent of overall HR efficiency (supplemental Figure 8A, red bars) but was likely due to improved survival of total cultures and, to an even larger extent, HLF-expressing cells in response to the physical nucleofection parameters. In addition, reduced rAAV6-mediated toxicity was observed with CA137, thus allowing for higher viral titers to reach an optimal number of reporter-expressing cells (supplemental Figure 8B). Although the combination of optimized nucleofection and increased tolerance to rAAV6 titers improved the yield of reporter-positive cells by more than fivefold, the overall impact on cell viability remained significant (supplemental Figure 8A) and therefore warranted further examination of the role of TP53. To this end, quantification of apoptosis and cell death confirmed that the more primitive CD201-enriched subset was disproportionately affected by the additive effects of nucleofection, Cas9 RNP, and rAAV6 (Figure 3E top vs bottom panels). Transient TP53 knockdown partially protected from these adverse effects of the targeting procedure, especially Cas9 RNP nucleofection and rAAV6 transduction (Figure 3E 4, panels at the top right). Most strikingly, however, the survival of reporter-positive cells was strongly dependent on TP53 knockdown beyond day 2 posttargeting (Figure 3F, 2 right panels in the center).
We conclude that, in addition to nuclease-mediated gene editing resulting in a TP53-dependent proliferation arrest and functional impairment of HSCs,40 their immediate survival is similarly affected. While these experiments establish a feasible experimental approach to visualize endogenous HLF expression in CB HSPCs, they also illustrate important limitations of current gene editing protocols with respect to their impact on the survival of the most primitive HSPCs.
Selective HLF reporter expression in immunophenotypic human LT-HSCs
Next, we aimed to validate the expression of the HLF-ZsG reporter in the context of stem cell–specific surface marker panels adapted for cultured CB cells.7,21
To this end, ∼20% targeted allele frequencies were observed in CD201−- and CD201+-sorted cells (Figure 4A), resulting in an average of 1.17% reporter expression specific to CD201+-sorted cells (Figure 4B-C). Strikingly, reporter-positive cells largely expressed LT-HSC surface phenotypes defined by characteristic combinations of CD34, CD45RA, CD201, CD90, and ITGA3 (Figure 4D-E). Dimensionality reduction of these surface marker and HLF-ZsG expression profiles indicated that HLF-ZsG expression defined a concise subpopulation that nested inside increasingly restricted immunophenotypically defined HSC populations (Figure 4F). As expected, HLF-ZsG transgene expression increased within progressively restrictive HSC surface marker gates but only reached a maximum of 8% within the CD34+CD201+CD90+ITGA3+ population (Figure 4G-H). Considering the observed 20.2% targeted allele frequency, this suggests that HLF-expressing cells indeed represent only a fraction of this subpopulation. More specifically, extrapolation of these frequencies indicated that HLF-expressing cells constitute <40% of the CD34+CD201+CD90+ITGA3+ population (supplemental Table 4).
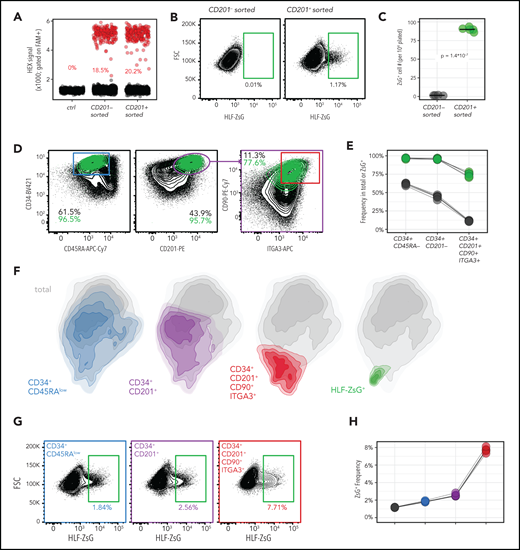
Selective HLF reporter expression in immunophenotypic human LT-HSC populations. CB-derived CD34+ cells were processed as in Figure 3D, with the addition of siTP53 and transduction of rAAV6 HLF-ZsG P2A tEGFR at multiplicity of infection 400. One representative of 4 independent experiments covering 4 biological replicates is shown. (A) HR allele frequencies in CD201+/− presorted fractions as determined by ddPCR. Gated on FAM+ (common probe) droplets, HEX+ droplets (red) identified HR allele amplicons. (B-C) Reporter expression in CD201+/−presorted fractions. Aggregated fluorescence-activated cell sorting (FACS) analysis (B) and summary by repeat (n = 4 for CD201− and n = 5 for CD201+ sorted; unpaired, 2-sided P value by Student t test is indicated) (C). (D-E) Immunophenotypes of ex vivo–expanded (UM171+) HLF-targeted HSPCs. FACS analysis of total (black) vs reporter-expressing (green) populations at day 7. Percentages of increasingly restricted HSC gates are provided for each population. Aggregated FACS data (D) and summary (E). (F) Dimensional reduction based on FACS analysis. UMAP reduction using CD34, CD45RA, CD201, CD90, ITGA3, and ZsG FACS intensities from panel D were calculated and are represented as a 2-dimensional density plot of all cells (gray, n = 306 797). Cells falling into surface immunophenotypic HSC or ZsG−gates are overlaid and color coded as in panel D. (G-H) HLF reporter expression within immunophenotypic HSC gates. Reverse gating of the same data as above showing reporter expression in increasingly restricted HSC gates. Aggregated FACS data from all repeats (G) and summary (H). FSC, forward scatter; PE, phycoerythrin.
Selective HLF reporter expression in immunophenotypic human LT-HSC populations. CB-derived CD34+ cells were processed as in Figure 3D, with the addition of siTP53 and transduction of rAAV6 HLF-ZsG P2A tEGFR at multiplicity of infection 400. One representative of 4 independent experiments covering 4 biological replicates is shown. (A) HR allele frequencies in CD201+/− presorted fractions as determined by ddPCR. Gated on FAM+ (common probe) droplets, HEX+ droplets (red) identified HR allele amplicons. (B-C) Reporter expression in CD201+/−presorted fractions. Aggregated fluorescence-activated cell sorting (FACS) analysis (B) and summary by repeat (n = 4 for CD201− and n = 5 for CD201+ sorted; unpaired, 2-sided P value by Student t test is indicated) (C). (D-E) Immunophenotypes of ex vivo–expanded (UM171+) HLF-targeted HSPCs. FACS analysis of total (black) vs reporter-expressing (green) populations at day 7. Percentages of increasingly restricted HSC gates are provided for each population. Aggregated FACS data (D) and summary (E). (F) Dimensional reduction based on FACS analysis. UMAP reduction using CD34, CD45RA, CD201, CD90, ITGA3, and ZsG FACS intensities from panel D were calculated and are represented as a 2-dimensional density plot of all cells (gray, n = 306 797). Cells falling into surface immunophenotypic HSC or ZsG−gates are overlaid and color coded as in panel D. (G-H) HLF reporter expression within immunophenotypic HSC gates. Reverse gating of the same data as above showing reporter expression in increasingly restricted HSC gates. Aggregated FACS data from all repeats (G) and summary (H). FSC, forward scatter; PE, phycoerythrin.
In summary, HLF-ZsG expression has the potential to surrogate multiparametric fluorescence-activated cell sorting analysis to identify the most immature cells in ex vivo CB cell cultures.
HLF expression identifies repopulating cells in CD34+ CB cultures
To test the ability of the reporter to identify functional HSCs, we sorted and transplanted either bulk HLF-ZsG–targeted (Figure 5A, orange), reporter-expressing (Figure 5A, green), or reporter-nonexpressing subpopulations (Figure 5A, purple) of CD201 preenriched HSPCs. To control for adverse effects of the targeting procedure, 2 additional cohorts received the same CD201 preenriched cells that were either left untreated (Figure 5A, red) or electroporated with a neutral guide RNA (sgAAVS1) and transduced exactly as in the test group (Figure 5A, blue). Importantly, transplanted cell doses were proportional to reporter-positive vs -negative subsets in the total targeted population (summarized in Figure 5B).
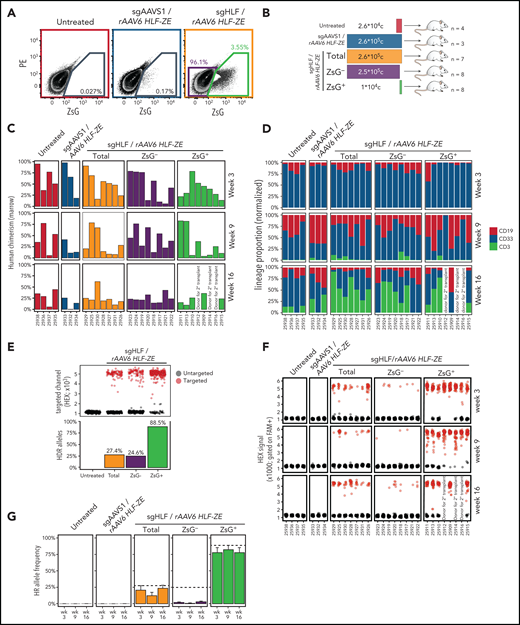
HLF expression identifies repopulating cells in CD34+ CB cell cultures. (A) Fluorescence-activated cell sorting plots showing the sorting of HLF reporter–targeted population for transplantation. A pool of 8 CB units was split into 3 and processed as indicated. Cells were sorted for CD201+ at day 3 and nucleofected at day 4 using program DZ100, including siTP53 followed by transduction with multiplicity of infection 400 of rAAV6. (B) Summary of transplantation layout. Transplantation cohorts and cell doses are represented using the same color code as in panel A. (C) Human engraftment summary of transplant-recipient NSGS mice. Human bone marrow chimerism determined based on human CD45+ cells among total CD45+ (mouse and human) cells at short- (week 3), intermediate- (week 9), and long-term (week 16) posttransplantation time points plotted using the same color code as in panels A and B. Each recipient mouse is represented along the x-axis (NSGS ID). Recipients are arranged by descending average reconstitution across all time points. Recipients #25912, #25914, and #25916 were euthanized at week 10 posttransplantation to be used as donors for secondary transplantation (summarized in Figure 6). (D) Lineage proportion of transplant recipients. Bone marrow biopsies were analyzed and arranged as in panel C. Normalized proportions of B cells (CD19), myeloid cells (CD33), and T cells (CD3) within human CD45+ cells for each time point and recipient are color coded as indicated. (E) HR allele frequencies in pretransplanted cell populations. Top: ddPCR droplets are pregated based on FAM positivity; black droplets represent FAM+/HEX− events indicative of untargeted alleles; red droplets (FAM+/HEX+) indicate targeted alleles, subsampled to 300 droplets per specimen. Bottom: quantification summary of HR frequencies calculated based on targeted/(untargeted + targeted) droplets. (F) ddPCR analysis of bone marrow biopsies at weeks 3, 9, and 16. Specimens are arranged as in panel C; ddPCR droplets are represented as in panel E, subsampled to 50 droplets per specimen and time point. (G) HR allele tracing summary. Summarized data representation of panels E and F. Dashed lines represent allele frequencies at the time of transplantation. Bars represent average HR allele frequencies from panel E with standard error bars; color codes as in panels A-C. One representative experiment of 2 independent experiments is summarized. PE, phycoerythrin.
HLF expression identifies repopulating cells in CD34+ CB cell cultures. (A) Fluorescence-activated cell sorting plots showing the sorting of HLF reporter–targeted population for transplantation. A pool of 8 CB units was split into 3 and processed as indicated. Cells were sorted for CD201+ at day 3 and nucleofected at day 4 using program DZ100, including siTP53 followed by transduction with multiplicity of infection 400 of rAAV6. (B) Summary of transplantation layout. Transplantation cohorts and cell doses are represented using the same color code as in panel A. (C) Human engraftment summary of transplant-recipient NSGS mice. Human bone marrow chimerism determined based on human CD45+ cells among total CD45+ (mouse and human) cells at short- (week 3), intermediate- (week 9), and long-term (week 16) posttransplantation time points plotted using the same color code as in panels A and B. Each recipient mouse is represented along the x-axis (NSGS ID). Recipients are arranged by descending average reconstitution across all time points. Recipients #25912, #25914, and #25916 were euthanized at week 10 posttransplantation to be used as donors for secondary transplantation (summarized in Figure 6). (D) Lineage proportion of transplant recipients. Bone marrow biopsies were analyzed and arranged as in panel C. Normalized proportions of B cells (CD19), myeloid cells (CD33), and T cells (CD3) within human CD45+ cells for each time point and recipient are color coded as indicated. (E) HR allele frequencies in pretransplanted cell populations. Top: ddPCR droplets are pregated based on FAM positivity; black droplets represent FAM+/HEX− events indicative of untargeted alleles; red droplets (FAM+/HEX+) indicate targeted alleles, subsampled to 300 droplets per specimen. Bottom: quantification summary of HR frequencies calculated based on targeted/(untargeted + targeted) droplets. (F) ddPCR analysis of bone marrow biopsies at weeks 3, 9, and 16. Specimens are arranged as in panel C; ddPCR droplets are represented as in panel E, subsampled to 50 droplets per specimen and time point. (G) HR allele tracing summary. Summarized data representation of panels E and F. Dashed lines represent allele frequencies at the time of transplantation. Bars represent average HR allele frequencies from panel E with standard error bars; color codes as in panels A-C. One representative experiment of 2 independent experiments is summarized. PE, phycoerythrin.
We assessed the engraftment potential of these cells in transplant-recipient NSGS mice at short- (3 weeks), intermediate- (9 weeks), and long-term (16 weeks) time points. Even though at least 25-fold fewer HLF-ZsG–expressing cells were transplanted compared with reporter-nonexpressing or total HLF-ZsG–targeted cells, comparable reconstitution levels (Figure 5C) and similar lineage contributions (Figure 5D) were achieved in these cohorts. Furthermore, we observed similar levels of human hematopoietic chimerism between sgAAVS1 controls and HLF-ZsG–targeted recipients, indicating that genetic manipulation of the HLF locus has little functional impact on HSC activity beyond what can be attributed to the targeting procedure (Figure 5C, first 3 panel columns). Of note, total targeted (sgHLF) and control targeted (sgAAVS1) cohorts exhibited comparable reconstitution levels as untreated controls, despite having received 10 times higher transplant doses. In agreement with previous reports,40,42 this indicated a significant impact of the gene editing procedure on HSC fitness after transplantation.
While these results suggested a strong enrichment for reconstitution activity in reporter-expressing cells based on transplanted cell doses, we additionally traced the engineered reporter allele in transplant recipients by ddPCR to test whether human engraftment in the reporter-nonexpressing cohort had mainly emerged from nontargeted HSCs. Indeed, this was confirmed by the observation that HR allele ratios of 24.6% in the reporter-nonexpressing fraction at transplantation (Figure 5E, blue) dropped sharply in the progeny of these cells in vivo (Figure 5F-G). By contrast, HR allele frequencies remained largely stable between pre- and posttransplantation time points in sorted reporter-positive and total targeted populations, the latter observation suggesting no competitive difference between successfully targeted vs nontargeted HSCs. Strikingly, HR allele frequency reached 88.5% in the HLF-ZsG–expressing fraction indicating that most of these cells carried biallelic reporter integration (Figure 5E).
Taken together, these results demonstrate that reporter-visualized HLF expression can identify multipotent cells with high in vivo regenerative potential in CD34+ CB cell cultures.
HLF expression labels HSCs with extensive self-renewal capacity
At 3 weeks posttransplantation, a well-defined reporter-positive subfraction within CD34-high bone marrow cells was detectable in recipients of total or ZsG+HLF-ZsG–targeted cell transplants but was absent in ZsG− recipients (Figure 6A). To test whether HLF expression continued to label stem cells after transplantation, we selected 3 HLF-ZsG–targeted ZsG+ primary recipients with detectable ZsG+ cells at week 10.5 (Figure 6B) and high (>96% each) HR allele ratios (Figure 5F) as donors for secondary transplantation. We first magnetically enriched CD34+ cells from the pooled bone marrow of these donors and then sorted reporter-expressing cells as well as a corresponding population that expressed similar CD34 levels but was 16.6-fold more abundant. Proportional cell numbers of these populations (900 and 1.5 × 10e4, respectively) were intrahepatically transplanted into newborn secondary recipient mice to maximize reconstitution efficiency (Figure 6C). Significant differences in human engraftment between HLF-ZsG+ and CD34high/HLF-ZsG− secondary recipients were observed at short-, intermediate-, and long-term posttransplantation time points (Figure 6D). More specifically, although all HLF-ZsG− secondary recipients were characterized by low-level and transient reconstitution, pronounced and multilineage human chimerism was detectable in at least 4 of 10 HLF-ZsG+ recipients up to 16 weeks posttransplantation (Figure 6D-E).
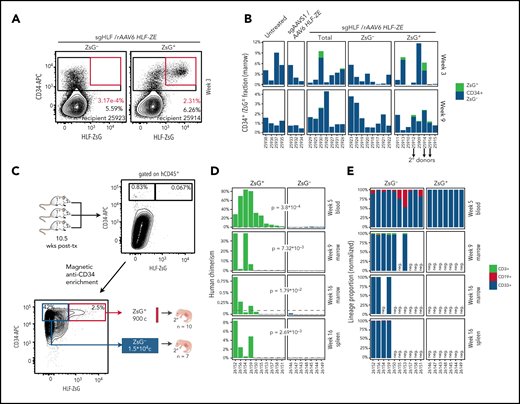
HLF reporter labels human HSCs with extensive self-renewal capacity. (A) Fluorescence-activated cell sorting plots of CD34+/HLF-ZsG+ population. Representative bone marrow biopsies of reporter-negative (sgHLF/rAAV6 HLF-ZE targeted, ZsG− sorted, left) and reporter-positive (sgHLF/rAAV6 HLF-ZE targeted, ZsG+ sorted, right) primary recipients, gated on human CD45+. (B) Summary of CD34+/HLF-ZsG+ population. Population overview of all primary recipients, pregated on human CD45+; recipient mice are arranged according to engraftment levels as in Figure 5C. (C) Strategy for secondary transplantation. The bone marrow of 3 primary recipients (sgHLF/rAAV6 HLF-ZE targeted, ZsG+ sorted cohort) was pooled and magnetically enriched for human CD34 expression. Reporter-expressing (ZsG+) and -nonexpressing cells (ZsG−) with comparable levels of CD34 expression were sorted for transplantation. Intrahepatic transplantation into newborn NSGS recipients as outlined. Corresponding cell doses of HLF-ZsG+ (n = 10) and HLF-ZsG− (n = 7) were transplanted. (D) Human engraftment summary of secondary recipients. Human chimerism in indicated tissues was determined based on human CD45-expressing cells among total (mouse and human) CD45+ cells at short- (week 5; blood), intermediate- (week 9; marrow), and long-term (week 16; marrow and spleen) time points posttransplantation. The dashed line represents the 0.1% mark used as the cutoff for engraftment positivity. Significance was calculated by unpaired 1-sided (alternative indicates greater) Wilcoxon test and is provided as a P value for a given comparison. (E) Lineage output of engrafted human cells. Positive specimens from panel D are shown and color coded for B cells (CD19+), myeloid cells (CD33+), and T cells (CD3). Normalized for lineage proportions within human CD45+ cells. Samples with <0.1% of human chimerism are designated negative (neg.). APC, allophycocyanin.
HLF reporter labels human HSCs with extensive self-renewal capacity. (A) Fluorescence-activated cell sorting plots of CD34+/HLF-ZsG+ population. Representative bone marrow biopsies of reporter-negative (sgHLF/rAAV6 HLF-ZE targeted, ZsG− sorted, left) and reporter-positive (sgHLF/rAAV6 HLF-ZE targeted, ZsG+ sorted, right) primary recipients, gated on human CD45+. (B) Summary of CD34+/HLF-ZsG+ population. Population overview of all primary recipients, pregated on human CD45+; recipient mice are arranged according to engraftment levels as in Figure 5C. (C) Strategy for secondary transplantation. The bone marrow of 3 primary recipients (sgHLF/rAAV6 HLF-ZE targeted, ZsG+ sorted cohort) was pooled and magnetically enriched for human CD34 expression. Reporter-expressing (ZsG+) and -nonexpressing cells (ZsG−) with comparable levels of CD34 expression were sorted for transplantation. Intrahepatic transplantation into newborn NSGS recipients as outlined. Corresponding cell doses of HLF-ZsG+ (n = 10) and HLF-ZsG− (n = 7) were transplanted. (D) Human engraftment summary of secondary recipients. Human chimerism in indicated tissues was determined based on human CD45-expressing cells among total (mouse and human) CD45+ cells at short- (week 5; blood), intermediate- (week 9; marrow), and long-term (week 16; marrow and spleen) time points posttransplantation. The dashed line represents the 0.1% mark used as the cutoff for engraftment positivity. Significance was calculated by unpaired 1-sided (alternative indicates greater) Wilcoxon test and is provided as a P value for a given comparison. (E) Lineage output of engrafted human cells. Positive specimens from panel D are shown and color coded for B cells (CD19+), myeloid cells (CD33+), and T cells (CD3). Normalized for lineage proportions within human CD45+ cells. Samples with <0.1% of human chimerism are designated negative (neg.). APC, allophycocyanin.
On the basis of these observations, we conclude that in addition to labeling human HSCs ex vivo, HLF expression continues to mark HSCs with extensive reconstitution activity in vivo. These results thus demonstrate the potential of HLF reporter transgenesis to visualize human blood stem cells in real time under experimental conditions.
Discussion
To develop an approach to directly mark the rare stem cell fraction within the human blood system, we identify HLF as 1 of the most selectively expressed genes in human HSCs, corroborating its reported roles in HSC self-renewal and multipotency in mice.35,36 Interestingly, in addition to these activities, ectopically expressed HLF imparts self-renewal to differentiation-committed blood cells through its DNA binding activity, in the context of recurrent chromosomal fusions with TCF3 in t(17;19) acute B-lymphoblastic leukemia43 and as a reprogramming factor in murine-induced HSCs,44 suggesting a role as a central master regulator in HSCs.
Transgenic labeling of mouse HSCs has only recently been used to study these cells in their physiological and anatomical contexts during development14 and in adults.8-10,13
Here, we provide the first demonstration of transgenic labeling of human HSCs to date. Our approach builds on recently established methodology allowing precise genetic manipulations in human HSCs.15 Nonetheless, significant challenges that severely limit clinical translation and experimental gene editing in HSCs remain. These challenges primarily relate to the efficiency and functional impact of the delivery method (eg, electroporation and immune response to HR templates and sgRNA)45,46 and activities of the editing machinery, most notably the introduction of DNA double-strand breaks.40 Our data confirm this and further demonstrate that nucleofection, Cas9 RNP, and rAAV6 exert additive effects that disproportionately affect survival of the most primitive HSPC subsets. Because functional HSCs exist only at low frequency within the CD34+ population, these detrimental effects are easily missed. In efforts to improve CRISPR-based gene editing methods in human HSCs, the presented HLF reporter has the potential to provide a directly quantifiable platform. Importantly, this was demonstrated during establishment of optimal rAAV6 titers (Figure 3; supplemental Figure 8), use of siTP53 (Figure 3), and screening for improved nucleofection parameters (supplemental Figure 8), which together allowed a >15-fold improvement compared with the initially used conditions.37 Because the development of more gentle delivery methods of the editing machinery is an active area of investigation to optimize targeted gene therapies in stem cells, we believe that the HLF reporter can contribute to the identification and fine-tuning of these methods, such as non-electroporation-based methods like engineered nanoparticles47 or virus-like particles.48,49
Lastly, an additional limitation of the presented strategy is that a significant fraction of HSCs remain untargeted and therefore escape labeling. As a consequence, the reliable identification of HLF-nonexpressing cells, including progenitors, to understand the role of HLF during lineage commitment is not possible with the current approach. In principle, a constitutive and integration-dependent marker cassette in the HR template has the potential to solve this issue, but this transcriptionally interfered with endogenous HLF expression in all tested configurations, thereby abolishing its intended utility (supplemental Figure 6A-C).
Despite these limitations, quantitative readout of the human HSC reporter should support further optimization of human HSC expansion conditions, either through screening for pharmacological self-renewal agonists or systematic optimization of overall culture design.
Acknowledgments
The authors thank Melanie Frechette and Valérie Blouin-Chagnon for assistance with mouse experiments, Keith Humphries, Julie Lessard, and Trang Hoang for critical reading of the manuscript, Annie Gosselin and Angelique Bellemare for assistance in fluorescence-activated cell sorting sorting, and Mike Tyers for providing access to nucleofection equipment.
Authorship
Contribution: B.L. was responsible for project conception, designed and performed all experiments, performed experimental and bioinformatic data analyses and interpretation, generated all figures, and wrote the manuscript; J.C. and E.T. performed technical setup and provided assistance with CD34+ cell culture and fluorescence-activated cell sorting experiments, experimental design, and interpretation of results; T.M. designed and assisted with ddPCR analyses; S.C., I.B., A.D., and D.G. provided assistance with CD34+ cell purification and banking; N.M. provided assistance with CD34+ cell purification and banking and mouse experiments; and G.S. was responsible for project supervision and coordination, experimental design, interpretation of results, and manuscript preparation.
Conflict-of-interest disclosure: The authors declare no competing financial interests.
Correspondence: Bernhard Lehnertz, Molecular Genetics of Stem Cells Laboratory, Institute for Research in Immunology and Cancer, University of Montreal, PO. Box 6128, Station Centre-Ville, Montreal, QC H3C 3J7, Canada; e-mail: bernhard.j.lehnertz@umontreal.ca; and Guy Sauvageau, Molecular Genetics of Stem Cells Laboratory, Institute for Research in Immunology and Cancer, University of Montreal, PO. Box 6128, Station Centre-Ville, Montreal, QC H3C 3J7, Canada; e-mail: guy.sauvageau@umontreal.ca.
The data reported in this article for previously published data sets have been deposited in the Gene Expression Omnibus database: EPCR population (GSE77128) and ITGA3 population (GSE130974). Uncultured and UM171-expanded CD34+ single-cell data sets have also been deposited to Gene Expression Omnibus (GSE153370).
The human bone marrow single-cell data set is available through the Human Cell Atlas and was downloaded as count matrix through the HCAData portal in R (https://github.com/federicomarini/HCAData). The human fetal liver data set was obtained as an annotated count matrix from Muzlifah Haniffa and is available at ArrayExpress (E-MTAB-7407). The AAV2 HLF-ZE and HLF-ZP HR constructs are available through Addgene (#175034 and #175035).
The current affiliation for B.L. is ExCellThera Inc., 2950, Chemin de Polytechnique, Montréal, QC H3T 1J4, Canada. Email: bernhard.lehnertz@excellthera.com.
The online version of this article contains a data supplement.
The publication costs of this article were defrayed in part by page charge payment. Therefore, and solely to indicate this fact, this article is hereby marked “advertisement” in accordance with 18 USC section 1734.

This feature is available to Subscribers Only
Sign In or Create an Account Close Modal