

Key Points
HLH-like toxicities of CAR T cells (carHLH) occurring in those with CRS associated with higher CAR T-cell expansion and persistence.
Recognition of carHLH as a CRS variant is needed to optimize treatment approaches and improve patient outcomes.

Abstract
Chimeric antigen receptor (CAR) T-cell toxicities resembling hemophagocytic lymphohistiocytosis (HLH) occur in a subset of patients with cytokine release syndrome (CRS). As a variant of conventional CRS, a comprehensive characterization of CAR T-cell–associated HLH (carHLH) and investigations into associated risk factors are lacking. In the context of 59 patients infused with CD22 CAR T cells where a substantial proportion developed carHLH, we comprehensively describe the manifestations and timing of carHLH as a CRS variant and explore factors associated with this clinical profile. Among 52 subjects with CRS, 21 (40.4%) developed carHLH. Clinical features of carHLH included hyperferritinemia, hypertriglyceridemia, hypofibrinogenemia, coagulopathy, hepatic transaminitis, hyperbilirubinemia, severe neutropenia, elevated lactate dehydrogenase, and occasionally hemophagocytosis. Development of carHLH was associated with preinfusion natural killer(NK) cell lymphopenia and higher bone marrow T-cell:NK cell ratio, which was further amplified with CAR T-cell expansion. Following CRS, more robust CAR T-cell and CD8 T-cell expansion in concert with pronounced NK cell lymphopenia amplified preinfusion differences in those with carHLH without evidence for defects in NK cell mediated cytotoxicity. CarHLH was further characterized by persistent elevation of HLH-associated inflammatory cytokines, which contrasted with declining levels in those without carHLH. In the setting of CAR T-cell mediated expansion, clinical manifestations and immunophenotypic profiling in those with carHLH overlap with features of secondary HLH, prompting consideration of an alternative framework for identification and management of this toxicity profile to optimize outcomes following CAR T-cell infusion.
Introduction
Hemophagocytic lymphohistiocytosis (HLH), an inflammatory syndrome resulting from pathological T-cell activation, is associated with natural killer(NK) cell dysfunction1-4 and manifests with hyperferritinemia, coagulopathy, hypertriglyceridemia, and hepatic transaminitis among a constellation of other symptoms. Typically seen with familial predisposition syndromes or varying alternative etiologies,1,2 secondary hyperinflammatory responses mimicking HLH-like toxicities occur in a subset of those receiving chimeric antigen receptor (CAR) T-cells.5,6 In such patients, cytokine profiles and clinical manifestations resemble secondary HLH/macrophage activation syndrome, however clearly identifying CAR T-cell associated HLH6,7 (carHLH) as a cytokine release syndrome (CRS) variant has remained a challenge due to overlapping clinical features and limited systematic profiling of carHLH.6-8
CRS is a systemic inflammatory process seen with CAR T-cell expansion occurring in the majority of responders.6,9,10 Several recent studies shed light on factors affecting clinical outcome following CAR T cells7,10-12 and provide insight into how the complex interplay between patient, disease, and the infusion product contribute to response, CAR T-cell persistence, CRS severity, and neurotoxicity.13-15 Factors specifically predisposing to carHLH have yet to be identified. Experience suggests carHLH can be associated with life-threatening or potentially fatal complications, and optimal treatment of carHLH toxicities may differ from approaches used for severe CRS.5,6,16-18 Therefore, characterization of carHLH toxicities and risk factors thereof is needed to provide insight into the natural course of carHLH and help guide management strategies to optimize outcomes, above and beyond those used for conventional CRS.
With the largest experience to date using CD22/4-1BB CAR T cells for patients with relapsed/refractory B-cell acute lymphoblastic leukemia/lymphoblastic lymphoma (B-ALL/LBL), we recently reported on our experience treating subjects with this construct, where a substantial proportion of patients developed carHLH.16 With a goal of comprehensively characterizing manifestations of carHLH, we demonstrate that patient and CAR T-cell specific factors align with known HLH pathophysiology, predisposing patients to carHLH, thereby elucidating potentially relevant biologic pathways. Importantly, by virtue of our experience with CD22 CAR T cells, we provide a comprehensive analysis of carHLH as a CRS variant, insights from which may be broadly applicable to CAR T-cell constructs.
Methods
We retrospectively analyzed patient and CAR T-cell product characteristics based on subjects who enrolled on a phase 1 trial testing CD22 CAR T cells in patients with relapsed/refractory CD22+ leukemia or lymphoma (Clinicaltrials.gov NCT02315612). The results from the first 58 subjects treated were recently reported.16 The primary objectives were to characterize and identify risk factors of carHLH. Manifestations of carHLH among patients enrolled in 1 of 2 CD19 CAR T-cell trials utilizing either the 4-1BB costimulatory domain (NCT02028455)19,20 or a CD28ζ costimulatory domain (NCT01593696)21 were analyzed separately.
Subjects and CD22 CAR T-cell products
All subjects provided written informed consent or parental permission with minor assent obtained when appropriate. All patients were treated in the Pediatric Oncology Branch, National Cancer Institute, and the protocol was approved by the National Cancer Institute Institutional Review Board and the National Institutes of Health (NIH) Recombinant DNA Advisory Committee. CAR T-cell product manufacturing has been previously described.16
Toxicity evaluations
CRS was prospectively graded using the Lee scale9 and reconciled with the American Society for Transplantation and Cellular Therapy (ASTCT) CRS consensus grading, the latter of which is reported on. CarHLH was retrospectively identified based on a constellation of laboratory parameters and clinical manifestations. Patients needed to have evidence of CRS and a peak ferritin ≥100 000 µg/L with at least 2 of the following criteria: (1) hepatic transaminases or bilirubin ≥grade 3, (2) creatinine ≥grade 3, (3) pulmonary manifestations ≥grade 3 (eg, edema, or hypoxia), (4) evidence of hemophagocytosis on bone marrow aspirate/biopsy, and/or (5) coagulopathy (Figure 1A). Onset time point was retrospectively identified when at ≥1 additional criterion was met. HLH-2004 criteria22 were unable to be applied, as baseline characteristics in this refractory population fulfilled the majority of criteria (eg, cytopenias, fevers, splenomegaly) preinfusion.
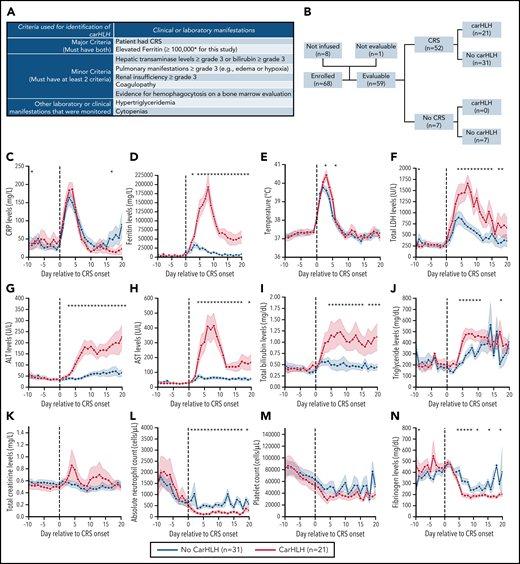
Clinical characteristics of CarHLH in patients receiving CD22 CAR T cells. (A) Criteria used for identification of carHLH on this study. (B) Schematic of immune-associated toxicities of CD22 CAR T cells stratified by CRS and subsequent development of carHLH. Among 68 enrolled subjects, 8 were not infused and 1 subject (subject 20) was deemed unevaluable for CAR toxicity due to the necessity to treat with high-dose chemotherapy due to rapid leukemia progression prior to CAR T-cell expansion and thus was not included in subsequent analysis. A total of 59 subjects were evaluable for CAR toxicity evaluation. Subsequent figures all show laboratory values and clinical parameters in relationship to CRS onset, indicated by time point = 0 and stratified by carHLH (red) to no carHLH (blue). Data are restricted to only patients who had CRS. Values which were blank or otherwise uninterpretable (eg, “hemolyzed,” “lipemic”) were excluded. Dots indicate the aggregated mean for each time point, and the error bands show the estimated 68% confidence interval. Dashed line indicates the date of CRS onset. Asterisks denote P < .05 by Mann-Whitney U test. (C) C-reactive protein; statistics for each time point are found in supplemental Table 1C. (D) Ferritin; statistics for each time point are found in supplemental Table 1D. (E) Temperature; statistics for each time point are found in supplemental Table 1E. Daily max temperature (Tmax) was obtained for each patient on each day relative to CRS onset and aggregated for the figure and statistical analysis, stratified by carHLH status. (F) Total lactate dehydrogenase (LDH); statistics for each time point are found in supplemental Table 1F. (G) Alanine aminotransferase (ALT); statistics for each time point are found in supplemental Table 1G. (H) Aspartate aminotransferase (AST); statistics for each time point are found in supplemental Table 1D. (I) Bilirubin (total); statistics for each time point are found in supplemental Table 1I. (J) Triglycerides; statistics for each time point are found in supplemental Table 1J. (K) Creatinine; statistics for each time point are found in supplemental Table 1K. (L) Absolute neutrophil count; statistics for each time point are found in supplemental Table 1L. (M) Platelet count; statistics for each time point are found in supplemental Table 1M. Daily minimum platelet count was obtained for each patient on each day relative to CRS onset and aggregated for the figure and statistical analysis, stratified by carHLH status. (N) Fibrinogen; statistics for each time point are found in supplemental Table 1N.
Clinical characteristics of CarHLH in patients receiving CD22 CAR T cells. (A) Criteria used for identification of carHLH on this study. (B) Schematic of immune-associated toxicities of CD22 CAR T cells stratified by CRS and subsequent development of carHLH. Among 68 enrolled subjects, 8 were not infused and 1 subject (subject 20) was deemed unevaluable for CAR toxicity due to the necessity to treat with high-dose chemotherapy due to rapid leukemia progression prior to CAR T-cell expansion and thus was not included in subsequent analysis. A total of 59 subjects were evaluable for CAR toxicity evaluation. Subsequent figures all show laboratory values and clinical parameters in relationship to CRS onset, indicated by time point = 0 and stratified by carHLH (red) to no carHLH (blue). Data are restricted to only patients who had CRS. Values which were blank or otherwise uninterpretable (eg, “hemolyzed,” “lipemic”) were excluded. Dots indicate the aggregated mean for each time point, and the error bands show the estimated 68% confidence interval. Dashed line indicates the date of CRS onset. Asterisks denote P < .05 by Mann-Whitney U test. (C) C-reactive protein; statistics for each time point are found in supplemental Table 1C. (D) Ferritin; statistics for each time point are found in supplemental Table 1D. (E) Temperature; statistics for each time point are found in supplemental Table 1E. Daily max temperature (Tmax) was obtained for each patient on each day relative to CRS onset and aggregated for the figure and statistical analysis, stratified by carHLH status. (F) Total lactate dehydrogenase (LDH); statistics for each time point are found in supplemental Table 1F. (G) Alanine aminotransferase (ALT); statistics for each time point are found in supplemental Table 1G. (H) Aspartate aminotransferase (AST); statistics for each time point are found in supplemental Table 1D. (I) Bilirubin (total); statistics for each time point are found in supplemental Table 1I. (J) Triglycerides; statistics for each time point are found in supplemental Table 1J. (K) Creatinine; statistics for each time point are found in supplemental Table 1K. (L) Absolute neutrophil count; statistics for each time point are found in supplemental Table 1L. (M) Platelet count; statistics for each time point are found in supplemental Table 1M. Daily minimum platelet count was obtained for each patient on each day relative to CRS onset and aggregated for the figure and statistical analysis, stratified by carHLH status. (N) Fibrinogen; statistics for each time point are found in supplemental Table 1N.
Correlative studies
Correlative studies included serial cytokine profiling, lymphocyte phenotyping of T-, B- and NK cells in the peripheral blood (PB) and bone marrow (BM) and evaluation of CAR T-cell expansion, NK cell immunophenotyping, and functional analysis. Serial profiling of PB lymphocyte phenotyping was routinely performed at established time points pre- and post-CAR T-cell infusion. CAR T-cell expansion was routinely assessed using flow cytometric-based detection at the first restaging BM (at day 28 ± 4 days postinfusion) and approximately weekly in PB. Serial monocyte levels were assessed during routine collection of complete blood counts.
RNA sequencing
Total RNA was isolated from 44 frozen CAR T-cell samples using miRNeasy Mini Kit (QIAGEN) according to the manufacturer’s instructions, and integrity was verified with an Aglient TapeStation (RIN). Next, 500ng of total RNA was used to prepare libraries for sequencing using the TruSeq Stranded Total RNA Library Prep Kit (Illumina). High-throughput sequencing and FASTQ files acquisition were finished on an Illumina Nextseq 500 platform.
Statistical analysis
Descriptive statistics were computed to summarize subject and disease characteristics. Factors which were reported as a continuous parameter or which could be essentially considered as if continuous were compared between 2 groups using a Mann-Whitney U test. Ordered categorical parameters were compared between 2 groups using a Cochran-Armitage test for trend.23 Dichotomous parameters were compared between 2 groups using Fisher’s exact test. Two-sided tests were performed for all analyses where applicable. Adjustment of multiple hypothesis testing (false discovery rate [FDR] correction) was considered for analysis of significantly elevated cytokine levels (n = 15). Custom python scripts were used to generate aggregated heatmaps. All heatmaps were normalized by row and color bar minimum and maximum values were fixed.
Logistic regression model generation and validation
Clinical, laboratory, and toxicity parameters for the evaluable patient cohort (n = 59) evaluable for toxicity comprised the discovery cohort from which predictive models were generated. Patients were excluded per data availability of parameters for each particular model.
Code availability
A reproducible workflow to generate cytokine profiles and differential expression analysis is available on GitHub (https://github.com/ruppinlab/car22-hlh).
Full methods are available in the supplemental Appendix (available on the Blood Web site).
Results
Timing and clinical characteristics of carHLH with CD22 CAR T cells
Among 60 patients, 59 were evaluable for toxicity and reported here. One was unevaluable due to rapid disease progression necessitating induction chemotherapy prior to CAR T-cell expansion. Patient demographics and response were recently reported16 with additional updates in the supplemental Appendix. CRS occurred in 52 of 59 subjects (88.1%). CarHLH manifestations occurred in 21 of 59 (35.6%) subjects, all of whom developed CRS first. Accordingly, 21 of 52 (40.4%) with CRS had carHLH (Figure 1B).
Severe CRS (grade 3 or 4) occurred in 12 patients, of whom 6 (50%) had carHLH. Among patients with CRS, prior therapy (including prior HSCT, preapheresis, or prelymphodepleting [LD] bridging chemotherapies, or alternate immunotherapy (eg, blinatumomab, inotuzumab or prior CD19 CAR), disease burden or response were similar in those with carHLH and without carHLH (Table 1; supplemental Appendix).
CD22 CAR T-cell subject characteristics and clinical outcomes stratified by carHLG toxicity
| No car HLG | Car HLG | P | |
|---|---|---|---|
| Patients with toxicity (among those with CRS*), overall, n (%) | 31/52 (59.6%) | 21/52 (40.4%) | NS |
| Subject characteristics | 17 (4-30) | 13 (4-30) | NS |
| Age (y) median (range) | 12/31 (38.7) | 6/21 (28.6) | NS |
| Female, n (%) | 23/31 (74.2) | 13/21 (61.9) | NS |
| Prior treatments | |||
| Patients with prior HSCT, n (%) | 23/31 (74.2) | 13/21 (61.9) | NS |
| Patients with prior blinatumomab, n (%) | 15/31 (48.3) | 11/21 (52.4) | NS |
| Patients with prior inotuzumab, n (%) | 6/31 (19.4) | 7/21 (33.3) | NS |
| Patients with prior CAR, n (%) | 20/31 (64.5) | 11/21 (52.4) | NS |
| Disease burden | |||
| Pre-CAR baseline disease burden, median (IQR) | 50 (18.9-90) | 71.4 (40.8-88.5) | NS |
| Extramedullary disease, n (%) | 5.31 (16.1) | 5/21 (28.3) | NS |
| Toxicity outcomes | |||
| Time to CRS onset, days postinfusion, median (range) | 8 (3-13) | 7.5 (3-13) | NS |
| CRS duration, d, median (range) | 6 (4-12) | 5.5 (2-13) | NS |
| Time to carHLG onset, d, median (range) | — | 14 (7-26) | — |
| Time from CRS onset to carHLG onset, d, median (range) | — | 6 (2-17) | — |
| Max grade CRS* | |||
| Grade 1/2 (%)* | 25/31 (80.6) | 15/21 (71.4) | — |
| Grade 3/4 (%) | 6/31 (19.3) | 6/21 (28.6) | — |
| Tocilizumab utilization (%) | 7/31 (25.8) | 17/21 (81.0) | <.0001 |
| Clinical outcomes† | |||
| Objective response (MRD/CR, CR, PR), n (%) | 24/30 (80.0) | 19.21 (90.5) | NS |
BM, bone marrow; CR, complete remission; IQR, interquartile range; MRD, minimal residual disease; NS, not significant; PB, peripheral blood; PR, partial response. P values determined using Fisher’s exact and Mann-Whitney U tests for categorical and continuous variables, respectively, except max grade CRS, which used a χ-square test.
CRS (cytokine release syndrome) was defined by ASTCT criteria.
One patient was not evaluable (subject 24) due to grade 5 capillary leak syndrome on day +9 postinfusion prior to disease restaging.
The median time to CRS onset was 8 days postinfusion (range 3-13). Median time to carHLH onset was 14 days postinfusion (range: 7-25), lagging behind CRS onset. Restricted to subjects with CRS (n = 52), baseline (day 0) ferritin and C-reactive protein (CRP), along with peak CRP, (Figure 1C) did not differ between those with and without carHLH. In contrast, peak ferritin was strikingly higher (218 680 [IQR 168 672-384 565] vs 28 561 [IQR 4108-56 583] µg/L, P < .0001) (Figure 1D).
Patients with carHLH had more pronounced hepatic transaminitis, hyperbilirubinemia, hypofibrinogenemia, hypertriglyceridemia, LDH elevation, and neutropenia (Figure 1E-N; supplemental Table 1) compared with those without carHLH. These differences were less apparent between high- and low-grade CRS (supplemental Figure 1; supplemental Table 2). Few differences were seen in creatinine, sodium, and albumin or peak temperature between the 2 groups. Although platelet count and hemoglobin did not differ, this was confounded by transfusion dependence, and carHLH patients required higher platelet and packed red blood cell transfusions than non-carHLH patients (supplemental Figure 2). Twelve of 57 (21.1%) patients with a post-CAR T-cell BM evaluation had evidence of hemophagocytosis, of whom 9 met criteria for carHLH.
Treatment of carHLH incorporated anakinra and/or corticosteroids when more severe manifestations were present. Complications included prolonged immunosuppression, extension of ICU admissions, and/or complications of coinfection, including 1 fatal bacterial sepsis (Table 2). In 11 (52.4%) patients with carHLH, signs and symptoms of CRS were resolving or fully resolved when carHLH manifested. Three representative patient profiles illustrating the spectrum of mild to more severe cases of carHLH are shown in Figure 2.
Manifestations of carHLH, treatment approach and reasons for initiation of therapy
| Minor criteria* | n | Pt | Peak CRS Gr | Day of CRS onset | Toci use (d) | Day of carHLH onset | CarHLH manifestations meeting definition | Pertinent labs (peak values) | Additional findings | Steroid utilization (duration, d)† | Anakinra for carHLH (duration, d) | Indication for initiation of carHLH therapy | ICU Utilization (duration, d) | Outcome |
|---|---|---|---|---|---|---|---|---|---|---|---|---|---|---|
| 2 | 7 | 1 | 1 | 8 | No | 25 | Hepatic transaminitis, coagulopathy | AST = 320 ALT = 304 T. bili = 0.7 Ferritin = 124 200 | — | — | — | — | — | Full resolution without intervention |
| 2 | 3 | 8 | Yes (10) | 14 | Hepatic transaminitis, coagulopathy | AST = 263 ALT = 100 T. bili = 0.7 Ferritin = 194 210 | — | Steroids* (1 d) | – | — | ICU for hypotension & tachycardia associated with CRS (3 d) | Full resolution without intervention. (*Steroids given for 24 h specifically for neurotoxicity associated with CRS) | ||
| 3 | 2 | 10 | No | 17 | Hepatic transaminitis, coagulopathy | AST = 382 ALT = 190 T. bili = 0.6 Ferritin = 232 350 | Persistent fevers, new onset cytopenias | Steroids‡ (2 d) | — | Persistent/worsening signs of inflammatory response | ICU for hypotension associated with CRS (2 d) | Full resolution with treatment | ||
| 4 | 1 | 10 | Yes (15) | 16 | Hepatic transaminitis, hyperbilirubinemia, coagulopathy | AST = 358 ALT = 545 T. bili = 4.2 Ferritin = 422 950 | Fever, hypertension | Steroids‡ (5 d) | — | Persistent/worsening signs of inflammatory response | — | Full resolution with treatment | ||
| 5 | 2 | 8 | No | 12 | Hepatic transaminitis, coagulopathy | AST = 390 ALT = 57 T. bili = 1.3 Ferritin = 194 800 | Acute kidney injury (grade 1) | — | — | — | — | Full resolution without intervention | ||
| 6 | 3 | 9 | Yes (11) | 14 | Hepatic transaminitis, hyperbilirubinemi, hemophagocytosis | AST = 477 ALT = 200 T. bili = 1.9 Ferritin = 174 890 | — | — | Anakinra (17 d) | Persistent/worsening signs of inflammatory response | ICU for monitoring with new decrease in EF prior to CRS (5 d) | Full resolution with treatment | ||
| 7 | 2 | 7 | Yes (8) | 10 | Hepatic transaminitis, coagulopathy | AST = 1464 ALT = 448 T. bili = 0.7 Ferritin = 349 750 | coinfection at CRS onset with b. cereus† | Steroids‡ (49 d) | Anakinra (35 d) | Persistent/worsening signs of inflammatory response | Transferred to ICU for CNS hemorrhage (>1 mo) | CNS hemorrhage (grade 4); carHLH resolving | ||
| 3 | 9 | 8 | 2 | 7 | No | 9 | Hepatic transaminitis, coagulopathy, hemophagocytosis | AST = 503 ALT = 251 T. bili = 0.7 Ferritin = 154 700 | — | — | — | — | ICU for hypotension & hypoxia associated with CRS (2 d) | Full resolution without intervention |
| 9 | 2 | 7 | Yes (10) | 10 | Hepatic transaminitis, hyperbilirubinemia, coagulopathy, hypoxia | AST = 762 ALT = 259 T. bili = 3.4 Ferritin = 430 340 | — | Steroids‡ (1 d) | — | — | ICU for fever, tachycardia and hypotension associated with CRS (4 d) | Full resolution with treatment, proceeded to HSCT | ||
| 10 | 3 | 4 | Yes (6) | 7 | Hepatic transaminitis, coagulopathy, hypoxia | AST = 1483 ALT = 634 T. bili = 0.6 Ferritin = 303 790 | Hypertension | Steroids‡ (31 d) | — | Persistent/worsening signs of inflammatory response | ICU for hypotension & hypoxia associated with CRS (8 d) | Full resolution with treatment | ||
| 11 | 1 | 6 | Yes (9) | 10 | Hepatic transaminitis, coagulopathy, hemophagocytosis | AST = 660 ALT = 1670 T. bili = 1.1 Ferritin = 187 280 | — | Steroids (8 d)† | Anakinra (24 d)§ | Persistent/worsening signs of inflammatory response | — | Full resolution with treatment | ||
| 12 | 2 | 7 | Yes (11) | 18 | Hepatic transaminitis, coagulopathy, hemophagocytosis | AST = 631 ALT = 759 T. bili = 1.4 Ferritin = 208 020 | Hypertension | Steroids (7 d) | — | Persistent/worsening signs of inflammatory response | — | Full resolution with treatment | ||
| 13 | 3 | 5 | Yes (7) | 11 | Hypoxia, hyperbilirubinemia, hemophagocytosis | AST = 64 ALT = 64 T. bili = 2.6 Ferritin = 218 680 | Had concurrent progressive CD22 neg disease | Steroids (>25 d) | — | Persistent/worsening signs of inflammatory response | ICU for hypotension & hypoxia associated with CRS (8 d) | Full resolution with treatment, received interim anti-leukemia therapy and went to HSCT | ||
| 14 | 3 | 5 | Yes (5) | 9 | Hepatic transaminitis, hyperbilirubinemia coagulopathy, renal insufficiency | AST = 846 ALT = 184 T. bili = 6.6 Ferritin = 271 600 | Fevers | Steroids‡ (>2 mo) | Anakinra (prolonged >1 mo) | Persistent/worsening signs of inflammatory response | ICU for hypotension associated with CRS, developed renal insufficiency (14 d) | Full resolution with treatment, proceeded to HSCT | ||
| 15 | 2 | 5 | Yes (18) | 18 | Hepatic transaminitis, coagulopathy, hemophagocytosis | AST = 1336 ALT = 557 T. bili = 0.9 Ferritin = 565 510 | Fevers | Steroids‡ (41 d) | Anakinra (prolonged >1 mo) | Persistent/worsening signs of inflammatory response | ICU for persistent fever & tachycardia associated with CRS (3 d) | Full resolution with treatment; proceeded to HSCT | ||
| 16 | 2 | 5 | Yes (10) | 14 | Hepatic transaminitis, hypoxia, coagulopathy | AST = 568 ALT = 290 T. bili = 0.7 Ferritin ≥100 000 | Hypertension | Steroids‡ (43 d) | Anakinra (∼1 mo) | Persistent/worsening signs of inflammatory response | — | Full resolution with treatment; proceeded to HSCT | ||
| 4 | 4 | 17 | 3 | 9 | Yes (11) | 22 | Hepatic transaminitis, hyperbilirubinemia coagulopathy, renal insufficiency, hypoxia | AST = 1096 ALT = 109 T. bili = 7.0 Ferritin = 590 100 | Developed gram-negative sepsis following carHLH onset, leading to multiorgan failure, new onset cytopenias, fever | Steroids (21 d) | — | Multi-organ failure with concurrent bacteremia | ICU for hypotension with CRS (2 d); subesquent ICU transfer for multiorgan failure due to concurrent sepsis (21 d) | Died of complication of sepsis (carHLH resolving) |
| 18 | 2 | 7 | Yes (11) | 14 | Hepatic transaminitis, coagulopathy, hypoxia, hemophagocytosis | AST = 1293 ALT = 428 T. Bili = 0.7 Ferritin = 162 454 | + concerns for CAR neurotoxicity | Steroids‡ (5 d) | — | Persistent/worsening signs of inflammatory response | ICU for mental status changes associated with CRS (4 d) | Full resolution with treatment; proceeded to HSCT | ||
| 19|| | 2 | 7 | Yes (9) | 15 | Hyperbilirubinemia, hypoxia, hemophagocytosis, coagulopathy | AST = 215 ALT = 231 T. Bili = 3.7 Ferritin = 881 29 | — | Steroids‡ (9 d) | Anakinra (11 d) | Persistent/worsening signs of inflammatory response | — | Full resolution with treatment; proceeded to HSCT | ||
| 20 | 2 | 8 | Yes (12) | 15 | Hepatic transaminitis, hyperbilirubinemia, hypoxia, hemophagocytosis, coagulopathy | AST = 806 ALT = 313 T. bili = 3.5 Ferritin = 319 290 | — | Steroids‡ (15 d) | Anakinra (9 d) | Persistent/worsening signs of inflammatory response | ICU for hypertension (4 d) | Full resolution with treatment | ||
| 5 | 1 | 21 | 1 | 6 | Yes (9) | 12 | Hepatic transaminitis, coagulopathy, pulmonary manifestations, renal insufficiency | AST = 406 ALT = 188 T. bili = 3.8 Ferritin = 419 380 | Hypertension, respiratory distress, pulmonary infiltrates on radiologic evaluations with oxygen requirement. | Steroids‡ (prolonged ≥3 mo) | Anakinra (prolonged >1 mo) | Persistent/worsening signs of inflammatory response | ICU for hypertension requiring nicardipine drip, respiratory distress requiring BiPAP (27 d) | Full resolution with treatment (protracted course) |
ALT, alanine aminotransferase (U/L); AST, aspartate aminotransferase (U/L); Gr, grade; CRS, cytokine release syndrome (graded as per ASTCT consensus criteria); ferritin reported as µg/L; T.bili, total bilirubin (mg/dL).
Minor criteria include: hepatic transaminase levels ≥grade 3 or bilirubin ≥grade 3, pulmonary manifestations ≥grade 3 (eg, edema or hypoxia), Renal insufficiency ≥grade 3, coagulopathy, evidence for hemophagocytosis on a bone marrow evaluation.
Treatment does not distinguish when steroid utilization was for typical CRS alone or initiated only for CarHLH, given that carHLH is an extension of CRS, therefore accounting for a discrepancy between our prior publication in Shah et al16; however, among those with steroid utilization the majority received only short course steroids, and anakinra was initiated specifically for treatment of evolution of carHLH symptomatology in 7 patients.
Steroids initiated for treatment of CRS.
Received anakinra alone for carHLH at a later time point.
Subject was given anakinra to prevent further deterioration of clinical status in context of clinical picture consistent with carHLH, prior to ferritin reaching 100 000 ug/(preemptive). However, due to otherwise indistinguishable clinical appearance prior to intervention and up-trending ferritin at time of anakinra administration, patient was classified as carHLH positive for purposes of all analyses.
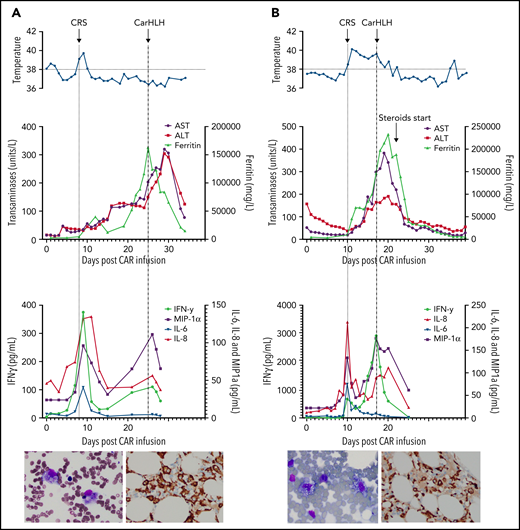
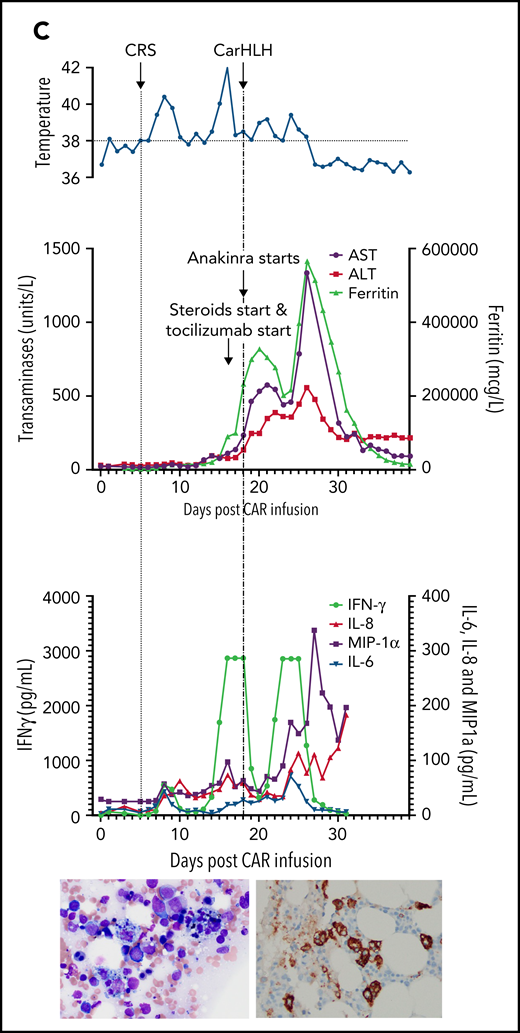
Representative series of carHLH manifestations in select patients. (A) Subject develops grade 1 CRS on day +8 following CD22 CAR T-cell infusion and was treated with supportive care only, without pharmaceutical intervention. Despite full resolution of manifestations at the time, he progresses to develop hyperferritinemia and transaminitis, corresponding with carHLH, but was otherwise systemically well without evidence for fever/hypotension. Cytokine profiling reveals a secondary peak of IFNγ, MIP-1α, and IL-8, but IL-6 remains low. Bone marrow at restaging demonstrates an MRD− complete remission with evidence for increased macrophages without hemophagocytosis. Left image: modified Giemsa stain (50 ×/10, oil lens) of bone marrow aspirate shows increased macrophages. Right image: CD163 immunohistochemical staining of bone marrow core biopsy (brown) highlights increased macrophages, some containing hemosiderin; no hemophagocytosis present (counterstained with hematoxylin). (B) Subject develops CRS on day +10 following CAR T-cell infusion, reaches max CRS grade 2. CRS manifestations (fevers) were resolving without intervention of tocilizumab or steroids, and corresponding cytokine profiling reveals rise and fall in all 4 cytokines that are profiled. In the context of CRS, carHLH symptoms start to manifest. Ferritin progressively increases followed by transaminitis prompting brief steroid utilization (<48 hours), leading to resolution of manifestations (some of which were already declining), however was given in the context of worsening cytopenias (not shown). Again, a secondary peak of select cytokines, including IFNγ, MIP-1α, and IL-8 is seen, but IL-6 remains low. Bone marrow at restaging demonstrates an MRD-negative complete remission with evidence for increased macrophages without hemophagocytosis. Modified Giemsa stain (50 ×/10, oil lens) of bone marrow aspirate shows 2 macrophages, of which 1 contains hemosiderin pigment (left); CD163 immunohistochemical staining of bone marrow core biopsy (brown) highlights increased macrophages in a hypocellular marrow. No hemophagocytosis present (counterstained with hematoxylin). (C) Subject develops CRS on day +5 and has several days of fever and an initial rise in cytokines (max CRS grade 2) with resolution. However, 48 hours later there is a recrudescence of fevers and with ongoing and higher fevers, tocilizumab and subsequently steroids are administered. In this more complicated patient, fever is ongoing with the onset of carHLH, showing an example where manifestations clearly overlap. However, elevations in ferritin mirror elevations in IFNγ (samples upper limit was 2860 pg/mL, and diluted levels were substantially higher). Bone marrow at restaging demonstrates a very hypocellular marrow with an MRD− complete remission with evidence for active hemophagocytosis (which resolved on a subsequent evaluation). Left image: modified Giemsa stain (50 ×/10, oil lens) of bone marrow aspirate shows hemophagocytic macrophages; right image: CD163 immunohistochemical staining of bone marrow core biopsy (brown) highlights increased macrophages with hemophagocytosis (counterstained with hematoxylin).
Representative series of carHLH manifestations in select patients. (A) Subject develops grade 1 CRS on day +8 following CD22 CAR T-cell infusion and was treated with supportive care only, without pharmaceutical intervention. Despite full resolution of manifestations at the time, he progresses to develop hyperferritinemia and transaminitis, corresponding with carHLH, but was otherwise systemically well without evidence for fever/hypotension. Cytokine profiling reveals a secondary peak of IFNγ, MIP-1α, and IL-8, but IL-6 remains low. Bone marrow at restaging demonstrates an MRD− complete remission with evidence for increased macrophages without hemophagocytosis. Left image: modified Giemsa stain (50 ×/10, oil lens) of bone marrow aspirate shows increased macrophages. Right image: CD163 immunohistochemical staining of bone marrow core biopsy (brown) highlights increased macrophages, some containing hemosiderin; no hemophagocytosis present (counterstained with hematoxylin). (B) Subject develops CRS on day +10 following CAR T-cell infusion, reaches max CRS grade 2. CRS manifestations (fevers) were resolving without intervention of tocilizumab or steroids, and corresponding cytokine profiling reveals rise and fall in all 4 cytokines that are profiled. In the context of CRS, carHLH symptoms start to manifest. Ferritin progressively increases followed by transaminitis prompting brief steroid utilization (<48 hours), leading to resolution of manifestations (some of which were already declining), however was given in the context of worsening cytopenias (not shown). Again, a secondary peak of select cytokines, including IFNγ, MIP-1α, and IL-8 is seen, but IL-6 remains low. Bone marrow at restaging demonstrates an MRD-negative complete remission with evidence for increased macrophages without hemophagocytosis. Modified Giemsa stain (50 ×/10, oil lens) of bone marrow aspirate shows 2 macrophages, of which 1 contains hemosiderin pigment (left); CD163 immunohistochemical staining of bone marrow core biopsy (brown) highlights increased macrophages in a hypocellular marrow. No hemophagocytosis present (counterstained with hematoxylin). (C) Subject develops CRS on day +5 and has several days of fever and an initial rise in cytokines (max CRS grade 2) with resolution. However, 48 hours later there is a recrudescence of fevers and with ongoing and higher fevers, tocilizumab and subsequently steroids are administered. In this more complicated patient, fever is ongoing with the onset of carHLH, showing an example where manifestations clearly overlap. However, elevations in ferritin mirror elevations in IFNγ (samples upper limit was 2860 pg/mL, and diluted levels were substantially higher). Bone marrow at restaging demonstrates a very hypocellular marrow with an MRD− complete remission with evidence for active hemophagocytosis (which resolved on a subsequent evaluation). Left image: modified Giemsa stain (50 ×/10, oil lens) of bone marrow aspirate shows hemophagocytic macrophages; right image: CD163 immunohistochemical staining of bone marrow core biopsy (brown) highlights increased macrophages with hemophagocytosis (counterstained with hematoxylin).
Timing and clinical characteristics of carHLH with CD19 CAR T cells
To explore carHLH incidence with CD19 CAR T cells, we analyzed the clinical courses of 2 cohorts of comparable patients with relapsed/refractory ALL who received 1 of 2 different CD19 CAR T-cell constructs, including either a 4-1BB (NCT02028455) or a 28ζ costimulatory domain (NCT01593696) (supplemental Appendix). Overall, fewer patients had any HLH-like manifestations following CD19 CAR treatment (11 of 78 (14.1%) on the CD19/BBζ trial and 0/50 (0%) on the CD19/28ζ), and only 1 patient met the criteria we set forth (supplemental Figure 3).
Cytokine profiling reveals temporally divergent patterns of key inflammatory cytokines between those with and without carHLH
Serial profiling of cytokines revealed unique patterns in patients with carHLH relative to both CRS onset and CAR infusion among patients receiving CD22 CAR T cells (Figure 3; supplemental Table 3; supplemental Figure 4). In those with carHLH, several cytokines linked to HLH, including interferon-γ (IFNγ) and IL-1β, peaked 2-4 days after CRS onset and remained persistently elevated compared with those without carHLH after adjustment for multiple testing. IL-6 was also differentially elevated after CRS onset in those with carHLH but confounded by administration of tocilizumab for CRS. When stratified by tocilizumab utilization, differences in IL-6 were less apparent (supplemental Figure 5A-D). Later time points revealed elevations of IL-18 and IL18 binding protein (IL18bp) (Figure 3L,O). Analysis of cytokines comparing patients with low-grade (grades 1-2) versus high-grade (grade 3-4) CRS did not reveal as stark or persistent differences (supplemental Figure 4). Multiple cytokines associated with HLH pathogenesis, such as IFNγ, IL-8, and MIP-1α (Figure 3A,L,H), reached higher peaks and remained persistently elevated in those with carHLH. In contrast, cytokine elevation in severe CRS had similarly higher peaks but were transient and rapidly declined, mirroring levels of those with low-grade CRS (supplemental Figure 4; supplemental Table 3).
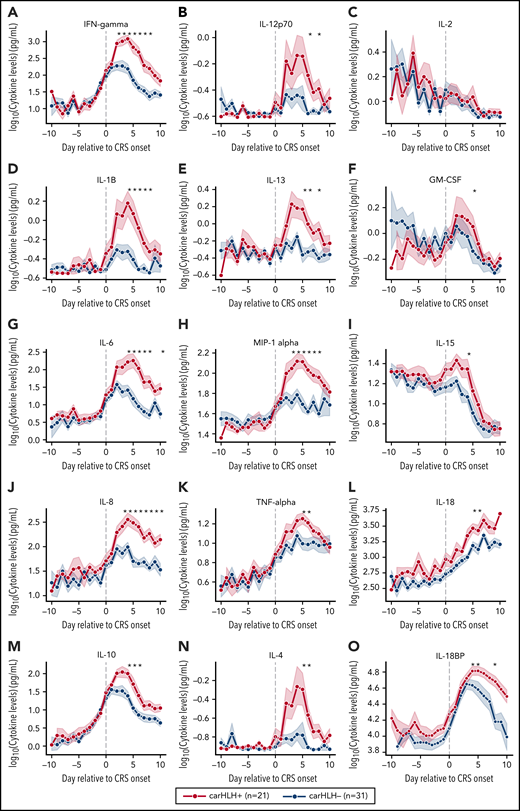
Serial cytokine profiling relative to CRS onset. Various cytokine values (log10 transformed) are shown in relationship to CRS onset, which is indicated by time point = 0, stratified by carHLH status. Dots indicate the aggregated mean, and the error bands show the estimated 68% confidence interval. Cytokines with higher expression in patients with carHLH (as indicated in red) after CRS onset include, IFNγ, IL-1β, IL-6, IL-8, IL-10, IL-12p70, IL-13, MIP-1α, IL-4, IL-15, and IL-18. Cytokines with considerable overlap in values between those with and without carHLH (as indicated in blue) include TNFα, IL-2, GM-CSF, and IL-18, which shows parallel increase in level over time. The maximum number of patients is n = 21 for carHLH+ and n = 31 for carHLH− but may vary at each time point (supplemental Tables 2-3). For IL18bp, the cohort consisted of n = 14 for carHLH+ and n = 9 for carHLH−. A Wilcox rank sum test was used to identify differential cytokine levels between carHLH+ and carHLH− patients for each time point. Cytokine level were considered significant only if they remained significant at .05 (indicated with an asterisk) after FDR adjustment across the number of cytokines (n = 15) tested for each time point. For IL-18, the manufacturer’s kit documentation lists reference range (healthy controls; n = 35) for normal human plasma to be 1778 pg/mL – 6428 pg/mL.
Serial cytokine profiling relative to CRS onset. Various cytokine values (log10 transformed) are shown in relationship to CRS onset, which is indicated by time point = 0, stratified by carHLH status. Dots indicate the aggregated mean, and the error bands show the estimated 68% confidence interval. Cytokines with higher expression in patients with carHLH (as indicated in red) after CRS onset include, IFNγ, IL-1β, IL-6, IL-8, IL-10, IL-12p70, IL-13, MIP-1α, IL-4, IL-15, and IL-18. Cytokines with considerable overlap in values between those with and without carHLH (as indicated in blue) include TNFα, IL-2, GM-CSF, and IL-18, which shows parallel increase in level over time. The maximum number of patients is n = 21 for carHLH+ and n = 31 for carHLH− but may vary at each time point (supplemental Tables 2-3). For IL18bp, the cohort consisted of n = 14 for carHLH+ and n = 9 for carHLH−. A Wilcox rank sum test was used to identify differential cytokine levels between carHLH+ and carHLH− patients for each time point. Cytokine level were considered significant only if they remained significant at .05 (indicated with an asterisk) after FDR adjustment across the number of cytokines (n = 15) tested for each time point. For IL-18, the manufacturer’s kit documentation lists reference range (healthy controls; n = 35) for normal human plasma to be 1778 pg/mL – 6428 pg/mL.
Soluble IL-2R (receptor/CD25) was only tested in 8 patients with carHLH at variable time points post-CAR T-cell infusion and uniformly showed an elevation from baseline (supplemental Figure 5E). However, given the limited sampling, it is unknown how these values differ from those without carHLH. Given the association with CXCL9 and CXCL10 with HLH and the IFNγ pathway,24,25 an exploratory pilot analysis in a small cohort of 10 patients with CRS (5 with and without carHLH each) revealed more substantial and persistent elevations of CXCL9 in all 5 patients with carHLH and highly-elevated CXCL10 levels in 2 patients with more severe carHLH complications (supplemental Figure 5G-I).
CarHLH is associated with higher relative T-cell expansion, NK cell lymphopenia, and monocytopenia along with higher CAR T-cell expansion and diminished contraction
Preinfusion BM showed no appreciable differences in percentages of T cells (T%) and NK cells (NK%) among total lymphocytes but relatively higher BM T:NK ratios in those who went on to develop carHLH (Figure 4A-C). Baseline BM disease burden (percent blasts of mononuclear cells) was similar (Figure 4D). At first restaging, CAR T cells were present at relatively higher proportions in the BM (Figure 4E), along with lower NK% (Figure 4F) and higher BM T:NK and CAR T:NK cell ratios (Figure 4G-H) among those with carHLH. We similarly saw a relatively higher peak expansion (expressed as a percentage of T cells that were CAR T-cell positive) and diminished contraction (Figure 4I) in the PB without differences in absolute CAR T-cell counts in those with carHLH (supplemental Figure 6).
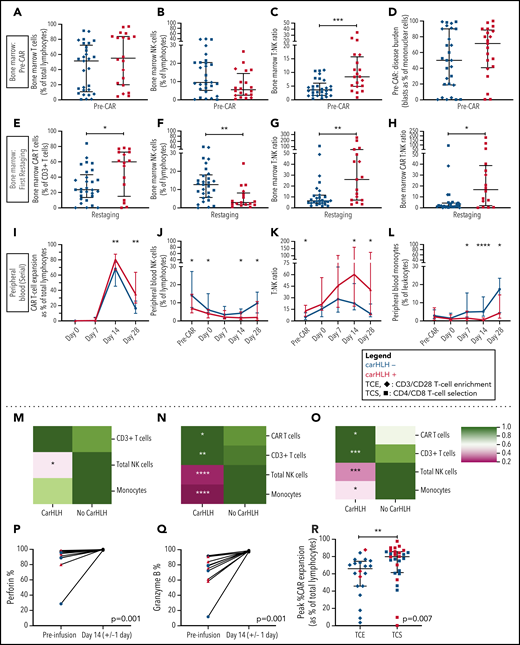
Serial lymphocyte phenotyping prior to and following CD22 CAR T-cell infusion in patients with vs without carHLH. (A) Bone marrow T-cell percentage (% of lymphocytes) prior to CAR infusion (pre-CAR) in those who would and would not go on to develop carHLH. Graph shows scatter plot of all values with lines at median and IQR. (B) Bone marrow NK cell percentage (% of lymphocytes) pre-CAR in those who would and would not go on to develop carHLH. Graph shows scatter plot of all values with lines at median and IQR. (C) Ratio of T:NK cells was calculated for subjects using pre-CAR infusion baseline bone marrow flow. A higher T:NK ratio was observed in subjects who would subsequently go on to develop carHLH. Graphs show scatter plot of all values with lines at median and IQR. (D) Pre-CAR disease burden in the bone marrow, reflecting bone marrow blasts as percent of marrow mononuclear cells by flow cytometry. There were no substantial differences seen between the 2 groups. (E) Bone marrow CAR T-cell (percent of CD3+ T cells) percentage at restaging in those with and without carHLH. Graph shows scatter plot of all values with lines at median and IQR. (F) Bone marrow NK cell percentage (percent of lymphocytes) at restaging in those with and without carHLH. Graph shows scatter plot of all values with lines at median and IQR. (G) Bone marrow T:NK cell ratio at restaging in those with and without carHLH. Graph shows scatter plot of all values with lines at median and IQR. (H) Bone marrow CAR T:NK cell ratio at restaging in those with and without carHLH. Graph shows scatter plot of all values with lines at median and IQR. (I) In carHLH patients, there is a relative predominance of CD22 CAR T cells in patients with carHLH at day 14 time point, which persists through day 28 time point. Line graphs are drawn through median value for each time point, with thin vertical lines denoting IQR. (J) In subjects with carHLH, NK cells comprise a smaller percentage of the cellular milieu at pre-CAR infusion baseline on the day of CAR infusion (day 0) as well as at the day 14 and day 28 time points. Patients with carHLH are characterized by an absence of NK cell reexpansion at the latter time point, compared with a marked reexpansion toward baseline levels in those without carHLH (supplemental Figure 4L). Line graphs are drawn through median value for each time point, with thin vertical lines denoting IQR. (K) A ratio of T:NK cells was calculated at all time points. Higher peripheral blood T:NK ratio was seen in carHLH patients at pre-CAR infusion baseline, day 14 (coinciding with median day of carHLH onset), and day 28 time points. A trend toward higher T:NK ratio was observed at the day 0 time point (P = .08). Line graphs are drawn through median value for each time point, with thin vertical lines denoting IQR. (L) In subjects with carHLH, monocytes comprise a smaller percentage of the cellular milieu from day 7 time point onwards, with most substantial differences corresponding to median carHLH onset. Line graphs are drawn through the median value for each time point, with thin vertical lines denoting IQR. (M-O) Heatmap representation of row-normalized mean frequencies of immune cell subsets between carHLH and non-carHLH groups at preinfusion (M), peak CAR expansion (N), and at day 28 (O) time points. Frequencies were analyzed using a Mann-Whitney U test. *P < .05, **P < .01, ***P < .001, ****P < .0001. (P) Paired flow cytometric analysis of perforin expression in peripheral blood at preinfusion and day 14 post-CAR T-cell infusion in patients with carHLH (n = 6) and those without carHLH (n = 5). No differences were observed in expression levels between the cohorts at either time point. (Q) Paired flow cytometric analysis of granzyme B expression in peripheral blood at preinfusion and day 14 post-CAR T-cell infusion in patients with carHLH (n = 6) and those without carHLH (n = 5). No differences were observed in expression levels between the cohorts at either time point. (R) Among those with CRS, peak CAR expansion as percentage of total lymphocyte population was higher in those who underwent CD4/CD8 T-cell selection (TCS) compared with those who underwent CD3/CD28 T-cell enrichment (TCE) during CAR manufacturing process. Color indicates carHLH status for a given datapoint. Graphs show scatter plot of all values with lines at median and IQR.
Serial lymphocyte phenotyping prior to and following CD22 CAR T-cell infusion in patients with vs without carHLH. (A) Bone marrow T-cell percentage (% of lymphocytes) prior to CAR infusion (pre-CAR) in those who would and would not go on to develop carHLH. Graph shows scatter plot of all values with lines at median and IQR. (B) Bone marrow NK cell percentage (% of lymphocytes) pre-CAR in those who would and would not go on to develop carHLH. Graph shows scatter plot of all values with lines at median and IQR. (C) Ratio of T:NK cells was calculated for subjects using pre-CAR infusion baseline bone marrow flow. A higher T:NK ratio was observed in subjects who would subsequently go on to develop carHLH. Graphs show scatter plot of all values with lines at median and IQR. (D) Pre-CAR disease burden in the bone marrow, reflecting bone marrow blasts as percent of marrow mononuclear cells by flow cytometry. There were no substantial differences seen between the 2 groups. (E) Bone marrow CAR T-cell (percent of CD3+ T cells) percentage at restaging in those with and without carHLH. Graph shows scatter plot of all values with lines at median and IQR. (F) Bone marrow NK cell percentage (percent of lymphocytes) at restaging in those with and without carHLH. Graph shows scatter plot of all values with lines at median and IQR. (G) Bone marrow T:NK cell ratio at restaging in those with and without carHLH. Graph shows scatter plot of all values with lines at median and IQR. (H) Bone marrow CAR T:NK cell ratio at restaging in those with and without carHLH. Graph shows scatter plot of all values with lines at median and IQR. (I) In carHLH patients, there is a relative predominance of CD22 CAR T cells in patients with carHLH at day 14 time point, which persists through day 28 time point. Line graphs are drawn through median value for each time point, with thin vertical lines denoting IQR. (J) In subjects with carHLH, NK cells comprise a smaller percentage of the cellular milieu at pre-CAR infusion baseline on the day of CAR infusion (day 0) as well as at the day 14 and day 28 time points. Patients with carHLH are characterized by an absence of NK cell reexpansion at the latter time point, compared with a marked reexpansion toward baseline levels in those without carHLH (supplemental Figure 4L). Line graphs are drawn through median value for each time point, with thin vertical lines denoting IQR. (K) A ratio of T:NK cells was calculated at all time points. Higher peripheral blood T:NK ratio was seen in carHLH patients at pre-CAR infusion baseline, day 14 (coinciding with median day of carHLH onset), and day 28 time points. A trend toward higher T:NK ratio was observed at the day 0 time point (P = .08). Line graphs are drawn through median value for each time point, with thin vertical lines denoting IQR. (L) In subjects with carHLH, monocytes comprise a smaller percentage of the cellular milieu from day 7 time point onwards, with most substantial differences corresponding to median carHLH onset. Line graphs are drawn through the median value for each time point, with thin vertical lines denoting IQR. (M-O) Heatmap representation of row-normalized mean frequencies of immune cell subsets between carHLH and non-carHLH groups at preinfusion (M), peak CAR expansion (N), and at day 28 (O) time points. Frequencies were analyzed using a Mann-Whitney U test. *P < .05, **P < .01, ***P < .001, ****P < .0001. (P) Paired flow cytometric analysis of perforin expression in peripheral blood at preinfusion and day 14 post-CAR T-cell infusion in patients with carHLH (n = 6) and those without carHLH (n = 5). No differences were observed in expression levels between the cohorts at either time point. (Q) Paired flow cytometric analysis of granzyme B expression in peripheral blood at preinfusion and day 14 post-CAR T-cell infusion in patients with carHLH (n = 6) and those without carHLH (n = 5). No differences were observed in expression levels between the cohorts at either time point. (R) Among those with CRS, peak CAR expansion as percentage of total lymphocyte population was higher in those who underwent CD4/CD8 T-cell selection (TCS) compared with those who underwent CD3/CD28 T-cell enrichment (TCE) during CAR manufacturing process. Color indicates carHLH status for a given datapoint. Graphs show scatter plot of all values with lines at median and IQR.
In the PB, relatively higher baseline CD3% and CD8% and relatively lower NK% (Figure 4J) were observed in those who went on to develop carHLH, manifesting as higher T:NK ratio (Figure 4K) without appreciable differences between those with or without CRS. CD4/CD8 ratio did not differ at any time points between those with vs without carHLH (data not shown), and CAR expansion was CD8 predominant (supplemental Figure 6). Relatively lower PB monocyte percentages were observed in those with carHLH, most notably at median day of carHLH onset (Figure 4L).
A relative NK cell lymphopenia was present preinfusion in patients who developed carHLH (Figure 4M) and became more profound in carHLH patients at peak CAR expansion (Figure 4N). NK cell lymphopenia remained at day 28 (Figure 4O), converging with the relative predominance of both CD8 and CAR T cells at days 14 and 28. Further NK cell subset analysis demonstrated a similar pattern across CD56 bright/dim subsets (supplemental Figure 7).
Functional NK studies reveal no difference in cytotoxicity between those with and without carHLH
NK cell functional studies, performed on a subset, revealed lower perforin and granzyme B expression at baseline than at peak CAR T-cell expansion, as would be expected following LD chemotherapy (Figure 4P-Q). However, at day 14 (median onset of carHLH and peak CAR expansion), defects in perforin or granzyme B expression, degranulation, or IFNγ production were not seen in either cohort (Figure 4; supplemental Figure 7).
Predicting carHLH: development and validation of logistic regression models
We previously reported that incorporation of CD4/CD8 T-cell selection (TCS) of the apheresis product improved transduction efficiency, fold expansion, and CD3% consistency of the final CAR T-cell product in comparison with prior methodologies and associated with development of carHLH.16 With further analysis, we found that TCS also led to higher in vivo CAR T-cell expansion than in non-TCS patients (Figure 4R), potentially bridging the gap between impact of manufacturing and outcomes.
Comprehensive clinical characterization revealed T:NK cell ratio, tocilizumab use, and TCS of the apheresis product16 to be independently associated with risk of carHLH (Figure 5A). With a goal of developing a model predictive of carHLH, utilizing data readily available no later than day 7 following CAR infusion (the earliest day of carHLH onset) incorporating cytokine profiling, we generated a logistic regression model predictive of carHLH in those who experienced CRS, using BM T:NK ratio and IFNγ level on CRS day +2, respectively, in those who experienced CRS. Figure 5B-C summarize the model performance with a mean area under the curve (AUC of 0.86. An additional model is in the supplemental Appendix. Collectively, these models suggest a relationship between preexisting patient characteristics, cytokine elevations, and development of carHLH.
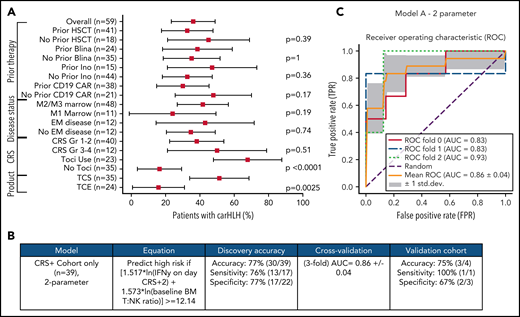
Development and validation of a logistic regression model to predict carHLH. (A) Fraction of carHLH according to patient demographics, disease characteristics, and treatment course. Squares represent the observed percentage with carHLH for a given factor, with the lines representing 95% confidence intervals for the difference of proportions from the reference category. (B) Logistic regression model for prediction of carHLH. (C) ROC curves for predictive model (incorporating IFNγ on day of CRS+2, and baseline BM T:NK ratio). The threefold cross validation mean AUC was 0.86. AUC values for each fold are indicated in the legend (n = 39). *Score rounded to 2 decimal places. **Limited cytokine data were available for validation cohort. disc, discovery cohort; N/A, not applicable (for patients to whom a model did not apply); ROC, receiver operating characteristic; TCS, T-cell selection during CAR product manufacturing; val, validation cohort.
Development and validation of a logistic regression model to predict carHLH. (A) Fraction of carHLH according to patient demographics, disease characteristics, and treatment course. Squares represent the observed percentage with carHLH for a given factor, with the lines representing 95% confidence intervals for the difference of proportions from the reference category. (B) Logistic regression model for prediction of carHLH. (C) ROC curves for predictive model (incorporating IFNγ on day of CRS+2, and baseline BM T:NK ratio). The threefold cross validation mean AUC was 0.86. AUC values for each fold are indicated in the legend (n = 39). *Score rounded to 2 decimal places. **Limited cytokine data were available for validation cohort. disc, discovery cohort; N/A, not applicable (for patients to whom a model did not apply); ROC, receiver operating characteristic; TCS, T-cell selection during CAR product manufacturing; val, validation cohort.
Transcriptional profiling of CAR T-cell infusion products reveals no differences in manufacturing protocols (TCS vs TCE) and toxicity profiles (carHLH+ vs carHLH−)
Given the association of TCS (supplemental Figure 8A) with carHLH (supplemental Figure 8B) and CAR T-cell expansion, we analyzed the CAR T-cell product to evaluate the potential impact of TCS on carHLH. For 33 patients (21 TCS, 12 T-cell enrichment [TCE]; 18 carHLH+, 15 carHLH−), we performed transcriptomic analysis of the bulk unstimulated CAR T-cell infusion product using RNA sequencing. Raw counts were normalized, batch-corrected, and scaled, and an unsupervised, generalized principal component analysis approach was used to cluster the patients based on their gene expression. We did not observe a distinct clustering of patients based on TCS and TCE or carHLH presence (supplemental Figure 8C). In addition, few differentially expressed genes were found between TCS/TCE and carHLH+/carHLH− (supplemental Figure 8D-E) above a significance threshold of P < 0.01 (no significant genes after FDR correction, supplemental Table 6). Conclusively, no major transcriptomic changes were found comparing manufacturing protocols or toxicity profiles of the bulk unstimulated infusion product, reflecting the general consistency of manufacturing.
Discussion
CD22 CAR T cells are emerging as an important treatment modality, particularly in patients with relapse or nonresponse to CD19 targeted therapies.16,26,27 On our trial with CD22 CAR T cells, we observed a relatively high incidence of carHLH.16 With limited information regarding the clinical presentation and incidence of carHLH and increasing recognition that this particular toxicity profile, as a CRS variant, may necessitate a different treatment approach, we sought to comprehensively characterize and analyze the clinical syndrome and inflammatory profiles associated with carHLH.
Our manuscript provides the most robust characterization of carHLH and the distinguishing features associated with this toxicity as a CRS variant, with clear clinical consequences. CarHLH was neither adequately identified by CRS grading alone nor directly aligned with CRS severity.10 Additionally, we demonstrate that late manifestations may occur, even when signs of conventional CRS appear to be resolving. This later onset of carHLH may potentially be explained by an ongoing inflammatory response emerging from CAR T-cell expansion/engraftment and not limited solely to IL6 elevation, the latter of which may be either transient or symptoms of which can be ameliorated with tocilizumab. This is consistent with both the underlying pathophysiology of HLH as a T-cell-mediated inflammatory process and established associations of key cytokines with HLH.
The culmination of our findings suggests that heightened CAR T-cell expansion with delayed T-cell contraction, in concert with NK cell lymphopenia, may account for the underlying pathophysiology predisposing select patients with CRS to develop this secondary hyperinflammatory response. Our findings are potentially aligned with the basic pathophysiology underlying primary and secondary HLH, where pathologic T-cell activation is unrestrained due to various factors which impair physiologic immune system inhibition.28 We postulate that the profound and persistent NK cell lymphopenia, which we observed throughout the entire study period in those with carHLH, contributed to insufficient curtailing of CAR T-cell expansion, with subsequent prolonged and higher CD3 and CAR T-cell proliferation and expansion in those with carHLH. Additionally, TCS of the apheresis product enhanced in vivo CAR T-cell expansion and may have further skewed the T-cell/NK cell ratio, providing a rationale for the increased risk of carHLH following this minor modification.
Indeed, a recent study from Carvelli et al identified transient NK cell alternations and NK cell lymphopenia associated with secondary HLH pathophysiology.29 However, while Carvelli, like us, shows low NK numbers at HLH onset, our data also identify lower NK cell numbers at the time of apheresis and a relative NK cell lymphopenia at CAR T-cell infusion (∼2 weeks prior to the development of carHLH) in those who subsequently develop carHLH, suggesting that this lack of NK cells may be a predisposing factor rather than solely a secondary effect of carHLH. As in secondary HLH, neither NK cell expression of perforin and granzyme nor degranulation was impaired in our patients with carHLH. However, such severe NK cell lymphopenia may have the same net effect in predisposing to carHLH as the defective NK cells found in primary HLH. Functional NK cells appear to have several roles in preventing HLH, one of which may include directly limiting hyperactivation of CD8 T cells.30,31 Disproportionately low absolute number of NK cells and/or pronounced NK cell lymphopenia relative to CD8 and CAR T cells may mean these critical roles are not fulfilled, predisposing patients to carHLH. Along these lines, a recent murine model of HLH demonstrated that deficient NK cell cytotoxicity resulted in increased T-cell proliferation,32 the latter of which we observe. Interestingly, rare populations of dendritic cells have been noted to express CD22.33,34 How this intersects with CD22 targeting, NK cell function, and carHLH warrants further analysis, especially given the relatively higher incidence of carHLH seen with CD22 CAR T cells than with alternate targeting.
Given similarities in baseline disease status and high response rates between those with and without carHLH, it is unlikely that residual antigen triggered carHLH. Indeed, we recently reported on a perforin-deficient syngeneic murine model where antigen-independent CAR T-cell expansion associated with HLH-like toxicities.35 In the presence of perforin-deficient CAR T-cell expansion, concurrent wild-type T-cell expansion occurred, supporting the hypothesis of a T-cell driven expansion promoting secondary hyperinflammatory responses.35
In the context of heightened CAR T-cell expansion, cytokine elevations in those with carHLH were not only dramatic in magnitude but remained more persistently elevated. This potentially accounts for the delayed onset of carHLH manifestations in select patients, supporting the notion of these manifestations as a CRS variant. Consistent with known HLH pathophysiology, IL-1β levels were particularly high among those with carHLH. This supports our use of anakinra, an IL1 receptor antagonist, for treatment of carHLH, as we have previously described,16 and aligns with emerging data for anakinra in secondary HLH.36,37 Beyond IL-1β, there is extensive literature characterizing IFNγ as a driver of primary and secondary HLH symptomatology,38-40 which was also highly elevated in those with carHLH and predictive of this toxicity. Considering the FDA approval of emapalumab, a monoclonal antibody targeting IFNγ in primary refractory HLH, IFNγ elevations could prompt consideration of this agent for utilization in the treatment of carHLH. Given lack of clinical experience with emapalumab and CAR T-cells, as well as preclinical data suggesting that early emapalumab could potentially impede CAR efficacy,35 prospective evaluation and/or combinatorial approaches for those more severely affected are warranted.
High IL-18 concentrations have been shown to strongly correlate with HLH in multiple rheumatic conditions.38,41,42 Similarly, we found total IL-18 to be highly elevated in those with carHLH, most prominently at later time points, consistent with the later onset of carHLH. IL-18bp (the endogenous inhibitor of IL-18) was also increased, and yet its levels waned in the days following CRS onset despite continually rising total IL-18 levels. This suggests a disruption in the endogenous feedback mechanism that regulates biologically active IL-18 levels, a dysregulation which could potentially predispose carHLH patients to higher free IL-18 levels. Notably, differences in IL-18 or IL-18bp did not distinguish those with grades 1-2 CRS from higher grade CRS. Future efforts will focus on measuring free IL-18 to explore the impact of IL-18.43 IL-4 was also elevated in those with carHLH and warrants further investigation in view of literature suggesting that sustained exposure to IL-4 may lead to hemophagocytosis and macrophage activation.44
Peak IL6 between those who did and did not develop carHLH did not substantially differ after accounting for tocilizumab utilization. Additionally, the majority of patients with carHLH had received prior tocilizumab for CRS yet still went on to develop carHLH despite clear improvement in other metrics of conventional CRS (eg, fever, hypotension) that prompted tocilizumab administration. Collectively, our data supports the notion that alternative cytokine pathways were likely responsible for mediating the subsequent clinical manifestations of carHLH (eg, coagulopathy, worsening transaminitis), prompting utilization of non-IL6 targeted approaches for treatment of carHLH.16
Collectively, we used our data to predict those at risk of carHLH to facilitate both earlier identification and preemptive treatment to prevent more severe carHLH, akin to the learned experience of tocilizumab to prevent severe CRS.19,45 Future iterations of our CD22 CAR trial will implement early intervention with anakinra, which will help elucidate the impact of anakinra on CAR T-cell response. As more severe carHLH necessitated prolonged immunosuppression, potentially increasing infection risk, with coinfection leading to worse outcomes,46 preemptive measures may improve overall outcomes.
As for limitations, adopting ‘carHLH’ as a term may be a misnomer that does not accurately address the pathophysiology underlying this secondary hyperinflammatory state. Similarly, the clinical and laboratory parameters (eg, ferritin) we used to identify carHLH can be critiqued and may vary by CAR construct. However, given the resemblance of the clinical manifestations to primary or secondary HLH2 and increasing utilization of “HLH/macrophage activation syndrome” terminology as a toxicity in adoptive cell therapy to describe this constellation of findings,6,10,47 the nomenclature of “carHLH” serves the purpose of effectively linking this toxicity profile with CAR T cells and clearly establishes it as a CRS variant associated with T-cell activation, serving as foundation to build future efforts upon. As more experience is gained with carHLH, a consensus definition will likely be needed, potentially with a grading schema to delineate when treatment may be warranted to develop the optimal therapeutic approach. Prospective efforts evaluating sCD25, CXCL9 and CXCL10 as established biomarkers of HLH, given both our preliminary findings and potential implications on carHLH pathophysiology,24,25 are needed. Additionally, while bulk transcriptome sequencing of the unstimulated CAR T-cell product did not reveal major differences in gene expression when comparing manufacturing protocols or toxicity profiles, our future efforts will include single-cell profiling of CAR T-cell products along with comparisons of CD19 to CD22 CAR T-cell products to elucidate differences in the underlying biology which may not be apparent in bulk data or resting states.
Based on our experience with carHLH and CD22 CAR T cells, amid a growing body of literature reporting HLH-like toxicities following low-grade CRS, often with delayed onset or with novel CAR T-cell constructs,5,17,47,48 it is imperative to recognize carHLH, particularly since it can be associated with potentially fatal and life-threatening complications.47 Although current ASTCT CRS consensus guidelines specifically state that given the absence of a need to directly treat HLH and an inability to separate CRS from HLH that grading this entity was not needed,10 our efforts suggest that further investigations into recognizing carHLH and grading its severity are indicated, especially since non-IL6 directed therapies may be important. Indeed, as preemptive strategies to prevent severe CRS are increasingly used,19,49 awareness of carHLH as a late, less conspicuous CRS manifestation may become increasingly relevant and allow for development of an improved framework within which to treat or prevent this toxicity and improve outcomes. Establishing carHLH as a CRS variant will facilitate optimized management and enhanced understanding of the underlying pathophysiology of this emergent toxicity.
Acknowledgments
The authors gratefully acknowledge the study participants and their families, the referring medical care teams, and the faculty and staff of the National Institutes of Health (NIH) Clinical Center and Seattle Children’s Hospital who provided their expertise in the management of the study participants, and the data managers, research nurses, and patient care coordinators involved with this work. The authors thank the following faculty for their input: Gregoire Altan-Bonnet (Laboratory of Integrative Cancer Immunology, NCI) for his critical review of the manuscript, Sydney Moller and Michael Davies (Applied Developmental Research Directorate, Leidos Biomedical Research, Inc, Frederick National Laboratory for Cancer Research, NCI) for their support in conduct of studies which supported the data generated for this manuscript, and also Sergio Rosenzweig and Shakuntala Rampertaap from the Immunology Service, Department of Laboratory Medicine, NIH Clinical Center, for their support in conduct of the lymphocyte phenotyping assays.
This work was supported, in part, by the Intramural Research Program, Center of Cancer Research, National Cancer Institute (NCI), and NIH Clinical Center, (ZIA BC 011823). This research was made possible through the NIH Medical Research Scholars Program, a public-private partnership supported jointly by the NIH, and contributions to the Foundation for the NIH from the Doris Duke Charitable Foundation, Genentech, the American Association for Dental Research, the Colgate-Palmolive Company, and other private donors. The content of this publication does not necessarily reflect the views of policies of the Department of Health and Human Services, nor does mention of trade names, commercial products, or organizations imply endorsement by the US Government.
Authorship
Contribution: D.A.L. and N.N.S wrote the first version of the manuscript; F.S., L.S., B.Y., H.-W.W., J.I., K.S., N.T., E.R., D.F.S., and N.N.S. provided critical input and wrote select sections of the manuscript; D.A.L., F.S., and N.N.S. designed the study; F.S., S.M.S., L.C.H., W.R., J.M., P.H., P.J., and E.R. provided statistical support and bioinformatics analysis; L.S., H.-W.W., Y.W., J.W., J.I., K.S., K.M.C., J.M., C.Y., M.S.-S., J.J., S.L.H., N.T., P.J., and D.F.S. performed correlative studies and conducted data analysis; B.Y., F.C., A.K.O., T.J.F., R.A.G., H.S., and N.N.S. provided patient care; P.H. and P.J. provided support for RNAseq analysis; A.D.-F. provided figures for bone marrow samples; F.C., K.M.C., and R.A.G. provided data for CD19 patients; and all authors contributed to reviewing the final manuscript and have agreed to be coauthors.
Conflict-of-interest disclosure: The authors declare no competing financial interests.
Correspondence: Nirali N. Shah, Pediatric Oncology Branch, Center for Cancer Research, National Cancer Institute, National Institutes of Health, Bethesda, MD 20892; e-mail: nirali.shah@nih.gov.
Send data sharing requests via e-mail to the corresponding author.
The online version of this article contains a data supplement.
The publication costs of this article were defrayed in part by page charge payment. Therefore, and solely to indicate this fact, this article is hereby marked “advertisement” in accordance with 18 USC section 1734.

This feature is available to Subscribers Only
Sign In or Create an Account Close Modal