

TO THE EDITOR:
Myeloproliferative neoplasms (MPNs) are a heterogeneous group of chronic hematological malignancies often exhibiting a combination of a driver gene mutation (JAK2, MPL, or CALR) with a variety of somatic mutations harboring variable prognostic values. Some high-molecular-risk (HMR) mutations (in ASXL1, EZH2, SRSF2, IDH1/2, U2AF1 genes) have been identified as associated with an increased risk of transformation and poorer survival in patients with myelofibrosis (MF).1 A subset of MPN patients carries somatic mutations in the hematopoietic transcription factor NFE2 (nuclear factor erythroid 2) or displays epigenetically induced overexpression of NFE2.2-4 In transgenic murine models, mutated or overexpressed NFE2 is associated with an MPN phenotype,2,5 and NFE2 overexpression predisposes to leukemic transformation in vivo.5 Importantly, mutant NFE2 mice often acquire additional genetic abnormalities (trisomy 8, 5q deletions, and TP53 mutations), favoring subsequent leukemic transformation.4 However, despite these strong experimental data, the clinical impact of NFE2 mutations in MPN patients remains poorly described. The aim of this study was to evaluate in a large monocentric cohort the impact of NFE2 somatic mutations on the phenotype and outcomes of MPN patients.
A total of 1243 consecutive patients seen in our institution between January 2011 and May 2020 were diagnosed with MPNs according to World Health Organization criteria. This study included 707 patients in whom next-generation sequencing (NGS), including the analysis of NFE2, was performed as previously described6 at diagnosis and/or during follow-up (Figure 1A). Sequential molecular evaluation during MPN clinical course was available for 262 patients (37.1%), whereas 17.3% had at least 3 NGS evaluations with a subset of patients being molecularly evaluated up to 6 times (Figure 1A). Median follow-up was 121.0 months (IQR [70.0; 187.2]).
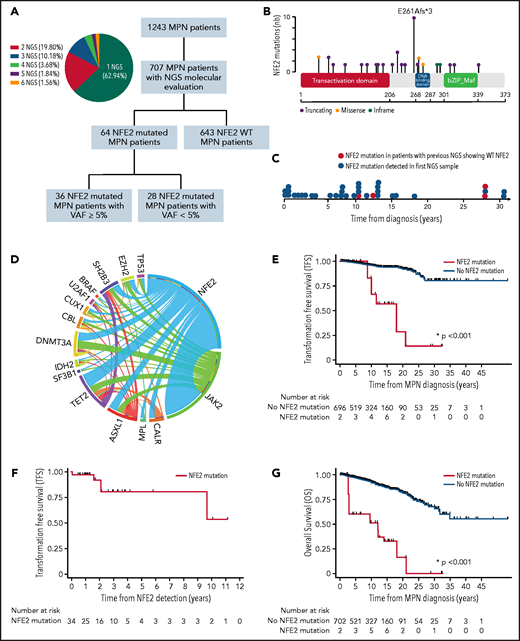
Molecular and prognosis characteristics of NFE2-mutated MPN patients. (A) Flowchart of the study and proportion of patients with sequential NGS analysis. (B) NFE2 mutations positioned on the NFE2 protein sequence with its main functional domains. The y-axis represents the frequency of each mutation. (C) Time of detection of NFE2 mutations during MPN clinical course. (D) Circos plot depicting mutational associations in NFE2-mutated patients and their relative frequency. (E) acute myeloid leukemia / myelodysplastic syndrome (AML/MDS) TFS of NFE2-mutated compared with non–NFE2-mutated MPN patients. (F) AML/MDS TFS of NFE2-mutated MPN patients. (G) Overall Survival (OS) of NFE2-mutated compared with non–NFE2-mutated MPN patients. For OS and Transformation Free Survival (TFS) representation, all patients started in the non–NFE2-mutated group and populated the NFE2-mutated group after NFE2 mutation identification. These analyses only included the 707 MPN patients in whom NFE2 mutational status was available.
Molecular and prognosis characteristics of NFE2-mutated MPN patients. (A) Flowchart of the study and proportion of patients with sequential NGS analysis. (B) NFE2 mutations positioned on the NFE2 protein sequence with its main functional domains. The y-axis represents the frequency of each mutation. (C) Time of detection of NFE2 mutations during MPN clinical course. (D) Circos plot depicting mutational associations in NFE2-mutated patients and their relative frequency. (E) acute myeloid leukemia / myelodysplastic syndrome (AML/MDS) TFS of NFE2-mutated compared with non–NFE2-mutated MPN patients. (F) AML/MDS TFS of NFE2-mutated MPN patients. (G) Overall Survival (OS) of NFE2-mutated compared with non–NFE2-mutated MPN patients. For OS and Transformation Free Survival (TFS) representation, all patients started in the non–NFE2-mutated group and populated the NFE2-mutated group after NFE2 mutation identification. These analyses only included the 707 MPN patients in whom NFE2 mutational status was available.
In our NGS cohort, 233 patients presented with polycythemia vera (PV), 332 with essential thrombocythemia (ET), 113 with primary or prefibrotic myelofibrosis (PMF), 23 with unclassified MPNs, and 6 with MDS/MPN. Median age at diagnosis was 51 years (40; 61), and 70.01% of patients had a JAK2V617F mutation, 16.41% of patients had a CALR exon 9 mutation, and 3.39% of patients had a MPL exon 10 mutation. Patients’ characteristics are summarized in Table 1.
MPN patients’ characteristics according to NFE2 mutational status
| All patients (n = 1243) | All patients with NGS (n = 707) | NFE2-mutated patients (n = 36) | Non–NFE2-mutated patients (n = 671) | P | |
|---|---|---|---|---|---|
| Age at MPN diagnosis, y, (median [IQR]) | 51 (40; 63) | 51 (40; 61) | 53 (44; 63) | 50.5 (39; 61) | .074 |
| Female, no. (%) | .170 | ||||
| No | 557 (44.81) | 311 (43.99) | 20 (55.56) | 291 (43.37) | |
| Yes | 686 (55.19) | 396 (56.01) | 16 (44.44) | 380 (56.63) | |
| MPN subtype, no. (%) | .359 | ||||
| ET | 577 (46.42) | 332 (46.96) | 12 (33.33) | 320 (47.69) | |
| PV | 411 (33.07) | 233 (32.96) | 17 (47.22) | 216 (32.19) | |
| PMF | 184 (14.8) | 113 (15.98) | 6 (16.67) | 107 (15.95) | |
| MDS/MPN | 12 (0.97) | 6 (0.85) | 0 | 6 (0.89) | |
| MPN unclassified | 59 (4.75) | 23 (3.25) | 1 (2.78) | 22 (3.28) | |
| Driver mutation, n (%) | .390 | ||||
| JAK2V617F | 909 (73.13) | 495 (70.01) | 29 (80.56) | 466 (69.45) | |
| JAK2 exon 12 | 7 (0.56) | 4 (0.57) | 0 | 4 (0.60) | |
| MPL | 41 (3.30) | 24 (3.39) | 2 (5.56) | 22 (3.28) | |
| CALR | 175 (14.08) | 116 (16.41) | 4 (11.11) | 112 (16.69) | |
| Triple negative | 105 (8.45) | 68 (9.62) | 1 (2.78) | 67 (9.99) | |
| Hgb, g/dL, median (IQR) | 14 (12.4; 15.8) | 13.7 (12.2; 15.7) | 15.15 (12.8; 16.2) | 13.7 (12.2; 15.6) | .274 |
| Ht, %, median (IQR) | 43.65 (39; 49) | 42.4 (38.1; 48.3) | 50 (43.5; 50.9) | 42.1 (38; 48) | .032 |
| Platelets, G/L, median (IQR) | 576 (344; 800) | 582 (341; 811) | 701 (350; 993) | 582 (338; 810) | .517 |
| WBC, G/L, median (IQR) | 9.4 (7.2; 12.5) | 9.5 (7.2; 12.9) | 10.48 (7.3; 12.5) | 9.5 (7.2; 12.9) | .941 |
| ANC, G/L, median (IQR) | 6.3 (4.6; 9.1) | 6.4 (4.7; 9.5) | 7.2 (3.3; 9.0) | 6.4 (4.7; 9.5) | .982 |
| Immature myeloid cells, no. (%) | .066 | ||||
| <2% | 1049 (84.39) | 591 (83.59) | 32 (88.89) | 559 (83.31) | |
| ≥2% | 84 (6.76) | 68 (9.62) | 0 | 68 (10.13) | |
| Circulating blasts, no. (%) | .396 | ||||
| No | 1098 (88.33) | 634 (89.67) | 32 (88.89) | 602 (89.72) | |
| ≥1% | 47 (3.78) | 33 (4.67) | 0 | 33 (4.92) | |
| Elevated LDH, no. (%) | .673 | ||||
| No | 159 (12.79) | 88 (12.45) | 2 (5.56) | 86 (12.82) | |
| Yes | 115 (9.25) | 82 (11.60) | 3 (8.33) | 79 (11.77) | |
| Performance status, no. (%) | .390 | ||||
| 0 | 339 (27.27) | 193 (27.30) | 4 (11.11) | 189 (28.17) | |
| 1 | 97 (7.80) | 79 (11.17) | 4 (11.11) | 75 (11.18) | |
| 2 | 15 (1.21) | 13 (1.84) | 0 | 13 (1.94) | |
| 3 | 1 (0.08) | 0 | 0 | 0 | |
| Constitutional symptoms, no. (%) | .232 | ||||
| No | 541 (43.52) | 301 (42.57) | 10 (27.78) | 291 (43.37) | |
| Yes | 76 (6.11) | 45 (6.36) | 3 (8.33) | 42 (6.26) | |
| Microvascular symptoms, no. (%) | .100 | ||||
| No | 463 (37.25) | 257 (36.35) | 8 (22.22) | 249 (37.11) | |
| Yes | 143 (11.50) | 77 (10.89) | 6 (16.67) | 71 (10.58) | |
| Splenomegaly, no. (%) | 1.00 | ||||
| No | 392 (31.54) | 235 (33.24) | 11 (30.56) | 224 (33.38) | |
| Yes | 297 (23.89) | 178 (25.18) | 9 (25) | 169 (25.19) | |
| RBC transfusion dependency, no. (%) | .549 | ||||
| No | 834 (67.10) | 478 (67.61) | 19 (52.78) | 459 (68.41) | |
| Yes | 28 (2.25) | 19 (2.69) | 1 (2.78) | 18 (2.68) | |
| No. of thrombotic events, median (IQR) | 0 (0; 1) | 0 (0; 1) | 0 (0; 1) | 0 (0; 1) | .444 |
| History of thrombotic events at diagnosis, no. (%) | 1.000 | ||||
| No | 871 (70.07) | 520 (73.55) | 27 (75) | 493 (73.47) | |
| Yes | 371 (29.85) | 186 (26.31) | 9 (25) | 177 (26.38) | |
| No. of hemorrhagic events, median (IQR) | 0 (0; 0) | 0 (0; 0) | 0 (0; 0) | 0 (0; 0) | .751 |
| History of hemorrhagic events at diagnosis, no. (%) | .571 | ||||
| No | 1217 (97.91) | 691 (97.74) | 35 (97.22) | 656 (97.76) | |
| Yes | 26 (2.09) | 16 (2.26) | 1 (2.78) | 15 (2.24) | |
| Karyotype, no. (%) | .373 | ||||
| Normal | 89 (7.16) | 86 (12.16) | 8 (22.22) | 78 (11.62) | |
| Not normal excluding complex/monosomal | 45 (3.62) | 45 (6.36) | 2 (5.56) | 43 (6.41) | |
| Complex/monosomal | 8 (0.64) | 7 (0.99) | 1 (2.78) | 6 (0.89) | |
| No. of additional mutations, median (IQR) | 1 (0; 2) | 1 (0; 2) | 1 (0; 2) | 1 (0; 2) | .749 |
| TP53 mutation (%) | .712 | ||||
| No | 670 (53.90) | 670 (94.77) | 34 (94.44) | 636 (94.78) | |
| Yes | 37 (2.98) | 37 (5.23) | 2 (5.56) | 35 (5.22) | |
| HMR mutations (%) | .839 | ||||
| No | 544 (43.77) | 544 (76.94) | 27 (75) | 517 (77.05) | |
| Yes | 163 (13.11) | 163 (23.06) | 9 (25) | 154 (22.95) | |
| First-line cytoreductive treatment, no. (%) | .139 | ||||
| Hydroxyurea (HU) | 317 (80.46) | 23 (88.46) | 294 (79.89) | ||
| Interferon-α | 38 (9.64) | 0 | 38 (10.33) | ||
| Vercyte | 19 (4.82) | 1 (3.85) | 18 (4.89) | ||
| Anagrelide | 5 (1.27) | 0 | 5 (1.36) | ||
| Ruxolitinib or other JAK inhibitors | 13 (3.3) | 1 (3.85) | 12 (3.26) | ||
| Other treatment | 2 (0.51) | 1 (3.85) | 1 (0.27) | ||
| Hematological response to HU first line, no. (%) | .792 | ||||
| CR, CHR | 289 (91.17) | 21 (91.30) | 268 (91.16) | ||
| PR | 22 (6.94) | 2 (8.7) | 20 (6.8) | ||
| CI | 0 | 0 | 0 | ||
| SD | 6 (1.89) | 0 | 6 (2.04) | ||
| PD | 0 | 0 | 0 | ||
| Disease status at time of NFE2 diagnosis, no. (%) | NA | ||||
| Stable response | NA | NA | 22 (61.11) | NA | |
| Lost response | NA | NA | 14 (38.89) | NA | |
| No. of treatment lines at last FU, median (IQR) | 1 (1; 2) | 2 (1; 2.5) | 1 (1; 2) | .0016 | |
| Hematological response at last FU, no. (%) | .026 | ||||
| CR, CHR | 573 (46.10) | 345 (48.80) | 15 (41.67) | 330 (49.18) | |
| PR | 147 (11.83) | 63 (8.91) | 4 (11.11) | 59 (8.79) | |
| CI | 59 (4.75) | 25 (3.54) | 0 | 25 (3.73) | |
| SD | 152 (12.23) | 107 (15.13) | 9 (25) | 98 (14.61) | |
| PD | 87 (7) | 53 (7.50) | 8 (22.22) | 45 (6.71) | |
| AML/MDS transformation, no. (%) | 57 (4.63) | 38 (5.42) | 5 (13.89) | 33 (4.92) | .039 |
ANC, absolute neutrophil count; CI, clinical improvement; CHR, complete hematological remission; CR, complete remission; FU, follow-up; Hgb, hemoglobin; Ht, hematocrit; LDH, lactate dehydrogenase; NA, not applicable; PD, progressive disease; PR, partial response; RBC, red blood cells; SD, stable disease; WBC, white blood cells.
A total of 64 (9.1%) patients harbored an NFE2 mutation with a variant allelic frequency (VAF) ≥1%, including 36 (5.1%) with a VAF ≥ 5%. To focus on patients with relevant mutant clones, only patients with an NFE2 mutant VAF ≥5% were considered NFE2 mutated in this study. Most of the mutations were frameshift alterations (62%) and were mainly located between the NH2-terminal transactivation and the DNA binding domain (43%), as described in the literature.7 The most frequent alteration was the truncating mutation E261Afs*3 (27%) (Figure 1B; supplemental Table 1, available on the Blood Web site). Interestingly, NFE2 mutations were detected at different time points during MPN disease course, as previously suggested by Grinfeld et al8 (Figure 1C). Within the 36 NFE2 mutated patients, NFE2 was wild type in the initial screening in 4 patients, whereas 11 patients had at least 2 NGS evaluations showing an NFE2 mutation during their chronic MPN phase. NFE2 mutations’ VAF evolution is presented in supplemental Table 2.
Clinical presentation was slightly different between NFE2 nonmutated and mutated patients, as the latter group presented with higher median hematocrit (50.0% [43.5; 50.9]) than nonmutated patients (42.1% [38.0; 48.0]; P = .032). NFE2 mutations were present in 7.3%, 5.3%, and 3.6% of PV, PMF, and ET patients, respectively. We therefore performed a subgroup analysis to evaluate the impact of NFE2 mutations on hematocrit in each disease subtype (supplemental Tables 3 and 4). Low number of mutated patients precluded such analysis in the PMF subgroup. Median hematocrit was significantly higher in NFE2-mutated patients with ET but not with PV (supplemental Table 4). This association remained significant when the analysis was limited to NFE2 truncating mutations only (supplemental Tables 5-6).
No significant association between the presence of an NFE2 mutation and other molecular MPN characteristics (type of driver mutation, cytogenetics, number of additional mutations, TP53, DNMT3A, TET2, RAS pathway, or HMR mutations) was observed using a logistic regression association model (supplemental Table 7). Pairwise cooccurrence of mutations in patients harboring an NFE2 mutation is represented in Figure 1D. TET2, DNMT3A, and ASXL1 were the most frequently associated mutations. HMR mutations were associated with NFE2 mutations in less than a third of patients (27.8%).
In terms of impact on disease response, no significant difference was observed between NFE2-mutated and nonmutated patients (P = .792) in response to the predominantly used first-line cytoreductive therapy (hydroxyurea). Interestingly, at time of NFE2 mutation identification, 38.9% patients were no longer responding to their treatment. At last follow-up, the number of treatment lines was significantly higher in NFE2-mutated patients (P = .0016), and significantly lower rates of hematological response were observed (P = .026) (Table 1). These results therefore suggest that NFE2 mutational status should be evaluated at multiple time points during MPN clinical course, particularly if hematological response is lost.
Interestingly, the presence of an NFE2 mutation (hazard ratio [HR], 10.29; 95% confidence interval [CI]: 3.58, 29.61; P < .001), PMF subtype (HR, 6.44; 95% CI: 2.62, 15.81; P < .001), HMR mutations (HR, 2.51; 95% CI: 1.16, 5.43; P = .020), and age at diagnosis (HR, 1.08; 95% CI: 1.05, 1.12; P < .001), was independently associated with acute myeloid leukemia / myelodysplastic syndrom (AML/MDS) transformation-free survival (TFS) in a COX regression multivariate analysis (Figure 1E; supplemental Table 8). Median TFS was 216.1 months and not reached for NFE2-mutated and nonmutated patients, respectively. Median time between NFE2 mutation identification and AML/MDS transformation was 25.18 months (range, 0.52, 115.93) (Figure 1F). Although all AML/MDS transformation events occurred among patients harboring NFE2 mutations with a VAF ≥ 5%, the impact of NFE2 mutations on TFS remained significant when (i) all detectable NFE2 mutations were considered (VAF ≥ 1%) (supplemental Figure 1A; supplemental Table 9), and (ii) only truncating NFE2 mutations were analyzed (supplemental Figure 1B; supplemental Table 10). Notably, only patients with PV transformed into AML/MDS in the NFE2 mutated cohort. A subgroup analysis consistently confirmed the independent impact of NFE2 mutations in PV patients (supplemental Figure 1C; supplemental Table 11).
No difference was observed in terms of thrombohemorrhagic events (HR, 0.73; 95% CI: 0.10, 5.21); P = .752) and secondary MF-free survival (HR, 0.67; 95% CI: 0.09, 4.87); P = .693).
The presence of an NFE2 mutation was independently associated with overall survival (OS) (HR, 8.24; 95% CI: 3.67, 18.52; P < .001) (Figure 1G; supplemental Table 12). Median OS was 144.2 months and not reached for NFE2-mutated and nonmutated patients, respectively. The impact of NFE2 mutations on OS remained significant when (i) all NFE2-mutated patients (VAF ≥ 1%), (ii) only NFE2-truncating mutations, and (iii) only PV patients were analyzed (supplemental Tables 13-15; supplemental Figure 1D-F).
Additional molecular abnormalities acquired in NFE2-mutated patients were consistent with the recently reported murine models describing the natural history of altered NFE2-induced myeloid disorders.4 Indeed, at time of transformation, NFE2-mutated patients had acquired several cytogenetic abnormalities, including trisomy 8 or chromosomes 5, 7, and 17 deletions, resulting in a complex karyotype in 3 out of 4 patients with blastic medullary involvement. Moreover, 3 newly acquired TP53 mutations (VAF: 33%, 29%, and 5%) were found in 1 patient, whereas the VAF of a preexisting TP53 mutation increased in another patient (from 5% to 27%), and 1 patient developed an NRAS mutation (VAF: 14%) (supplemental Table 16). Of note, as previously reported by Jutzi et al,4 1 patient developed an isolated myelosarcoma. Interestingly, although NFE2 mutations were still present at time of transformation, their allelic frequency decreased in all evaluable patients when compared with chronic phase MPNs (supplemental Table 16). These results may suggest a paracrine transformation mechanism based on NFE2-induced genetic instability, facilitating the acquisition of additional somatic mutations either within the bone marrow or in an extra medullary environment, therefore promoting the development of secondary AML/MDS or myelosarcoma, respectively.
Overall, this is the first large clinical study showing that the presence of NFE2 mutations with a VAF ≥ 5% is independently associated with an increased risk of leukemic transformation and shorter OS in MPNs, in contrast with a previously reported study.7 Discrepant results might be explained by a higher number of PV patients included in our cohort, a higher proportion of truncating mutations, and a longer follow-up period. In our cohort, NFE2 mutations were found at different time points after MPN diagnosis (median: 122.4 months [range, 0; 373.2]), suggesting that long-term follow-up with sequential NFE2 status evaluation is required to identify these late occurring events. In line with our results, Grinfeld et al also suggested that NFE2 mutations were acquired significantly later in MPN clinical disease history,8 although their study did not evaluate the independent effect of NFE2 mutations but rather included this variable as part of a more complex subcategorization. In addition, our cohort included a higher proportion of PV patients analyzed for a longer follow-up period, which may have increased our ability to unravel the prognostic role of NFE2. Our study also clinically confirms previously reported comprehensive preclinical studies informing on the leukemogenic role of NFE2 mutations.4 The clinical and molecular characteristics of MPN transformation in our cohort were in line with the recently reported NFE2 altered animal models developing an MPN phenotype with a predisposition to AML/myelosarcoma transformation.4,5 Importantly, in our cohort of MPN patients, NFE2 mutations increased the risk of leukemic transformation independently from age and HMR mutations, suggesting that they could be implemented in novel prognostic scoring systems.
Our findings show that NFE2 mutations adversely affect MPN patients’ prognosis and suggest that their presence should be screened at MPN diagnosis and during follow-up. Identification of NFE2 mutations may also pave the road for novel therapeutic strategies through NFE2 down-modulation using histone deacetylase inhibitors, the use of which has been reported to decrease NFE2 levels in murine models and patient samples concomitantly with clinical efficacy.5,9,10
Acknowledgments
The authors thank the clinical care team of the Comprehensive Myeloproliferative Neoplasms Center for samples and data collection, and the staff of the cellular biology laboratory for excellent technical assistance. The authors also thank the French Intergroup for Myeloproliferative neoplasms for insightful discussions.
L.B. is a “CCA-INSERM Bettencourt,” an “Association Laurette Fugain,” a “Féderation Leucémie Espoir,” an “Oncosphère-Pfizer,” and an LNCC grant recipient, a “GILEAD hematology/oncology international research scholar,” and an “EHA physician-scientist” grant recipient.
Authorship
Contribution: C.M., L.-P.Z., R.D.d.O., M.C., N.G., and B.R. collected the data; C.M. and L.-P.Z. analyzed the data and wrote the manuscript; E.V., N.M., E.C., and B.C. performed molecular analyses; J.S.-D., N.P., C.D., J.-M.Z., W.V., E.R., S.G., J.-J.K., and L.B. provided patient care; J.-J.K., B.C., and L.B. designed the study, analyzed the data, and wrote the manuscript; L.B. supervised the study and performed statistical analyses; and all authors reviewed, edited, and critically discussed the manuscript.
Conflict-of-interest disclosure: L.B. has received research support from the GILEAD Foundation for research projects unrelated to the current study. The remaining authors declare no competing financial interests.
Correspondence: Jean-Jacques Kiladjian Centre d’Investigations Cliniques, Hôpital Saint-Louis, 1 Avenue Claude Vellefaux, 75010 Paris, France; e-mail: jean-jacques.kiladjian@aphp.fr; and Lina Benajiba, Centre d’Investigations Cliniques, Hôpital Saint-Louis, 1 Avenue Claude Vellefaux, 75010 Paris, France; e-mail: lina.benajiba@aphp.fr.
The online version of this article contains a data supplement.
There is a Blood Commentary on this article in this issue.

This feature is available to Subscribers Only
Sign In or Create an Account Close Modal