

Key Points
PRC2 loss of function profoundly reshapes the genetic and epigenetic landscapes of T-ALL, reactivating stem cell programs.
PRC2 inactivation confers a targetable vulnerability to BET inhibitors that can be exploited to treat T-ALL patients.

Abstract
T-cell acute lymphoblastic leukemia (T-ALL) is a group of aggressive hematological cancers with dismal outcomes that are in need of new therapeutic options. Polycomb repressor complex 2 (PRC2) loss-of-function alterations were reported in pediatric T-ALL, yet their clinical relevance and functional consequences remain elusive. Here, we extensively analyzed PRC2 alterations in a large series of 218 adult T-ALL patients. We found that PRC2 genetic lesions are frequent events in T-ALL and are not restricted to early thymic precursor ALL. PRC2 loss of function associates with activating mutations of the IL7R/JAK/STAT pathway. PRC2-altered T-ALL patients respond poorly to prednisone and have low bone marrow blast clearance and persistent minimal residual disease. Furthermore, we identified that PRC2 loss of function profoundly reshapes the genetic and epigenetic landscapes, leading to the reactivation of stem cell programs that cooperate with bromodomain and extraterminal (BET) proteins to sustain T-ALL. This study identifies BET proteins as key mediators of the PRC2 loss of function-induced remodeling. Our data have uncovered a targetable vulnerability to BET inhibition that can be exploited to treat PRC2-altered T-ALL patients.
Introduction
T-cell a cute lymphoblastic leukemia (T-ALL) is a class of aggressive hematological cancers arising from the transformation of thymic cell precursors arrested at specific stages of their differentiation.1 T-ALL mostly occurs in children and young adults (10%-15% and 20%-25% of ALL cases, respectively). Intensive multiagent chemotherapy protocols, potentially followed by hematopoietic stem cell transplantation, have globally improved the outcome of pediatric and adult T-ALL. Nevertheless, T-ALL remains a poor prognosis, notably for relapsing cases (about 25% of pediatric and 50% of adult T-ALL).2 These cases are clinically challenging given their limited therapeutic options and because they frequently develop resistance to salvage chemotherapy. Thus, refractory or relapsed T-ALL cases have a dramatically poor prognosis, with a need to develop novel targeted therapies.3,4
Transcriptional studies have led to the classification of T-ALL into subgroups defined by their driving oncogenes and maturation stage arrest.5 Such classification notably distinguishes early thymic precursor (ETP-ALL), LYL1 or HOXA (immature stage), T-cell leukemic homeobox 1 (TLX1) or TLX3 (early cortical), and TAL1/LMO (mature/late cortical) T-ALL.6 Numerous additional recurrent anomalies have been reported, including mutations of the NOTCH1 pathway or deletions of CDKN2A, both found in more than 70% of T-ALL.7 Thus, the complex oncogenetic landscape of T-ALL precludes the identification of consensus therapeutic targets.
In addition to oncogenic driver mutations, the disruption of epigenetic processes contributes to T-ALL development and progression.8 Frequent alterations of epigenetic regulators such as PHF69 DNMT3A10,11; polycomb repressor complex 2 (PRC2) core members EZH2, EED, and SUZ1212-15; KDM6B16; TET family; and IDH1/212,17 are observed in T-ALL. PRC2 acts as a central epigenetic regulator and transcription repressor by writing the H3 lysine 27 trimethyl (H3K27me3) epigenetic mark.18 Its role during hematopoiesis has been described.19,20 Particularly, PRC2 governs cellular identity during hematopoiesis and differentiation of embryonic stem cells.21,22 Loss-of-function alterations of PRC2 are found in up to 25% of T-ALL.12 Notably, EZH2 inactivation has been associated with poor prognosis in the aggressive ETP-ALL subtype. PRC2 disruption leads to the reactivation of stem/early progenitor-associated programs, and cooperates with oncogenic JAK-STAT signaling in ETP-ALL, driving disease progression.23 Yet, the clinical impact of PRC2 alterations remains elusive in adult T-ALL.
The bromodomain and extraterminal (BET) proteins constitute a family of epigenetic readers specialized in the detection of acetyl-lysine side chains on histones, including the H3K27ac mark and transcription factors (TFs).24 The 3 somatic members BRD2, BRD3, and BRD4 recruit transcription activators, repressors, and histone modifiers to modulate gene expression and the epigenetic landscape. Given their broad range of functions in cancer, BET proteins have emerged as potential therapeutic targets.25,26 Notably, small molecule BET inhibitors exhibited promising clinical results in BRD4-NUT-driven thymic midline carcinomas and are largely evaluated in hematopoietic and solid malignancies.26-28
In this study, we analyzed PRC2 mutations and deletions in a large series of 218 Group for Research on Adult Acute Lymphoblastic Leukemia (GRAALL)03/05-treated adult T-ALL patients and report that PRC2 loss of function provokes an epigenetic switch toward global H3K27 reacetylation, resulting in the reactivation of BET protein-dependent transcriptional programs. This remodeling confers a vulnerability to BET inhibition that can be exploited to target PRC2-altered T-ALL patients.
Methods
Patients and primary samples
Patients were enrolled in the GRAALL-2003-2005 trials (registered on http://clinicaltrials.gov as follows: GRAALL-2003, #NCT00222027; GRAALL-2005, #NCT00327678). A subgroup of 218 patients of 337 were included in this study based on DNA availability for molecular analyses. No differences in clinical outcomes were observed between the included patients and the entire cohort (data not shown). Diagnostic peripheral blood or bone marrow samples were collected after informed consent according to the Declaration of Helsinki. Immunophenotyping was performed as previously described.1,29 All samples used contained at least 80% blasts. Patient minimal residual disease (MRD) was assessed as previously described.30 A flowchart of the study is detailed in supplemental Figure 1.
Next-generation sequencing, copy number, and molecular analyses
Genomic analysis was performed by pan-exon targeted next-generation sequencing of DNA extracted from diagnosis samples. The next-generation sequencing panel included 103 genes relevant in hematological malignancies (Nextera XT gene panel; Illumina, San Diego, CA). Libraries were prepared according to Illumina instructions and sequenced on a MiSeq instrument (Illumina; 500× with mean coverage 95%). Sequence reads were aligned to the reference genome (GRCh37/hg19) using our in-house software Polyweb (Institut Imagine, Paris). Variant filtering and calling were performed using validated criteria (coverage <30×, <10 alternative reads or variant allelic fraction < 7%, polymorphisms described in dbSNP, 1000Genomes, EVS, Gnomad, and EXAC with a calculated mean population frequency >0.1%); annotations were done using somatic database COSMIC and ProteinPaint (St Jude Children’s Research Hospital—Pediatric Cancer data portal). Some mutations were confirmed by Sanger sequencing. Copy number variants were assessed by multiplex ligation-dependent probe amplification technique with the SALSA-multiplex ligation-dependent probe amplification P383 T-ALL probe mix (MRC-Holland, Amsterdam, Netherlands) kit containing 53 probes for 13 different chromosomic regions of diagnostic or prognostic importance in T-ALL. PRC2 deletions were confirmed by high-resolution array comparative genomic hybridization as previously reported.31 Genetic lesion cooccurrences and mutual exclusions were computed using the R package DISCOVER available on Bioconductor with the default parameters.32
Patient-derived xenografts
Patient-derived xenografts (PDX) were generated from primary T-ALL samples as previously described.33 Briefly, 106 viable leukemic cells were xenografted by IV retroorbital injection in 2-month-old NOD/SCIDγ−/− mice. Mice were monitored weekly by flow cytometry for leukemic load (FSChi, hCD7+, hCD45+ cells) in peripheral blood. Mice were euthanized when terminally ill, as evidenced by either severe dyspnea or weakness caused by leukemic dissemination in the thymus or vital organs. Bone marrow from tibiae, hips, femurs, and vertebrae was collected for subsequent ex vivo experiments. All samples used contained ≥90% blasts. The experimental procedures were approved by the Institute Animal Care Committee.
In vivo evaluation of BET inhibitor OTX015 and EZH2 inhibitor GSK343
PRC2 wild-type (WT) or altered PDX were established in mice as previously described. Once the leukemic burden reached 0.5% to 5%, mice were segregated into 2 arms (3-4 mice per arm). Mice were subsequently treated by oral gavage with vehicle solution (dimethyl sulfoxide 10%, PEG300 40%, Tween-80 5%, saline 45%) or OTX015 (25 mg/kg; Tocris, Bristol, United Kingdom) for 2 cycles of 5 consecutive days separated by a 2-day interval. For GSK343 evaluation, mice were either injected intraperitoneally with vehicle or GSK343 (5 mg/kg; Tocris) for 2 cycles of 5 consecutive days separated by a 2-day interval. Leukemic progression was monitored as described previously. Mice were euthanized when terminally ill. Kaplan-Meier survival curves were compared using the log-rank test.
RNA sequencing and data analysis
Forty-seven primary samples with eligible RNA from the GRAALL-2003-2005 series were analyzed by poly(A)-enriched RNA-seq.34,35 Fragments were sequenced in stranded paired-end mode (2 × 50 bp) using the SOLiD HQ5500XL platform (Life Technologies, Carlsbad, CA). Differential expression analysis was computed with the R DESEq2 package.36 Genes with an absolute log2 fold change >1 and a corresponding adjusted P value < .05 were considered as differentially expressed. Gene set enrichment analysis (GSEA) was computed using the Broad Institute GSEA software.37 Functional exploration of deregulated genes was performed using Enrichr (queries on the ENCODE Histone Modification Project and CHEA 2016 libraires).38 Gene sets with q values (adjusted P values) < 0.05 were considered significant. Odd ratios provided by Enrichr were used in the figures. Pathway activation scores were determined using the PROGENy R package (version 1.12.0) using the defaults parameters.39 Scores were computed from the variance-stabilized log2 expression values computed from DESeq2. Hierarchical clustering analysis was performed using Euclidean distance and complete clustering method arguments.
ChIP-sequencing and data analysis
A series of 14 primary samples and were analyzed by chromatin immunoprecipitation (ChIP)-sequencing (H3K4me3, H3K27ac, H3K27me3) as previously reported by our group.35 Briefly, cells were crosslinked by an incubation with 1% formaldehyde (Sigma) in phosphate-buffered saline (PBS) for 10 minutes at room temperature, then quenched by addition of 1.25 M glycine (Merck) to the medium for 5 minutes at room temperature under rotation. Cells were collected by centrifugation and washed once with PBS-bovine serum albumin 0.5%. Extracts were sonicated with a Diagenode Bioruptor Sonicator (Diagenode, Liège, Belgium). Chromatin fragments were analyzed on a Bioanalyzer to ensure proper sonication. ChIP was then performed using the appropriate antibodies (anti-H3K4me3, H3K27ac, H3K27me3 antibodies; Diagenode). Chromatin inputs were used for each sample as controls. Peak calling was performed using MACS2 with parameters –bdg –SPMR –nomodel –extsize 200 –q 0.05. Peaks overlapping with UCSC blacklisted regions were excluded. ChIP-sequencing results were visualized using deepTools. Differential binding analyses were conducted using the R package DiffBind.40 Peak reading and counts were retrieved from the consensus peakset determined from the peak calling. Differential enrichment analyses were performed with the argument method DESeq2. Annotations of the differential peaks were computed using ChIPpeakAnno41 and biomaRt. Functional exploration analyses on the genes with differential peak contents were performed using Enrichr (queries on the ENCODE Histone Modification Project and CHEA 2016 libraires).38 Gene sets with q values (adjusted P values) <.05 were considered significant. Odd ratios provided by Enrichr were used in the figures. ChIP-sequencing data were visualized using Integrative Genomics Viewer.42
ELISA
H3K27ac and H3K27me3 levels were measured by enzyme-linked immunosorbent assay (ELISA) using Active Motif Kits (Active Motif, Carlsbad, CA). Briefly, histones were purified from T-ALL PDX samples using the EpiQuik Total Histone Extraction Kit (Epigentek, Farmingdale, NY). A total of 5 µg of acid extracted histone samples were processed by sandwich ELISA following the supplier’s instructions. The provided recombinant H3K27ac and H3K27me3 were used for the standard curves. Absorbances at 450 nm were measured on a GloMax Explorer microplate reader (Promega, Madison, WI).
Cell lines and culture experiments
The T-ALL cell lines JURKAT, RPMI-8402, CEM, ALL-SIL, and SUP-T1 were grown in RPMI-1640 supplemented with 50 µg/mL streptomycin, 50 IU penicillin, 4 mM l-glutamine, and 10% fetal bovine serum (complete medium). Cell lines were authenticated by the American Type Culture Collection. For ex vivo experiments, PDX were cultured in complete medium, supplemented with 50 ng/mL human stem cell factor, 20 ng/mL hFLT3-L, 10 ng/mL hIL-7, and 20 nM insulin (Miltenyi Biotec, Bergisch Gladbach, Germany). Cultures were maintained at 37°C in a humidified atmosphere containing 5% CO2. For treatments, cells or PDX were incubated with increasing doses of JQ1 (Tocris) and GSK343 3 µM (Sigma-Aldrich, St Louis, MO) for 72 hours. Cell viability was determined by flow cytometry by Annexin V-APC/propidium iodide costaining (BD-Pharmingen, San Jose, CA).
Western blotting
Cells were washed in PBS and lysed in RIPA buffer (20 mM Tris-HCl, pH 7.5, 150 mM NaCl, 1 mM EDTA, 1 mM EGTA, 1% NP-40, 1% sodium desoxycholate, 2.5 mM sodium pyrophosphate, 1 mM β-glycerophosphate, 1 mM Na3VO4) supplemented with protease and phosphatase inhibitors (Halt Protease and Phosphatase Inhibitor Cocktail; Thermo Scientific, Waltham, MA). Cell lysates were separated by sodium dodecyl sulfate-polyacrylamide gel electrophoresis and transferred onto nitrocellulose membranes. After blocking for 1 hour in blocking buffer (Tween-PBS 5% bovine serum albumin), membranes were incubated overnight at 4°C with the primary antibodies in blocking buffer (anti-H3K27ac [D5E4], anti-H3K27me3[C36B11]; Cell Signaling Technologies, Danvers, MA). After washes, membranes were incubated for 1 hour minimum at room temperature with the appropriate secondary antibodies coupled to horseradish peroxidase in blocking buffer. Chemoluminescence signals were revealed using the WestDura Super Signal Kit (GE Healthcare Bio-Sciences, Chicago, IL) on a ChemiDoc XRS (Bio-Rad, Hercules, CA).
Statistical analyses
Statistical analyses were either performed with Student t test, analysis of variance, or Fisher test according to the datasets nature by using GraphPad Prism 8 software (GraphPad Software, San Diego, CA) and R. Normality tests were applied to determine if the datasets were eligible to either parametric or non-parametric tests. A 50% inhibitory concentration (IC50) values were determined with GraphPad Prism 8 using nonlinear regression models. Combination indexes were computed using Compusyn software and the Chou-Talalay method.43 Survival analyses were carried out with GraphPad Prism 8 with log-rank test. Cumulative incidence of relapse (CIR) and overall survival were defined as the time from complete remission to relapse censoring patients alive and in continuous complete remission at the time of last follow-up, and as the time from diagnosis to death censoring patients alive at last follow-up, respectively. Death in complete remission was considered as a competing event for CIR. Outcome comparisons between PRC2-altered and PRC2 WT patients were performed using a univariate Fine & Gray test for CIR and a Cox regression analysis for OS.
The following were used to indicate significant differences: P > .05 (not significant); *P < .05; **P < .01; ***P < .001.
Results
Incidence of PRC2 alterations in the GRAALL-2003-2005 Studies
We screened a total of 218 adult T-ALL patients prospectively treated in the GRAALL-2003 and 2005 protocols (see supplemental Figure 1 for a flowchart of the study). We combined targeted whole-exome sequencing and copy number information to identify genetic alterations of the PRC2 core members EZH2, EED, and SUZ12 in our cohorts. The incidence of PRC2 alterations in this cohort is 26% (56 altered patients for 162 WT; Figure 1A). SUZ12 is the PRC2 core member found altered in most cases (56%), whereas genetic anomalies in EED and EZH2 were less frequent (25% and 19%, respectively; Figure 1A). Of note, occurrences of cases harboring alterations of more than 1 PRC2 member were infrequent. The most predominant alterations of the PRC2 genes are deletions and truncating mutations, with frequent large chromosome deletions (Figure 1A-C). Genetic alterations of EED and SUZ12 were found to be mutually exclusive (supplemental Figure 2).
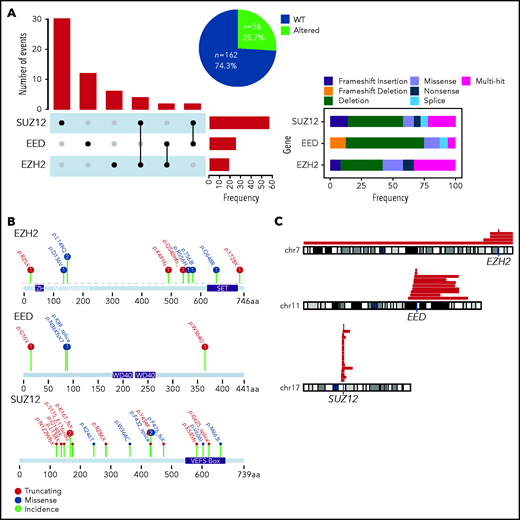
Incidence of PRC2 alterations in the GRAALL-2003-2005 studies. (A) The Upset plot indicates the incidence of events observed for each PRC2 gene and the different cooccurrences. The right panel indicates the type of genetic alterations and their frequencies. (B) Lollipop plots indicating the observed mutations for each PRC2 gene and their consequences. (C) The red bars map the observed chromosomal deletions involving the PRC2 genes in the GRAALL-2003-2005 studies.
Incidence of PRC2 alterations in the GRAALL-2003-2005 studies. (A) The Upset plot indicates the incidence of events observed for each PRC2 gene and the different cooccurrences. The right panel indicates the type of genetic alterations and their frequencies. (B) Lollipop plots indicating the observed mutations for each PRC2 gene and their consequences. (C) The red bars map the observed chromosomal deletions involving the PRC2 genes in the GRAALL-2003-2005 studies.
Oncogenetic landscape of PRC2-altered T-ALL
Integrated sequencing and DNA copy number variation information allowed to precise the oncogenetic landscape of PRC2-altered T-ALL (Figure 2; supplemental Figure 2). PRC2 loss of function associated with reduced mutational rates of TFs known to be frequently altered in T-ALL (BCL11B, LEF1), and in the cell-cycle regulator CDKN2A/B (Figure 2A; supplemental Figure 2). Conversely, PRC2-altered T-ALL harbor more frequent mutations of the IL7R/JAK/STAT pathway (IL7R, JAK1, JAK3, STAT5B) and Ras signaling regulator NF1. The mutational profile of PRC2-altered T-ALL suggests a preponderance of JAK/STAT and Ras signaling in this subgroup. Anomalies targeting EED and JAK3, EED and PHF6, EZH2 and DNM2, or SUZ12 and CDKN2A/B were found to be mutually exclusive.
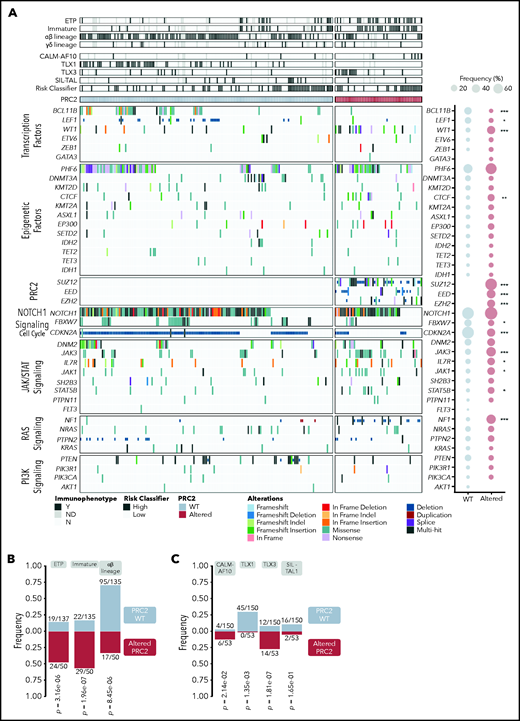
The oncogenetic landscape of PRC2-altered T-ALL. (A) Oncoplot depicting the genetic anomalies observed in PCR2 WT or altered T-ALL cases of the GRAALL-2003-2005 studies. For each case, their immunophenotype, the presence of defining alteration, and their relapse risk classifier are indicated. The ETP classification is separate from the other immunophenotypes; therefore, some T-ALL cases are both considered as ETP and immature or αβ in the analyses. Genes are classified by functional groups. The right panel indicates the overall frequency of alterations per gene in PRC2 WT or ALT patients. Statistical differences were compared by Fisher tests. (B) Bar graphs showing the significant association between PRC2 status and the maturation arrest stage. Annotations indicate the incidence of each maturation arrest stage among the entire cohort. The γδ stage is omitted because no significant difference is observed in this subgroup. PRC2 WT ETP cases are also considered as immature for 13/135 and αβ for 2/135 cases. For the PRC2-altered, ETP cases count as immature in 18/50 and αβ in 2/50. (C) Bar graphs displaying significant association between PRC2 status and the defining T-ALL genetic events. Annotations indicate the incidence of each event among the entire cohort. The exact P values from Fisher’s tests are indicated.
The oncogenetic landscape of PRC2-altered T-ALL. (A) Oncoplot depicting the genetic anomalies observed in PCR2 WT or altered T-ALL cases of the GRAALL-2003-2005 studies. For each case, their immunophenotype, the presence of defining alteration, and their relapse risk classifier are indicated. The ETP classification is separate from the other immunophenotypes; therefore, some T-ALL cases are both considered as ETP and immature or αβ in the analyses. Genes are classified by functional groups. The right panel indicates the overall frequency of alterations per gene in PRC2 WT or ALT patients. Statistical differences were compared by Fisher tests. (B) Bar graphs showing the significant association between PRC2 status and the maturation arrest stage. Annotations indicate the incidence of each maturation arrest stage among the entire cohort. The γδ stage is omitted because no significant difference is observed in this subgroup. PRC2 WT ETP cases are also considered as immature for 13/135 and αβ for 2/135 cases. For the PRC2-altered, ETP cases count as immature in 18/50 and αβ in 2/50. (C) Bar graphs displaying significant association between PRC2 status and the defining T-ALL genetic events. Annotations indicate the incidence of each event among the entire cohort. The exact P values from Fisher’s tests are indicated.
PRC2 alterations are not evenly represented across the different T-ALL subtypes. PRC2 loss-of-function anomalies are more frequently observed in the immunophenotypically described ETP-ALL cases (24/50, 48.0% vs 19/137, 13.9% in WT, P = 3.16 × 10⁻⁶; Figure 2B). Strikingly, frequencies of PRC2 alterations were elevated in non-ETP T-ALL (26/50, 52.0%), notably in immature (11/50, 22.0%) and αβ lineage (15/50, 30.0%) forms. Similar associations are found with oncogenic alterations that define T-ALL subgroups (Figure 2C). PRC2 alterations are more present in CALM-AF10 T-ALL, known to be of immature immunophenotype (6/53, 11.3% in PRC2-altered T-ALL vs 4/150, 2.7% for the WT cases, P = 2.14 × 10⁻²). Interestingly, there is a mutual exclusion between PRC2 alterations and TLX1 events. Conversely, PRC2 loss of function is more frequently observed in TLX3-overexpressing T-ALL (14/53, 26.4% in PRC2-altered T-ALL vs 12/150, 8.0% for the WT cases, P = .0014) in line with the observation that PRC2 genetic lesions are not rare in αβ-lineage T-ALL (Figure 2B).
The clonality of PRC2 mutations was heterogenous in our cohort, from subclonal to predominant detection (supplemental Figure 3A). To assess if PRC2 alterations could act as drivers of leukemogenesis, we evaluated their persistence in a series of 5 diagnosis-relapsed PRC2 ALT T-ALL samples. We found that for most of the tested samples, PRC2 alterations were found at similar variant allelic fractions in diagnosed and relapsed specimen. Only 1 patient had lost its PRC2 alterations at relapse, along with additional mutations indicating that the relapse could have emerged from a different clone (data not shown). Besides, we observed acquisitions of PRC2 alterations at relapse in patients who did not carry a PRC2 mutation at diagnosis (supplemental Figure 3C). Overall, we conclude that PRC2 loss-of-function alterations are conserved during the clonal evolution of the disease and may either constitute a driver event or provide a crucial advantage during leukemogenesis.
Clinical significance of PRC2 alterations in the GRAALL-2003-2005 Studies
We then evaluated the clinical impact of PRC2 loss of function in this series of 218 adult T-ALL treated within the GRAALL-2003-2005 studies. There was no statistical difference in the patient median age, sex ratio, and the central nervous system involvement in the PRC2-altered vs WT groups (Table 1). Regarding the treatment response, PRC2-altered patients had a poorer response to prednisone compared with WT patients (22/56, 39% vs 95/162, 59%; P = .013). Similarly, PRC2-altered patients had a worse bone marrow response than their WT counterparts (15/56, 27% vs 104/159, 65%; P < .0001). Despite similar complete remission rates, PRC2-altered patients presented a higher rate of positive MRD (>10−3) than the WT cases (19/34, 56% vs 11/88, 13%; P < .0001) at the end of the induction phase. Because prednisone and bone marrow responses, and MRD, were eligibility criteria for allogeneic hematopoietic stem cell transplant in first complete response, PRC2-altered patients were more frequently transplanted than the WT (30/54, 56% vs 48/147, 33%; P = .005). Neither the overall survival nor the cumulative incidence of relapse was different in PRC2-altered vs WT patients (Figure 3A-B). Censoring patient at transplant did not modify this observation (data not shown).
Patients clinical and biological characteristics
| Overall | Altered | WT | ||
|---|---|---|---|---|
| N = 218 | N = 56 | N = 162 | P | |
| Patient metrics | ||||
| Median age, y (range) | 30.6 (16.3-59.1) | 30.6 (17.6-58.1) | 30.8 (16.3-59.1) | .44 |
| Sex ratio (M/F) | 155/63 | 36/20 | 119/43 | .23 |
| Disease progression | ||||
| Median WBC, G/L (range) | 35.1 (0.9-645) | 32.4 (0.9-456) | 36.7 (2.8-645) | .17 |
| CNS infiltration | 24/218 (11%) | 5/56 (9%) | 19/162 (12%) | .81 |
| Treatment response | ||||
| Good prednisone response | 117/218 (54%) | 22/56 (39%) | 95/162 (59%) | .01 |
| Good bone marrow response | 119/215 (55%) | 15/56 (26%) | 104/159 (65%) | <0.001 |
| Complete remission | 201/218 (92%) | 54/56 (96%) | 147/162 (91%) | .25 |
| Postinduction MRD >10-3 | 30/122 (25%) | 19/34 (56%) | 11/88 (13%) | <.001 |
| HSCT among CR | 78/201 (39%) | 30/54 (56%) | 48/147 (33%) | .005 |
| Clinical outcomes | ||||
| 5-y CIR, % (95% CI) | 33% (27-40) | 37% (26-52) | 31% (24-39) | .34 |
| Hazard ratio (95% CI) | 0.84 (0.49-1.46) | 1.18 (0.68 to 2.05) | .55 | |
| 5-y OS, % (95% CI) | 65% (59-71) | 62% (48-74) | 67% (59-73) | .62 |
CI, confidence interval; CNS, central nervous system; CR, complete response; F, female; HSCT, hematopoietic stem cell transplant; M, male; WBC, white blood cell.
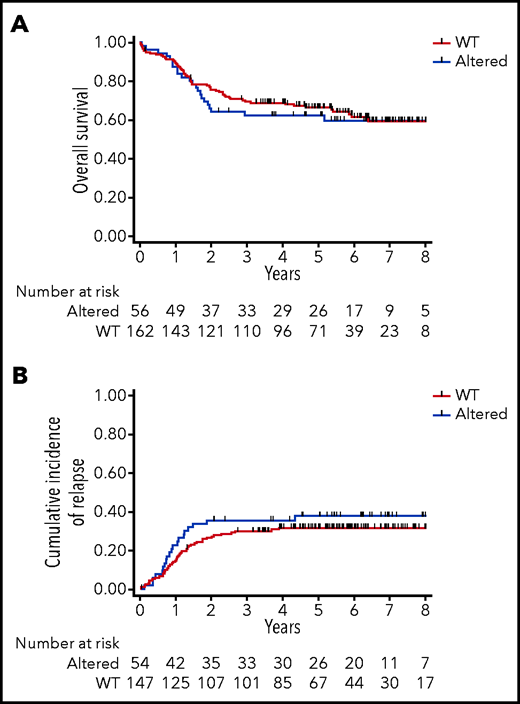
Clinical impact of PRC2 alterations in the GRAALL-2003-2005 studies. (A) Overall survival and (B) cumulative incidence of relapse in the GRAALL-2003-2005 studies. Red curves represent the PRC2-altered T-ALL, and blue curves the WT patients.
Clinical impact of PRC2 alterations in the GRAALL-2003-2005 studies. (A) Overall survival and (B) cumulative incidence of relapse in the GRAALL-2003-2005 studies. Red curves represent the PRC2-altered T-ALL, and blue curves the WT patients.
PRC2 loss of function elicits the reactivation of hematopoietic stem cells transcriptional programs
To better understand the biological features and the functional consequences of PRC2 loss of function in T-ALL, we performed bulk RNA-seq on 47/218 primary clinical samples (33/47 WT and 14/47 altered). Differential expression analysis allowed identification of 1252 genes significantly dysregulated in PRC2-altered T-ALL cases (Figure 4A). Unsupervised hierarchical clustering then identified 2 clusters that contain all the PRC2-altered T-ALL samples (Figure 4B). Gene set enrichment analysis reveal that these clusters are defined by an inflammatory signature, essentially driven by interferon-γ (IFN-γ) and IFN-γ transcriptomic responses (Figure 4C).
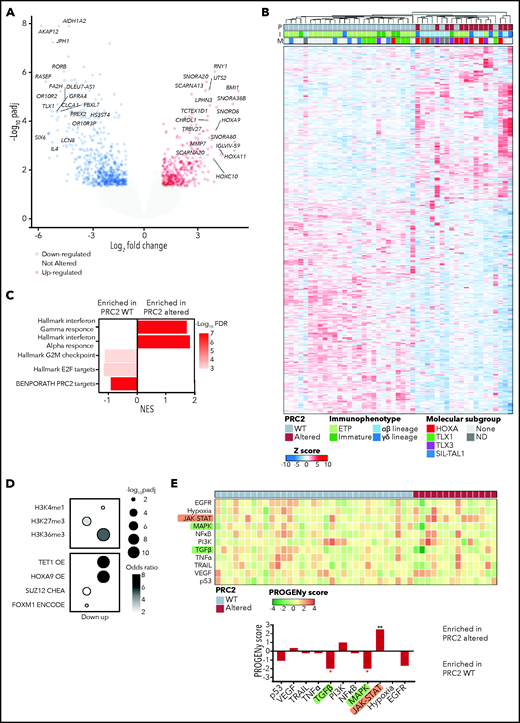
PRC2 loss of function elicits the reactivation of hematopoietic transcription programs. (A) Volcano plot analysis of differentially expressed genes in PRC2-altered (n = 14) vs PRC2 WT T-ALL (n = 33). (B) Heatmap representing the unsupervised hierarchical clustering of 47 T-ALL primary samples based on the expression of 1252 differentially expressed genes in PRC2-altered T-ALL (n = 14) vs WT samples (n = 33). The PRC2 status (P), the immunophenotype (I), and the molecular subgroup (M) of each primary sample is indicated. Dendrograms indicate clusters of patients. (C) Bar graphs of GSEA results representing gene sets enrichments in PRC2 WT or altered T-ALL. (D) Bubble plots depicting enrichment in genes associated with epigenetic marks (top) and transcription regulators (bottom). (E) Heatmap indicative of PROGENy pathway perturbation scores for each sample computed on RNA-seq data. The bottom bar plots indicate the mean score for each pathway and their significative enrichment in PRC2 WT or altered T-ALL.
PRC2 loss of function elicits the reactivation of hematopoietic transcription programs. (A) Volcano plot analysis of differentially expressed genes in PRC2-altered (n = 14) vs PRC2 WT T-ALL (n = 33). (B) Heatmap representing the unsupervised hierarchical clustering of 47 T-ALL primary samples based on the expression of 1252 differentially expressed genes in PRC2-altered T-ALL (n = 14) vs WT samples (n = 33). The PRC2 status (P), the immunophenotype (I), and the molecular subgroup (M) of each primary sample is indicated. Dendrograms indicate clusters of patients. (C) Bar graphs of GSEA results representing gene sets enrichments in PRC2 WT or altered T-ALL. (D) Bubble plots depicting enrichment in genes associated with epigenetic marks (top) and transcription regulators (bottom). (E) Heatmap indicative of PROGENy pathway perturbation scores for each sample computed on RNA-seq data. The bottom bar plots indicate the mean score for each pathway and their significative enrichment in PRC2 WT or altered T-ALL.
As expected, PRC2 target genes were downregulated in altered T-ALL (Figure 4C). Computed enrichment analyses on 1006 differentially expressed genes (354 overexpressed, 652 underexpressed; Figure 4A) using Enrichr then identified transcriptional programs associated with PRC2 loss of function.38 Among the genes overexpressed upon PRC2 loss of function, we found genes associated with the H3K4me1 and H3K36me3 epigenetic marks, indicative of a transcriptionally active state of the chromatin (Figure 4D). Additionally, consensus gene signatures driven by the transcription factor HOXA9, repressed by PRC2, and the DNA demethylase TET1 were found enriched in the PRC2 loss-of-function-induced overexpressed genes. Conversely, genes associated with the repressive H3K27me3 mark, deposited by PRC2, were found enriched in the downregulated gene pool and transcriptional signatures driven by SUZ12 and FOXM1. Furthermore, we computed pathway signaling activity using PROGENy.39 According to their mutational profile, PRC2-altered T-ALL exhibit elevated JAK-STAT signaling (Figure 4E). Additionally, reduced activities of the MAPK and transforming growth factor-β (TGF-β) pathways were observed. Of note, TGF-β downregulation could be an adaptative mechanism because it has been shown that uncontrolled TGF-β signaling in a defective PRC2 context is deleterious and causes developmental impairment.44
Altogether, our results indicate that PRC2 loss of function reshapes the transcriptional programs of T-ALL blasts. Of particular interest, we observed the reactivation of hematopoietic stem cell programs driven by TFs, usually silenced by PRC2 such as HOXA9. These results are in line with several reports highlighting the role of PRC2 in repressing hematopoietic stem/early progenitor cells transcriptional programs.23,45
PRC2 loss of function reshapes the epigenetic landscape of T-ALL
Given the transcriptional remodeling observed in PRC2-altered T-ALL, we hypothesized that it may be accompanied by a profound modification of the epigenetic landscape, as suggested by the RNA-seq data (Figure 4D). Particularly, 1 prediction is that, following PRC2 inactivation, loci where the repressive H3K27me3 mark was spread may be modified in favor of the opposite active H3K27ac mark.
We then investigated the distribution of H3K27me3 and H3K27ac peaks by ChIP-sequencing on a series of primary T-ALL samples. Strikingly, global distribution of H3K27me3 around the TSS regions was significantly reduced in all the tested PRC2 ALT samples (Figure 5A). Consistent results have been previously reported with PRC2 inactivating models in favor of a global reduction of H3K27me3 upon PRC2 loss of function.23,45-47 H3K27me3 signals were less detected in PRC2 ALT, irrespective of their localization in the genome (Figure 5C; supplemental Figure 4A). Conversely, H3K27ac signals were found enriched around the TSS regions in PRC2 ALT samples (Figure 5B), and globally enhanced when compared with PRC2 WT samples (Figure 5C; supplemental Figure 4A). Of note, H3K27me3 and H3K27ac peaks were predominantly detected in promoter regions (supplemental Figure 4B). Overall, these data suggest that PRC2 loss of function induces a shift in the epigenetic landscape in favor of H3K27ac distribution.

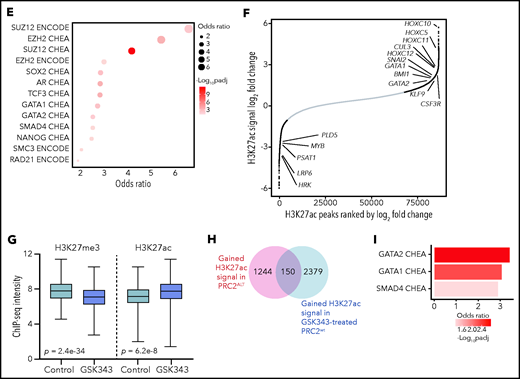
PRC2 loss of function reshapes the epigenetic landscape of T-ALL. (A) Distribution of H3K27me3 signal in 5-kb regions around the TSS (top); heatmap representing the same distribution (bottom). (B) Distribution of H3K27ac signal in 5-kb regions around the TSS (top); heatmap representing the same distribution (bottom). (C) Global H3K27me3 and H3K27ac ChIP-seq intensities in PRC2 WT or PRC2 ALT primary T-ALL samples. (D) Venn diagram illustrating the overlap between genes with significantly gained H3K27ac and reduced H3K27me3 signal at their promoter in PRC2 ALT T-ALL samples. (E) Bubble plot indicating the enrichment in transcription factors and regulators signatures among the 187-gene set from panel E. (F) Log2 fold change in occupancy of H3K27ac at 86 453 individual consensus peaks in T-ALL. The peaks are ranked in order of increasing log2 fold change. (G) Global H3K27me3 and H3K27ac ChIP-seq intensities in PRC2 WT primary T-ALL samples upon control or GSK343 3 µM treatment. (H) Venn diagram illustrating the overlap between genes with significantly enriched H3K27ac signal in PRC2 ALT T-ALL and genes significantly gaining H3K27ac signal in PRC2 WT T-ALL upon GSK343. (I) Bar plot indicating the enrichment in transcription factors signatures among the 150-gene set from panel H.
PRC2 loss of function reshapes the epigenetic landscape of T-ALL. (A) Distribution of H3K27me3 signal in 5-kb regions around the TSS (top); heatmap representing the same distribution (bottom). (B) Distribution of H3K27ac signal in 5-kb regions around the TSS (top); heatmap representing the same distribution (bottom). (C) Global H3K27me3 and H3K27ac ChIP-seq intensities in PRC2 WT or PRC2 ALT primary T-ALL samples. (D) Venn diagram illustrating the overlap between genes with significantly gained H3K27ac and reduced H3K27me3 signal at their promoter in PRC2 ALT T-ALL samples. (E) Bubble plot indicating the enrichment in transcription factors and regulators signatures among the 187-gene set from panel E. (F) Log2 fold change in occupancy of H3K27ac at 86 453 individual consensus peaks in T-ALL. The peaks are ranked in order of increasing log2 fold change. (G) Global H3K27me3 and H3K27ac ChIP-seq intensities in PRC2 WT primary T-ALL samples upon control or GSK343 3 µM treatment. (H) Venn diagram illustrating the overlap between genes with significantly enriched H3K27ac signal in PRC2 ALT T-ALL and genes significantly gaining H3K27ac signal in PRC2 WT T-ALL upon GSK343. (I) Bar plot indicating the enrichment in transcription factors signatures among the 150-gene set from panel H.
H3K27ac peaks were significantly enriched in PRC2-altered T-ALL (supplemental Figure 4C). Differential binding analysis of H3K27me3 and H3K27ac peaks was computed to identify genes with variant abundance of these epigenetic marks at their promoter regions in PRC2-altered T-ALL. A core of 187 genes was identified for which the promoter regions were both reduced in H3K27me3 and enriched in H3K27ac signals (Figure 5D). Network analyses revealed that these genes associated with PRC2 core components and master hematopoietic or stem transcription factors such as GATA1, GATA2, SOX2, and NANOG (Figure 5E). These results are consistent with our transcriptomic data indicating a reactivation of several hematopoietic programs associated with stem identity. Using unsupervised hierarchical clustering analysis performed on 4151 differentially acetylated loci (false discovery rate < 0.05), PRC2-altered and WT T-ALL were well separated in 2 distinct clusters (supplemental Figure 4D). Among the 2299 genes gaining H3K27ac peaks at their promoters (fold change ≥2, false discovery rate < 0.05; supplemental Figure 5A), there was a significant enrichment in genes silenced by the PRC2 complex including genes from the homeobox C cluster (Figure 5F; supplemental Figure 5B-E). Additionally, genes mapped to transcriptional programs governed by the developmental TFs BMI1, TWIST1, GATA1, and GATA2 gained H3K27ac signal (Figure 5F; supplemental Figure 5C). The polycomb group protein BMI1, a TWIST1 target, and GATA2 are repressed by PRC2 and have been reported to be reactivated following PRC2 loss of function.23 Indeed, the distribution of H3K27ac and H3K4me3 marks were increased at the loci of several key PRC2-silenced genes in PRC2-altered T-ALL samples (Figure 5D). Additionally, 571 genes presented a reduced H3K27ac distribution at their promoter regions upon PRC2 inactivation (supplemental Figure 5C). Genes associated with EZH2 were found in this subset, possibly indicating that PRC2 activity is not fully suppressed depending on the alteration type. A SMAD4 signature was also observed among these genes with reduced H3K27ac and could explain the reduced TGF-β activity observed in PRC2-altered patients (Figure 4E).
Epigenetic shifting can occur in response to various oncogenetic lesions. To elude this, we treated PRC2 proficient T-ALL PDX with EZH2 inhibitor GSK343 and repeated ChIP-seq experiments on the H3K27me3 and H3K27ac marks. Similar to the data obtained from primary T-ALL samples, PRC2 inhibition resulted in a marked reduction in global H3K27me3 distribution and signal and in an enrichment of H3K27ac (Figure 5G; supplemental Figure 4E). A substantial overlap of 150 genes with net gain in H3K27ac at their promoters was observed when comparing with the data generated from the patients. Network analyses carried out of this subset revealed significant associations with GATA1, GATA2, and SMAD4 transcription factors (Figure 5I). Hence, these data reinforce the relevance of the reactivation of hematopoietic programs upon PRC2 loss of function.
The epigenetic switch from H3K27me3 to H3K27ac should be a result of PRC2 loss of function and an increased histone acetyltransferase (HAT) activity. We thus evaluated the expression of a set of HATs in our cohort. Several HAT genes including CREBBP, NCOA1, and KAT7 were upregulated in PRC2-altered T-ALL (supplemental Figure 5F), in favor of an increased reacetylation of histone residues at certain loci silenced by PRC2. Taken together, our results indicate that PRC2 loss of function deeply reshapes the epigenetic landscape of T-ALL, inducing the spreading of H3K27ac and the reactivation of early hematopoietic programs repressed by PRC2.
PRC2 loss of function sensitizes T-ALL to BET protein inhibition
The global reacetylation of H3K27 and the subsequent reactivation of silenced transcriptional programs led us to envision BET proteins as key epigenetic effectors in PRC2-altered T-ALL. Critically, BET proteins regulate most of the TFs induced by PRC2 inactivation. BET inhibition functionally suppresses the activity of GATA1,48 GATA2,49 and TWIST1.50 Additionally, the BET proteins are critical regulators of both SOX2 and NANOG.51-53 One prediction could be that PRC2-altered T-ALL have greater sensitivity to BET inhibition. To ascertain this, we evaluated PDX sensitivity to BET inhibitor JQ1 ex vivo.54 PRC2-altered T-ALL PDX cell viability was significantly reduced upon exposure to JQ1 compared with WT PDX (Figure 6A). A significant difference in JQ1 IC50 was observed among the 2 groups (664.3 nM ± 115 in WT PDX vs 291.5 ± 54.7 nM in PRC2-altered PDX, P = .005; Figure 6B). We then assessed whether PRC2 inhibition in the absence of PRC2 alteration could sensitize to BET targeting. To this end, we tested the EZH2 inhibitor GSK343 in combination with JQ1 in PRC2-proficient T-ALL PDX. EZH2 inhibition reduced the detection of the H3K27me3 mark, whereas H3K27ac was readily increased in a series of T-ALL cell lines (supplemental Figure 6A), thus mimicking the epigenetic switch observed in primary T-ALL samples (Figure 4). Although EZH2 inhibition alone did not alter T-ALL survival (supplemental Figure 6B), it efficiently sensitizes WT PRC2 PDX to BET inhibition (Figure 6C). Similar results were obtained on T-ALL cell lines (supplemental Figure 6C). This sensitization was characterized by a significant decrease in JQ1 IC50 induced by EZH2 inhibition (Figure 6D).
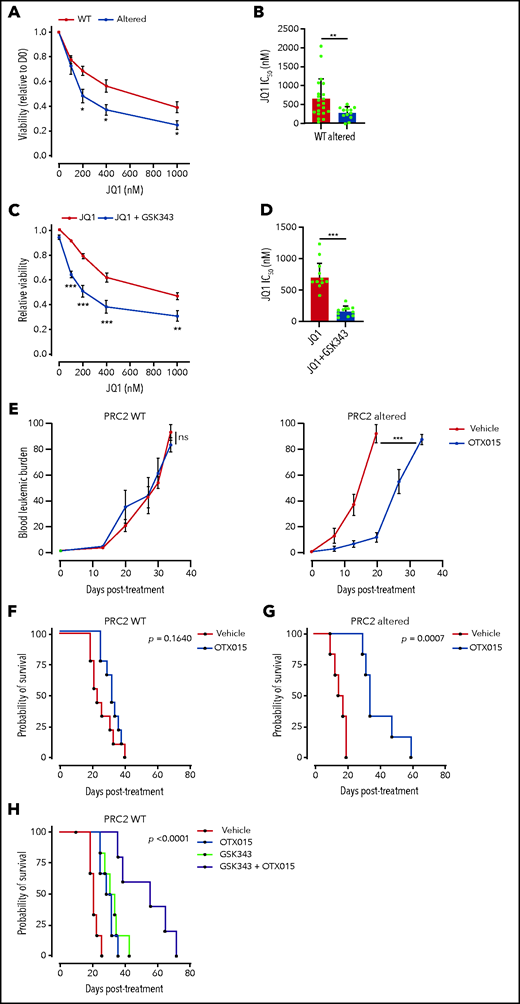
PRC2 loss of function sensitizes to BET protein inhibition. (A) Viability of T-ALL PDX measured after 3 days of treatment with JQ1 at the indicated doses. Means and SEM are plotted (WT n = 21, altered n = 12). (B) Bar graph of the computed JQ1 IC50 for each PDX. Means and SEM are plotted. Each dot represents a replicate (WT n = 21, altered n = 12). (C) Viability of T-ALL PDX measured after 3 days of treatment with JQ1 alone or combined with GSK343 (3 µM) at the indicated doses. Means and SEM are plotted (WT, altered: n = 10). (D) Bar graph of the computed JQ1 IC50 for each PDX. Means and SEM are plotted. Each dot represents a replicate (WT n = 10, altered n = 10). (E) Blood leukemic burden evaluated by flow cytometry of mice xenografted with either a PRC2 WT PDX (n = 3 per arm) or altered T-ALL PDX (n = 3 per arm) following 2 cycles of 5-day oral gavage with vehicle or OTX015 (25 mg/kg). These data are obtained from 1 PDX per group and are representative of the entire dataset. (F) Survival curves of mice xenografted with either PRC2 WT PDX (n = 3, 3 mice/arm/PDX) or altered T-ALL PDX (n = 3, 3 mice/arm/PDX) following 2 cycles of 5-day oral gavage with vehicle or OTX015 (25 mg/kg). (G-H) Survival curves of mice xenografted with PRC2 WT PDX (n = 5 2, 3 mice/arm/PDX) following 2 cycles of 5-day oral gavage with vehicle, OTX015 (25 mg/kg), intraperitoneal injection of GSK343 (5 mg/kg) (G), or a combination of the two (H).
PRC2 loss of function sensitizes to BET protein inhibition. (A) Viability of T-ALL PDX measured after 3 days of treatment with JQ1 at the indicated doses. Means and SEM are plotted (WT n = 21, altered n = 12). (B) Bar graph of the computed JQ1 IC50 for each PDX. Means and SEM are plotted. Each dot represents a replicate (WT n = 21, altered n = 12). (C) Viability of T-ALL PDX measured after 3 days of treatment with JQ1 alone or combined with GSK343 (3 µM) at the indicated doses. Means and SEM are plotted (WT, altered: n = 10). (D) Bar graph of the computed JQ1 IC50 for each PDX. Means and SEM are plotted. Each dot represents a replicate (WT n = 10, altered n = 10). (E) Blood leukemic burden evaluated by flow cytometry of mice xenografted with either a PRC2 WT PDX (n = 3 per arm) or altered T-ALL PDX (n = 3 per arm) following 2 cycles of 5-day oral gavage with vehicle or OTX015 (25 mg/kg). These data are obtained from 1 PDX per group and are representative of the entire dataset. (F) Survival curves of mice xenografted with either PRC2 WT PDX (n = 3, 3 mice/arm/PDX) or altered T-ALL PDX (n = 3, 3 mice/arm/PDX) following 2 cycles of 5-day oral gavage with vehicle or OTX015 (25 mg/kg). (G-H) Survival curves of mice xenografted with PRC2 WT PDX (n = 5 2, 3 mice/arm/PDX) following 2 cycles of 5-day oral gavage with vehicle, OTX015 (25 mg/kg), intraperitoneal injection of GSK343 (5 mg/kg) (G), or a combination of the two (H).
Given these promising ex vivo results, we examined whether BET targeting could efficiently target PRC2-altered T-ALL in vivo. To ascertain this, mice engrafted with PRC2 WT or altered PDX were treated with the orally available BET inhibitor OXT015, evaluated in clinical trials.55 Although no difference in the leukemic burden was observed in PRC2-proficent PDX, BET inhibition delayed disease progression in PRC2-altered PDX (Figure 6E). Importantly, single-agent OTX015 treatment also resulted in a significantly prolonged survival of PRC2-altered PDX with moderate effect in the WT (Figure 6F-G). Although the response in PRC2 proficient T-ALL PDX was modest, we wondered if PRC2 inhibition could synergize in vivo with BET protein targeting. Thus, we treated mice carrying PRC2 WT PDX with EZH2 inhibitor GSK343, OTX015, and a combination of both. Whereas single agents presented a limited efficacy, the combined treatment resulted in a net improvement of the mice survival (Figure 6H). These data suggest that the cotargeting of PRC2 components and BET proteins can be effective in T-ALL. Taken together, our data indicate that PRC2 loss of function elicits an acquired vulnerability to BET inhibition.
Discussion
PRC2 loss of function is a recurrent feature of T-ALL.12-15 Strikingly, although ETP-ALL harbor frequent PRC2 alterations, these genetic lesions are also found in non-ETP forms, including αβ lineage T-ALL, and do not represent rare events. These results reveal for the first time a strong association between PRC2 anomalies and TLX3-driven T-ALL, and a mutual exclusion with TLX1+ cases (Figure 2C). T-ALL with elevated TLX1 or TLX3 expression harbor similar genetic alterations, and have overlapping transcriptional profiles and target gene sets. In this study, we report PRC2 alterations as a rare example of genetic lesions that segregate TLX1+ vs TLX3+ T-ALL. This observation suggests an unreported oncogenic cooperation between PRC2 loss of function and TLX3. It has been proposed that TLX3+ T-ALL are heterogeneous and may contain more immature forms. Further investigation is required to precise the impact of PRC2 alterations in a TLX3+ context and unravel putative cooperative mechanisms.
This study has identified profound modifications of the epigenetic landscape and transcriptional state of PRC2-inactivated T-ALL blasts. We found that PRC2 loss of function results in a global reduction in H3K27me3 levels and a redistribution of H3K27ac at multiple loci repressed by PRC2 (Figures 4; supplemental Figures 4 and 5). These results are in line with multiple reports, highlighting the crucial role of PRC2 in the distribution and the maintenance of a balanced epigenetic landscape.23,45-47 This remodeling reveals the reactivation of stem cell programs found in ETP-ALL, conveying poor prognosis.12,56 Refractory or relapsed T-ALL have dismal clinical outcomes because of limited therapeutic absence of response to salvage therapies. No targeted treatment is currently available in the relapsed/refractory setting, in contrast to B-ALL (bispecific T-cell engager blinatumomab or chimeric antigen receptor T cells for CD19-positive patients, or drug-conjugated antibody inotuzumab for CD22+ cases). Difficulties for the development of chimeric antigen receptor T cells for T-cell malignancies have been already described.57 To alleviate this, 1 strategy is to stratify patients with shared clinical, molecular, and functional features that can be pharmacologically targeted. PCR2-altered T-ALL appears in this study as a separated subgroup with a specific genetic and epigenetic profile, revealing a targetable vulnerability to BET proteins.
PRC2 loss of function associates with aberrant activation of the JAK-STAT signaling pathway in T-ALL (Figures 2 and 4E), consistent with previous reports.23,34 In addition, our transcriptomics analyses have shown enriched inflammatory signatures driven by IFN-α and IFN-γ, 2 master regulators of the JAK-STAT pathway. PRC2 has been reported to regulate the interferon response in multiple systems.47,58,59 These observations led us to hypothesize that PRC2-inactivated T-ALL might be susceptible to respond to JAK inhibitors. To evaluate this, we treated T-ALL PDX ex vivo with the JAK1/JAK2 inhibitor ruxolitinib.60 Strikingly, the tested PDX poorly responded to JAK inhibition, regardless of their PRC2 status (supplemental Figure 4A). BET protein inhibition has been shown as an efficient strategy to target JAK/STAT-driven myeloproliferative neoplasms.61 Notably, combined BET/JAK inhibition successfully resolves myeloproliferative neoplasm-associated inflammation. We investigated whether BET inhibition could cooperate with JAK targeting in PRC2-altered T-ALL. Although a modest synergistic effect of JQ1 and ruxolitinib was observed in PRC2 WT PDX, the drug combination was rather antagonist in the tested PRC2-altered PDX (supplemental Figure 4B-C). Moreover, the combination of BET and JAK inhibitors seems deleterious in PRC2-altered T-ALL. Our results suggest that PRC2 inactivation does not predict T-ALL sensitivity to JAK inhibition. A recent study revealed that EZH2 deletion leads to higher STAT3 activation and poor response to ruxolitinib.23 Importantly, PRC2 inactivation leads to IL6R hyperresponsiveness and drive JAK/STAT signaling. IL6R is also found to be more expressed in ETP-ALL.12 This context can elicit resistance to JAK inhibition. Recently, a study identified that SUZ12 alteration cooperates with JAK3 mutant to promote T-ALL development.45 This subset is T-ALL develops aggressively and is sensitive to PI3K/Akt/mTOR signaling.
The epigenetic remodeling provoked by PRC2 loss of function contributes to the reactivation of stem cell transcriptional programs. This constitutes a hallmark of ETP-ALL and is also present in immature non-ETP T-ALL subsets (Figure 4).12 Critically, another study has reported that EZH2 inactivation induces a transcriptional program associated with ETP/immature T-ALL, with the reactivation of GATA2 and MYC.62 Of note, no upregulation of MYC or its targets was found significant in our dataset (data not shown). BET proteins have long been known to be critical regulators of the recruitment and the function of hematopoietic TFs.63 Notably, BET inhibition functionally suppresses the activity of GATA1,48 GATA2,49 and TWIST1.50 Additionally, the BET proteins are critical regulators of both SOX2 and NANOG.51-53 Furthermore, BET proteins can interact with acetylated TFs such as TWIST1, GATA1, and NFkB.64,65 In acute myeloid leukemia, BET proteins directly bind the master hematopoietic TFs PU.1, ERG, FLI1, C/EBPa, C/EBPb, and MYB to support their activity and leukemia maintenance.63 Interestingly, we found HOXC10 as the top gene gaining H3K27ac signal upon PRC2 inactivation (Figure 5). This epigenetic remodeling is accompanied by increased expression of HOXC10 in PRC2-altered T-ALL (supplemental Figure 5). A recent publication reported that HOXC10 is aberrantly expressed in Ras-driven non-small-cell lung cancer because of PRC2 defects and confers sensitivity to BET protein inhibition.66 Given their broad roles in cancer biology, BET proteins are emerging targets for therapy.24,25 Not surprisingly, PRC2-proficient T-ALL does respond to BET inhibitors (Figure 6). This can be explained by additional oncogenetics that can create vulnerabilities to BET targeting. Multiple oncogenic pathways are altered by BET inhibition including NOTCH1,67 c-MYC,68 JAK-STAT,69 or RAS.66 In T-ALL, several lesions drive aberrant HOX genes expression. In addition to this, our results indicate that PRC2-altered T-ALL present a higher sensitivity to BET protein inhibition. Although biomarkers of sensitivity to BET targeting have yet to be identified and are critical for the forthcoming clinical trials, PRC2 loss of function and subsequent HOXC10 dysregulation are promising candidates that should be further evaluated.
More in-depth studies are required to fully understand the functional dependencies of PRC2-altered T-ALL on BET proteins. However, a growing body of evidence highlights the cooperation between PRC2 loss of function and oncogenic pathways such as JAK/STAT and Ras signaling. Critically, BET protein inhibition has demonstrated its efficacy in JAK/STAT- or Ras-driven malignancies.23,26,66,70 Altogether, this study provides auspicious clinical evidence that the cotargeting of PRC2 components and BET proteins can be effective in T-ALL and other hematological malignancies such as myelodysplastic syndrome or acute myeloid leukemia.
Acknowledgments
This manuscript was written on behalf of The Group for Research on Adult Acute Lymphoblastic Leukemia (GRAALL), which includes the former France-Belgium Group for Lymphoblastic Acute Leukemia in Adults (LALA), the French Western-Eastern Group for Lymphoblastic Acute Leukemia (GOELAL), and the Swiss Group for Clinical Cancer Research (SAKK). The authors thank all participants in the GRAALL-2003 and GRAALL-2005 study groups for collection and provision of data and patient samples. The authors also thank Marie-Christine Béné, Mathilde Hunault-Berger, and Etienne Lengliné for their constructive revision of the manuscript.
The GRAALL-2003 study was sponsored by the Hôpitaux de Toulouse and the GRAALL-2005 study by the Assistance Publique–Hôpitaux de Paris. The SAKK was supported by the Swiss State Secretariat for Education, Research and Innovation (SERI) Switzerland. G.P.A. is supported by a grant from Fondation de France (Post-Doctorate Research Fellowship). M.E.D. is supported by CARPEM (CAncer Research and PErsonalized Medicine). The Necker laboratory is supported by the Association “Fédération Leucémie Espoir,” the Association “Force Hémato,” ITMO_C15075KS “Domaine de l’Épigénétique et Cancer,” the Association pour la Recherche contre le Cancer (Equipe ARC Labellisée), and a grant from the Institut National du Cancer (INCa) PLBIO 2018-00253.
Authorship
Contribution: G.P.A. provided conceptualization, methodology, investigation, analysis, validation, data curation, visualization, supervision, writing of the original draft preparation, and writing of the revised draft preparation; M.K. undertook analysis, writing (reviewing and editing); M.S. provided data curation, analysis, validation, and writing (reviewing and editing); C.L.S. undertook investigation, writing (reviewing and editing); A.C. undertook investigation; M.-É.D. provided writing (reviewing and editing); G.C. undertook analysis; C.G. provided resources and writing (reviewing and editing); F.H. provided resources and writing (reviewing and editing); V.L. provided resources and writing (reviewing and editing); H.D. provided resources and writing (reviewing and editing); S.S. undertook investigation, validation, and writing (reviewing and editing); P.R. provided writing (reviewing and editing); N.B. provided resources, data curation, analysis, visualization, and writing (reviewing and editing); and V.A. undertook conceptualization, methodology, validation, resources, data curation, writing (reviewing and editing), supervision, project administration, and funding acquisition.
Conflict-of-interest disclosure: The authors declare no competing financial interests.
Correspondence: Vahid Asnafi, Hôpital Necker Enfants-Malades, Laboratoire d’Onco-Hématologie, 149 rue de Sèvres, 75015 Paris, France; e-mail: vahid.asnafi@aphp.fr.
There is a Blood Commentary on this article in this issue.
The online version of this article contains a data supplement.
The publication costs of this article were defrayed in part by page charge payment. Therefore, and solely to indicate this fact, this article is hereby marked “advertisement” in accordance with 18 USC section 1734.

This feature is available to Subscribers Only
Sign In or Create an Account Close Modal