

Key Points
BTKis, independent of ITK inhibition, downregulate immunosuppressive effectors in CLL cells.
CD19/CD3-bispecific antibody-induced cytotoxicity is enhanced in PBMCs from patients treated with BTKis.

Abstract
Bruton tyrosine kinase inhibitors (BTKis) are a preferred treatment of patients with chronic lymphocytic leukemia (CLL). Indefinite therapy with BTKis, although effective, presents clinical challenges. Combination therapy can deepen responses, shorten treatment duration, and possibly prevent or overcome drug resistance. We previously reported on a CD19/CD3-bispecific antibody (bsAb) that recruits autologous T-cell cytotoxicity against CLL cells in vitro. Compared with observations with samples from treatment-naïve patients, T cells from patients being treated with ibrutinib expanded more rapidly and exerted superior cytotoxic activity in response to the bsAb. In addition to BTK, ibrutinib also inhibits interleukin-2 inducible T-cell kinase (ITK). In contrast, acalabrutinib, does not inhibit ITK. Whether ITK inhibition contributes to the observed immune effects is unknown. To better understand how BTKis modulate T-cell function and cytotoxic activity, we cultured peripheral blood mononuclear cells (PBMCs) from BTKi-naive and ibrutinib- or acalabrutinib-treated CLL patients with CD19/CD3 bsAb in vitro. T-cell expansion, activation, differentiation, and cytotoxicity were increased in PBMCs from patients on treatment with either BTKi compared with that observed for BKTi-naïve patients. BTKi therapy transcriptionally downregulated immunosuppressive effectors expressed by CLL cells, including cytotoxic T lymphocyte-associated antigen 4 (CTLA-4) and CD200. CTLA-4 blockade with ipilimumab in vitro increased the cytotoxic activity of the bsAb in BTKi-naïve but not BTKi-treated PBMCS. Taken together, BTKis enhance bsAb-induced cytotoxicity by relieving T cells of immunosuppressive restraints imposed by CLL cells. The benefit of combining bsAb immunotherapy with BTKis needs to be confirmed in clinical trials.
Introduction
B-cell receptor signaling and tumor microenvironment crosstalk are pivotal to chronic lymphocytic leukemia (CLL) pathogenesis.1 Bruton tyrosine kinase (BTK) is essential for B-cell receptor signal transduction and BTK inhibitors (BTKis) have become a preferred treatment of patients with CLL.2 Ibrutinib, the first-in-class BTKi, covalently attaches to a cysteine residue at position 481 (C481) leading to sustained inhibition of BTK-dependent signaling. In randomized trials, in comparison with multiagent chemoimmunotherapy, ibrutinib with or without the addition of rituximab, improved progression-free and, in some studies, overall survival.3,4 Ibrutinib is dosed orally once daily and continued indefinitely. Deep remissions are uncommon, but on continuous therapy, not a prerequisite for durable response.5 Ibrutinib also inhibits interleukin-2, inducible T-cell kinase (ITK), and TEC at plasma concentrations achieved with standard therapy. Additional covalent BTKis have been developed, including acalabrutinib, zanubrutinib, and tirabrutinib.6 Acalabrutinib is US Food and Drug Administration–approved for CLL.7,8 In contrast to ibrutinib, acalabrutinib is more specific for BTK and does not inhibit ITK and TEC.9 Efficacy data for these 2 BTKis appear comparable, whereas the side effect profiles may differ.4,7
The most common reasons for treatment discontinuation of BTKis for CLL are disease progression and side effects.7,8,10-12 Acquired resistance to BTKis has been linked to mutations of the C481 residue in BTK that prevent covalent binding.5,12-14,15-17 Although the overall safety profile of BTKis is quite favorable, continuous therapy has been associated with chronic low-grade adverse events and concerns over compliance. Combination therapy can deepen response and shorten treatment duration.18,19
An intriguing effect of treatment with ibrutinib is improved T-cell function. In treatment-naïve CLL patients, T cells are dysfunctional with an inverted CD4:CD8 ratio, express exhaustion markers, have impaired mitochondrial functions, and form poor T-cell immune synapses.20,21 Ibrutinib modulates T-cell polarization and activation.22,23 In part based on a murine model, ibrutinib was reported to promote T helper 1 (Th1) polarization, an effect attributed to ITK inhibition.24 We previously reported on a CD19/CD3-bispecific antibody (bsAb) that recruits autologous T-cell cytotoxicity against CLL cells in vitro. Compared with observations with samples from treatment-naïve patients, T cells from patients being treated with ibrutinib expanded more rapidly and exerted superior cytotoxic activity in response to the bsAb.25 In patient-derived xenografts, the CD19/CD3 bsAb eliminated primary CLL cells from patients with disease progression on ibrutinib. Likewise, in xenograft models, ibrutinib enhanced chimeric antigen receptor T-cell function and prolonged survival of tumor-bearing mice.26 Taken together, these preclinical data suggest that ibrutinib could enhance antitumor effects of T cell–recruiting immunotherapies. The mechanisms underlying this increased cytotoxicity are incompletely understood. In particular, whether ITK inhibition is required for improved T-cell function has important implications for clinical translation.
Here, we used peripheral blood mononuclear cells (PBMCs) collected from BTKi-naïve patients and from patients treated with either ibrutinib or acalabrutinib to investigate the impact of BTKi therapy on the efficacy of bispecific antibody therapy in CLL and the dependent T-cell responses.
Patients, materials, and methods
Patients and clinical samples
PBMCs were obtained from CLL patients enrolled in phase 2 clinical trials investigating single-agent ibrutinib (NCT01500733) or acalabrutinib (NTC02337829) and/or in an observational study (NCT00923507). Patient characteristics are summarized in Table 1; sample usage is listed in supplemental Table 1 on the Blood Web site. Samples were obtained from patients who had never been treated with a BTKi (BTKi-naïve) and patients on active therapy with a BTKi, either ibrutinib 420 mg once daily or acalabrutinib 200 mg once daily or 100 mg twice daily, as previously described.8,10 All 3 studies were approved by the institutional review board, and written informed consent was obtained in accordance with the Declaration of Helsinki. Samples from BTKi-responding patients were selected based on availability of viably frozen PBMCs after 5-15 months on BTKis.
Patient characteristics
| No. or median (% or range) | ||
|---|---|---|
| BTKi-naïve (n = 32) | On BTKi (n = 45) | |
| Age | 65 (48-76) | 67 (39-81) |
| Sex | ||
| Female | 16 (50%) | 19 (42%) |
| Male | 16 (50%) | 26 (58%) |
| Prior therapy | ||
| No | 24 (75%) | 25 (56%) |
| Yes, relapsed | 8 (25%) | 20 (44%) |
| IGHV | ||
| Mutated | 15 (47%) | 15 (33%) |
| Unmutated | 13 (41%) | 29 (65%) |
| Missing | 4 (12%) | 1 (2%) |
| FISH | ||
| del 17p | 4 (12%) | 14 (31%) |
| ALC | 69.7 (4.4-262.4) | 11.7 (1.0-106.3) |
| T cell: CLL cell | 0.04 (0.01-1.92) | 0.15 (0.02-7.11) |
All characteristics given apply to the time of sample collection for the study. Patients on a BTKi had been treated for at least 5 months, 28 (62%) were on ibrutinib and 17 (38%) on acalabrutinib. Patients (n = 19) who contributed samples at baseline and again while on the BTKi are included in both groups. FISH, fluorescent in situ hybridization; IGHV, immunoglobulin heavy chain.
Bispecific antibodies
In vitro cell cultures
PBMCs from CLL patients were isolated by density-gradient centrifugation (Ficoll lymphocyte separation media; ICN Biomedicals) and viably frozen in 90% fetal bovine serum (FBS), 10% dimethyl sulfoxide (Sigma) in liquid nitrogen. Cryopreserved PBMCs were thawed and plated at 3 × 10⁶ cells/mL in 24-well plates in RPMI 1640 medium (Gibco) containing 10% FBS, 1% penicillin-streptomycin, and 50 μM β-mercaptoethanol (Sigma). HER2/CD3 or CD19/CD3 at 6.6 nM and 60 IU/mL of interleukin-2 were added to cultures. Cells incubated at 37°C (5% CO2) were harvested after 0, 3, or 5 days. Antibody effects were normalized to the viability in media-only control cultures.
Where indicated, PBMCs from the same patient obtained at baseline and on BTKi therapy were mixed 1:1; alternately, 1 sample was labeled with CellTrace Violet Cell Proliferation Dye (VPD) (Thermo Fisher). When testing healthy donor T cells, CLL PBMCs were first depleted of CD3+ T cells using CD3 microbeads (Miltenyi Biotech).
CTLA-4 blockade
PBMCs from CLL patients were placed in 24-well plates at 3 × 10⁶ cells/mL in medium alone, or with addition of HER2/CD3 or CD19/CD3 bsAbs at 6.6 nM. Cells were cultured for 3 and 5 days at 37°C with or without the addition of 50 μg/mL of the anti-cytotoxic T lymphocyte-associated antigen 4 (CTLA-4) antibody ipilimumab (Selleckchem). For experiments with healthy donor T cells, CLL PBMCs were depleted of autologous CD3+ T cells using CD3 microbeads (Miltenyi Biotech) and cultured with or without the addition of 50 μg/mL ipilimumab for 24 hours, washed, and then cocultured with allogeneic T cells. CLL cell viability was measured by flow cytometry.
In vitro treatment with BTKis
CLL PBMCs were depleted of autologous CD3+ T cells using CD3 microbeads (Miltenyi Biotech) and cultured with or without the addition of ibrutinib or acalabrutinib (1 μM), for 24 hours, and then cocultured with healthy donor T cells. CLL cell viability and CTLA-4 expression were measured by flow cytometry.
Flow cytometry
Cells were stained with commercial antibodies listed in supplemental Table 2. CLL cells were identified as CD8−CD4−/CD5+CD20+; T cells were identified as either CD8+ or CD4+. Cell viability was assessed using LIVE/DEAD fixable violet stain (Invitrogen). Specific killing was calculated as follows: ([untreated viability – treated viability]/[untreated viability] × 100). Absolute live cell counts were determined using AccuCount particles (Spherotech). Target CLL to effector T-cell ratios were determined based on frequencies of live cells using the formula: (%CLL/[CD8+%CD4+%]). Th1 and Th2 polarization of CD4+ T cells was assessed based on CCR6 and CXCR3 expression as previously described.28
For deep immunophenotyping, cells were preincubated with Aqua Blue dead cell exclusion dye (Invitrogen), followed by surface staining. Flow buffer was Dulbecco's phosphate-buffered saline, 1% FBS, and 0.02% sodium azide. Cells were fixed using 0.5% paraformaldehyde. Intracellular staining for granzyme B, Ki-67, and CTLA-4 expression was performed using Foxp3/Transcription factor staining buffer set (Invitrogen). All antibodies were titrated before use and fluorescence minus one controls were used. Samples were acquired on a LSRFortessa (BD Biosciences). Experiments were analyzed with FlowJo (Version 10; TreeStar).
Luminex cytokine immunoassay
Supernatant from cultured PBMCs at day 5 of CD19/CD3 treatment was analyzed with the Milliplex MAP Human High Sensitivity T Cell Magnetic Bead Panel (Millipore Corporation). A 96-well microplate was washed for 10 minutes with the provided 1X wash buffer containing 0.05% ProClin. Standard and quality controls were reconstituted in culture media; standard curves were generated by serial 1:4 dilutions. Supernatant was diluted twofold in assay buffer, mixed with 25 μL of bead mixture, and incubated for 18 hours at 4°C on a plate shaker. Detection antibodies were incubated at 20°C for 1 hour, followed by streptavidin-phycoerythrin for 30 minutes. Analysis was performed with Luminex 200 software using a 5-parametric curve-fitting method to calculate analyte concentrations.
RNA-sequencing analysis
Previously reported RNA sequencing data from patients treated with ibrutinib (dbGaP #26784)8,29 or acalabrutinib (Gene Expression Omnibus GSE136634)8,29 were used to analyze changes in the expression of immunomodulatory genes described by Thorsson et al.30 Paired gene-level differential analysis was conducted as described in Sun et al.8
Clustering of samples by T-cell response to bsAb
T-cell activation in response to the CD19/CD3 bsAb was assessed by flow cytometry in 39 patient samples using 11 markers (supplemental Table 2). The fold change in frequencies of positive cells between CD19/CD3 bsAb and medium control was, log2 transformed, median-centered and analyzed by linkage clustering using GeneCluster 3.0, and heat maps were generated using JavaTreeView 3.0 (http://bonsai.hgc.jp/~mdehoon/software/cluster/software.htm).
Statistical analysis
To calculate statistical significance between the different patient groups, the Mann-Whitney U test was used. Paired analysis using paired Wilcoxon matched-pairs signed-rank test or paired Student t test was used to compare response to different treatments in individual patients, and to compare baseline and BTKi-treated samples from the same patient. Data were analyzed with GraphPad Prism 7 software.
Results
Treatment of CLL patients with a BTKi increases cytotoxicity of CD19/CD3 bsAb in vitro
To investigate interactions between BTKi therapy and the cytotoxicity of autologous T cells, we cultured CLL PBMCs from BTKi-naïve and BTKi-treated patients with the CD19/CD3 bsAb or with the nontargeting control HER2/CD3 bsAb in vitro. Patient characteristics are summarized in Table 1. Of 32 BTKi-naïve patients, 24 (75%) had never been treated and 8 (25%) had relapsed disease. Of 45 BTKi-treated patients, 25 (56%) received a BTKi in first line and 20 (44%) for relapsed CLL, 28 (62%) were treated with ibrutinib and 17 (38%) received acalabrutinib.8,10
We measured cell viability after 3 and 5 days using flow cytometry and observed time-dependent killing of CLL cells in the presence of CD19/CD3 bsAb in both BTKi-naïve and BTKi-treated patients (Figure 1). After 3 days with the CD19/CD3 bsAb, the median CLL specific kill rate was 57% (interquartile range [IQR], 37-85) in BTKi-treated patient samples compared with 19% (IQR, 2-57) for BTKi-naïve patient samples (P = .01; Figure 1A). After 5 days, the median CLL-specific kill rate was 90% (IQR, 78-98) and 62% (IQR, 8-89), respectively (P = .006; Figure 1A). The HER2/CD3 nontargeting bsAb did not significantly change CLL cell viability.
![Prior CLL therapy with a BTKi increases cytotoxicity of CD19/CD3 bsAb in vitro. PBMCs from BTKi-naïve (BN, n = 18), ibrutinib-treated (n = 20), or acalabrutinib-treated (n = 12) CLL patients were cultured with either CD19/CD3 bsAb, HER2/CD3 bsAb (nontargeting control), or medium only. CLL cell viability was analyzed after 3 and 5 days by flow cytometry. (A) Percent specific killing of CLL cells by bsAbs for BTKi-treated patients (BTKi, n = 32) and BN (n = 18) calculated as follows: ([%untreated CLL viability – %treated CLL viability]/[%untreated CLL viability] × 100). (B) Comparison of CLL-specific killing between acalabrutinib-treated (n = 12) and ibrutinib-treated (n = 20) patient samples with CD19/CD3 bsAb. (C) Comparison of baseline E:T ratio in PBMCs from BN (n = 18), acalabrutinib-treated (Aca, n = 12), and ibrutinib-treated (Ibr, n = 20) patients, calculated as follows: ([% CD4+ and CD8+ T cells]/[% CLL cells]). (D) Spearman’s correlation of baseline E:T ratios and percent specific killing of CLL cells in samples from BN (gray triangles, dashed regression line) and BTKi-treated patients (blue circles, solid regression line) cultured with CD19/CD3 bsAb for 3 and 5 days. Asterisks indicate statistical significance using Wilcoxon matched-pair signed-rank test for comparison of different treatments applied to individual patient samples or Mann-Whitney U test for comparison of different patient groups. *P < .05; **P < .01; ****P < .0001.](https://ash.silverchair-cdn.com/ash/content_public/journal/blood/138/19/10.1182_blood.2020009686/4/m_bloodbld2020009686f1.png?Expires=1769109343&Signature=VAhf2QQRv~v1YfU9NiSc-wU0lSpVK1wrfaAEUHPQ-slSs6GCo2vyrCMzUN2BglNQ62mupsZnM0dEY4426tnzdho0OnHY6w~ZTeAqoW57lM5LtZQegG210c-LDmvPBPgw3mEE5iGnnudCXzX9rWl6ebaGFgoiWxMajXhKeW10hsexDEe0FGQVjv4cPwS7CyocBs2RfRxsAteRSKQ-YWLb2VIv9PWZ4w1rtzhPJoFuQy~ZfRdu5hxCn0-TCKFVwAhcOxHEURBwXOnqXx0GxtbdHSEOXzb3MTRIjYNJSntgzdJYogs9HivhqiK54c2JZbSATKrQUiBKA90f2GNy9q~ZzQ__&Key-Pair-Id=APKAIE5G5CRDK6RD3PGA)
Prior CLL therapy with a BTKi increases cytotoxicity of CD19/CD3 bsAb in vitro. PBMCs from BTKi-naïve (BN, n = 18), ibrutinib-treated (n = 20), or acalabrutinib-treated (n = 12) CLL patients were cultured with either CD19/CD3 bsAb, HER2/CD3 bsAb (nontargeting control), or medium only. CLL cell viability was analyzed after 3 and 5 days by flow cytometry. (A) Percent specific killing of CLL cells by bsAbs for BTKi-treated patients (BTKi, n = 32) and BN (n = 18) calculated as follows: ([%untreated CLL viability – %treated CLL viability]/[%untreated CLL viability] × 100). (B) Comparison of CLL-specific killing between acalabrutinib-treated (n = 12) and ibrutinib-treated (n = 20) patient samples with CD19/CD3 bsAb. (C) Comparison of baseline E:T ratio in PBMCs from BN (n = 18), acalabrutinib-treated (Aca, n = 12), and ibrutinib-treated (Ibr, n = 20) patients, calculated as follows: ([% CD4+ and CD8+ T cells]/[% CLL cells]). (D) Spearman’s correlation of baseline E:T ratios and percent specific killing of CLL cells in samples from BN (gray triangles, dashed regression line) and BTKi-treated patients (blue circles, solid regression line) cultured with CD19/CD3 bsAb for 3 and 5 days. Asterisks indicate statistical significance using Wilcoxon matched-pair signed-rank test for comparison of different treatments applied to individual patient samples or Mann-Whitney U test for comparison of different patient groups. *P < .05; **P < .01; ****P < .0001.
Prior CLL therapy with a BTKi increases cytotoxicity of CD19/CD3 bsAb in vitro. PBMCs from BTKi-naïve (BN, n = 18), ibrutinib-treated (n = 20), or acalabrutinib-treated (n = 12) CLL patients were cultured with either CD19/CD3 bsAb, HER2/CD3 bsAb (nontargeting control), or medium only. CLL cell viability was analyzed after 3 and 5 days by flow cytometry. (A) Percent specific killing of CLL cells by bsAbs for BTKi-treated patients (BTKi, n = 32) and BN (n = 18) calculated as follows: ([%untreated CLL viability – %treated CLL viability]/[%untreated CLL viability] × 100). (B) Comparison of CLL-specific killing between acalabrutinib-treated (n = 12) and ibrutinib-treated (n = 20) patient samples with CD19/CD3 bsAb. (C) Comparison of baseline E:T ratio in PBMCs from BN (n = 18), acalabrutinib-treated (Aca, n = 12), and ibrutinib-treated (Ibr, n = 20) patients, calculated as follows: ([% CD4+ and CD8+ T cells]/[% CLL cells]). (D) Spearman’s correlation of baseline E:T ratios and percent specific killing of CLL cells in samples from BN (gray triangles, dashed regression line) and BTKi-treated patients (blue circles, solid regression line) cultured with CD19/CD3 bsAb for 3 and 5 days. Asterisks indicate statistical significance using Wilcoxon matched-pair signed-rank test for comparison of different treatments applied to individual patient samples or Mann-Whitney U test for comparison of different patient groups. *P < .05; **P < .01; ****P < .0001.
Interestingly, within the BTKi-treated group, there was no difference between ibrutinib or acalabrutinib. The median CLL cell-specific killing in PBMCs from acalabrutinib-treated patients after 3 days was 51% (IQR, 22-61) compared with 69% (IQR, 40-88) for ibrutinib-treated patients (P > .1) and after 5 days was 89% (IQR, 81-92) vs 94% (IQR 76-98), respectively (P > .1; Figure 1B).
The effector-to-target (E:T) ratios that ranged from 0.02 to 7 were not significantly different between the groups (P > .05) (Figure 1C). E:T ratios and CLL-specific killing after 3 days of treatment were highly correlated (r = 0.63, P = .005) for BTKi-naïve patients but less so (r = 0.4, P = .03) for BTKi-treated patients. For BTKi-naïve patients, the correlation between baseline E:T ratios and CLL-specific killing remained significant (r = 0.76, P = .0003) even after 5 days with the CD19/CD3 bsAb (Figure 1D). In contrast, >50% of CLL cells were killed irrespective of baseline E:T ratios (r = 0.1, P > .1) in PBMCS from patients on BTKi therapy (Figure 1D).
In summary, we found superior CD19/CD3 bsAb-mediated CLL cytotoxicity by autologous T cells in PBMCs from patients treated with a BTKi compared with those from BTKi-naïve patients. There was no difference between ibrutinib or acalabrutinib.
CD19/CD3 bsAb shifts T-cell differentiation toward Th1 polarization and memory T cells
Next, we measured T-cell expansion in PBMCs in response to in vitro exposure to the CD19/CD3 bsAb (supplemental Figure 1). After 3 days in culture, T cells in BTKi-naïve patient samples did not expand. In acalabrutinib-treated patients, the median increase in CD4+ and CD8+ T-cell counts over medium-only controls was 264% (P = .02) and 118% (P = .1), respectively. In ibrutinib-treated patients, the median increase in CD4+ and CD8+ T-cell counts over medium-only controls were 152% (P = .04) and 97% (P = .07), respectively. After 5 days, CD4+ and CD8+ T-cell counts increased significantly in all 3 groups (supplemental Figure 1).
We assessed T-cell polarization toward Th1, Th2, and Th17 subsets based on the expression of CCR6 and CXCR3 (supplemental Figure 2A). Before in vitro culture, Th1/Th2 ratios were biased toward Th2 in all patient samples (Figure 2A). In PBMCs from ibrutinib-treated patients, the Th2 bias was more pronounced than in BTKi-naïve patients (P = .04) or acalabrutinib-treated patients (P = .04). No significant differences in Th1/Th2 ratios were observed between BTKi-naïve and acalabrutinib-treated patients. Treatment with the CD19/CD3 bsAb shifted polarization toward Th1. After 3 days, the median Th1/Th2 ratio increased from 0.1 to 2.7 (P = .04) for acalabrutinib-treated patients, from 0.1 to 1.6 for ibrutinib-treated patients (P < .0001), and from 0.6 to 2 (P = .002) for BTKi-naïve patients (Figure 2B). After 5 days, the median Th1/Th2 ratio increased significantly in the 3 groups (Figure 2C), and the concentrations of the Th1 cytokines tumor necrosis factor-α, interferon-γ, and granulocyte-macrophage colony-stimulating factor significantly increased in cell culture supernatants (P < .01; Figure 2D; supplemental Figure 2B). In BTKi-treated samples, IL-6 also increased (P = .04 and P = .03), but concentrations remained well below those of Th1 cytokines. Concentrations of IL-4 were below the limit of detection in all conditions (≤200 ρg/mL) (Figure 2D; supplemental Figure 2B).

CD19/CD3 bsAb promotes Th1 polarization independent of BTKi therapy. PBMCs from BTKi-naïve (BN) and BTKi-treated (BTKi) patients were cultured with either CD19/CD3 bsAb, or medium only. Th1 and Th2 polarization of CD4+ T cells was assessed based on CCR6 and CXCR3 expression. Th1/Th2 ratio was calculated from the percentage of Th1 and Th2 subsets within CD4+ T cells. (A) Comparison of Th1/Th2 ratio (log2 transformed) at baseline, before in vitro culture between BN (n = 16, gray triangles), acalabrutinib-treated (Aca, n = 11, purple circles), and ibrutinib-treated (Ibr, n = 19, green diamonds) patient samples. (B) Th1/Th2 ratio (log2 transformed) in BN (n = 14), Aca (n = 11), and Ibr (n = 19) patient samples, after (B) 3 days, and (C) 5 days of culture with CD19/CD3 bsAb (CD19/CD3, red bars) or medium only (NoAb, blue bars). Each symbol represents 1 patient sample. Results are displayed as median and 95% confidence interval (CI). (D) Cytokine levels in media from untreated (No Ab) and treated (CD19/3) conditions after 5 days were measured by Luminex assay. The heatmap depicts the median cytokine concentration for each group of samples (BN, n = 7; Ibr, n = 8; and Aca, n = 8). Asterisks indicate statistical significance using Wilcoxon matched-pair signed-rank test for comparison of different treatments applied to individual patient samples and Mann-Whitney test for comparison of different patient groups. *P < .05; **P < .01; ****P < .0001.
CD19/CD3 bsAb promotes Th1 polarization independent of BTKi therapy. PBMCs from BTKi-naïve (BN) and BTKi-treated (BTKi) patients were cultured with either CD19/CD3 bsAb, or medium only. Th1 and Th2 polarization of CD4+ T cells was assessed based on CCR6 and CXCR3 expression. Th1/Th2 ratio was calculated from the percentage of Th1 and Th2 subsets within CD4+ T cells. (A) Comparison of Th1/Th2 ratio (log2 transformed) at baseline, before in vitro culture between BN (n = 16, gray triangles), acalabrutinib-treated (Aca, n = 11, purple circles), and ibrutinib-treated (Ibr, n = 19, green diamonds) patient samples. (B) Th1/Th2 ratio (log2 transformed) in BN (n = 14), Aca (n = 11), and Ibr (n = 19) patient samples, after (B) 3 days, and (C) 5 days of culture with CD19/CD3 bsAb (CD19/CD3, red bars) or medium only (NoAb, blue bars). Each symbol represents 1 patient sample. Results are displayed as median and 95% confidence interval (CI). (D) Cytokine levels in media from untreated (No Ab) and treated (CD19/3) conditions after 5 days were measured by Luminex assay. The heatmap depicts the median cytokine concentration for each group of samples (BN, n = 7; Ibr, n = 8; and Aca, n = 8). Asterisks indicate statistical significance using Wilcoxon matched-pair signed-rank test for comparison of different treatments applied to individual patient samples and Mann-Whitney test for comparison of different patient groups. *P < .05; **P < .01; ****P < .0001.
T-cell subsets were differentiated based on expression of CCR7 and CD45RO, as naïve, central memory (CM), effector memory, and effector T cells (supplemental Figure 3A). After 3 days of exposure to CD19/CD3 bsAb, the proportion of T-CM among CD4+ T cells increased from 30% to 41% in ibrutinib-treated patient samples (P = .002) and remained unchanged in acalabrutinib-treated samples (supplemental Figure 3B). Among CD8+ T cells, the proportion of T-CM increased from 5% to 9% (P = .01) in ibrutinib-treated and from 7% to 10% (P = .02) in acalabrutinib-treated samples. In samples from BTKi-naïve patients, T-EM cells increased from 21% to 27% in the CD4+ subset (P < .0001; supplemental Figure 3B) without significant expansion of T-CM.
Superior T-cell activation correlates with increased cytotoxicity in response to the CD19/CD3 bsAb in BTKi-treated patient samples
To gauge the effect of the bsAb on T-cell proliferation and activation, we quantified the frequencies of activated CD4+ and CD8+ T cells expressing Ki-67, granzyme B, and activation and exhaustion markers in PBMCs cultured for 3 days with or without the CD19/CD3 bsAb (supplemental Figures 4 and 5). Across all patient samples, we observed a significant increase of CD4+ and CD8+ T cells expressing Ki-67, granzyme B, HLA-DR, CD40L, PD-1, TIM-3, and LAG-3 in response to the bsAb.
To investigate the relationship between T-cell response and tumor cell killing, we calculated the fold change in the frequency of CD4+ or CD8+ T cells expressing the immunophenotypic markers between CD19/CD3 bsAb and medium-only treated conditions. Using hierarchical clustering, we identified 2 major sample clusters for both the CD4+ and CD8+ T-cell populations. Compared with T cells in cluster 1, those in cluster 2 responded to the bsAb with increased proliferation, activation, and expression of cytotoxic effectors (Figure 3A).
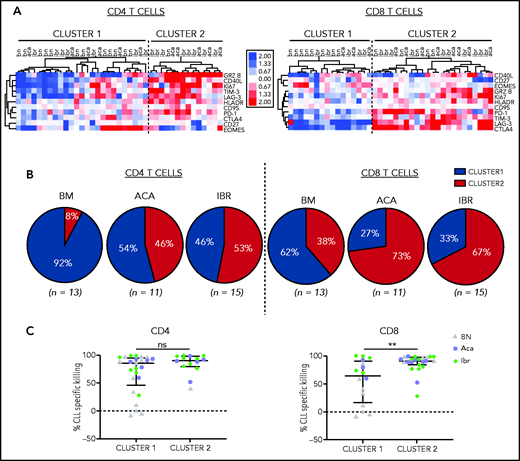
CD19/CD3 bsAb induced T-cell activation and cytotoxic effector functions. PBMCs from BTKi-naïve (BN, n = 13) and BTKi-treated (BTKi, n = 26) patients were cultured with either CD19/CD3 bsAb, or medium only. Markers of T-cell activation and cytotoxic potential were assessed by flow cytometry in CD4+ and CD8+ T cells. (A) Fold changes in the frequencies of T cells expressing the respective markers after 3 days of in vitro culture with CD19/CD3 vs medium alone were log2 transformed, median-centered, and samples grouped by complete clustering. Heatmap depicts the fold changes on a log2 scale for BN, ibrutinib (Ibr), and acalabrutinib (Aca) patient samples. (B) Pie charts show the proportion of patient samples in cluster 1 (blue) or cluster 2 (red) within BN (n = 13), Aca (n = 11), and Ibr (n = 15) groups. (C) Comparison of CLL-specific killing after 5 days of treatment between cluster 1 and cluster 2 based on CD4+ and CD8+ T-cell activation, respectively. Each dot represents 1 patient sample; BN (gray triangles), Aca (purple circles), and Ibr (green diamonds). Results are reported as median and IQR. Asterisks indicate statistical significance using Mann-Whitney U tests. **P < .01.
CD19/CD3 bsAb induced T-cell activation and cytotoxic effector functions. PBMCs from BTKi-naïve (BN, n = 13) and BTKi-treated (BTKi, n = 26) patients were cultured with either CD19/CD3 bsAb, or medium only. Markers of T-cell activation and cytotoxic potential were assessed by flow cytometry in CD4+ and CD8+ T cells. (A) Fold changes in the frequencies of T cells expressing the respective markers after 3 days of in vitro culture with CD19/CD3 vs medium alone were log2 transformed, median-centered, and samples grouped by complete clustering. Heatmap depicts the fold changes on a log2 scale for BN, ibrutinib (Ibr), and acalabrutinib (Aca) patient samples. (B) Pie charts show the proportion of patient samples in cluster 1 (blue) or cluster 2 (red) within BN (n = 13), Aca (n = 11), and Ibr (n = 15) groups. (C) Comparison of CLL-specific killing after 5 days of treatment between cluster 1 and cluster 2 based on CD4+ and CD8+ T-cell activation, respectively. Each dot represents 1 patient sample; BN (gray triangles), Aca (purple circles), and Ibr (green diamonds). Results are reported as median and IQR. Asterisks indicate statistical significance using Mann-Whitney U tests. **P < .01.
Among CD8+ T cells, 73% of acalabrutinib-treated and 67% of ibrutinib-treated samples were assigned to the highly activated group (cluster 2, Figure 3B). Among CD4+ T cells, 46% of acalabrutinib and 53% of ibrutinib-treated samples were in cluster 2. In contrast, the majority of BTKi-naïve samples were assigned to cluster 1; 92% for the CD4+ and 62% for the CD8+ subset.
CD8+ T cells in the highly activated cluster 2 were superior cytotoxic effectors achieving median CLL cell killing of 91% (IQR, 84-97) compared with 64% (IQR, 17-91) for those assigned to cluster 1 (P = .009, Figure 3C). There was no difference in cytotoxic activity in samples grouped based on CD4+ T-cell activation state.
Treatment of CLL patients with BTKi increases the cytotoxic effector function of autologous and allogeneic T cells in response to CD19/CD3 bsAb
Our results indicate that treatment of CLL patients with a BTKi, irrespective of ITK inhibition, enhances T-cell dependent antitumor effects. To investigate whether BTKis attenuate immunosuppressive effects of CLL cells or sensitize tumor cells to immune attack, we mixed PBMCs obtained from the same patient before and after 12 months of BTKi therapy. To track the source, 1 sample was stained with VPD, whereas the other was left unstained. Cell viability was measured in the VPD-negative fraction (Figure 4A). After treatment with CD19/CD3 bsAb, the median CLL kill rate in the baseline, BTKi-naïve PBMCs was 15% compared with 53% when baseline samples were mixed with PBMCs obtained on BTKi therapy (P = .008). Conversely, the median CLL kill rate in BTKi-treated PBMCs numerically decreased from 51% to 29% when mixed with baseline PBMCs, but this did not reach statistical significance (Figure 4B).
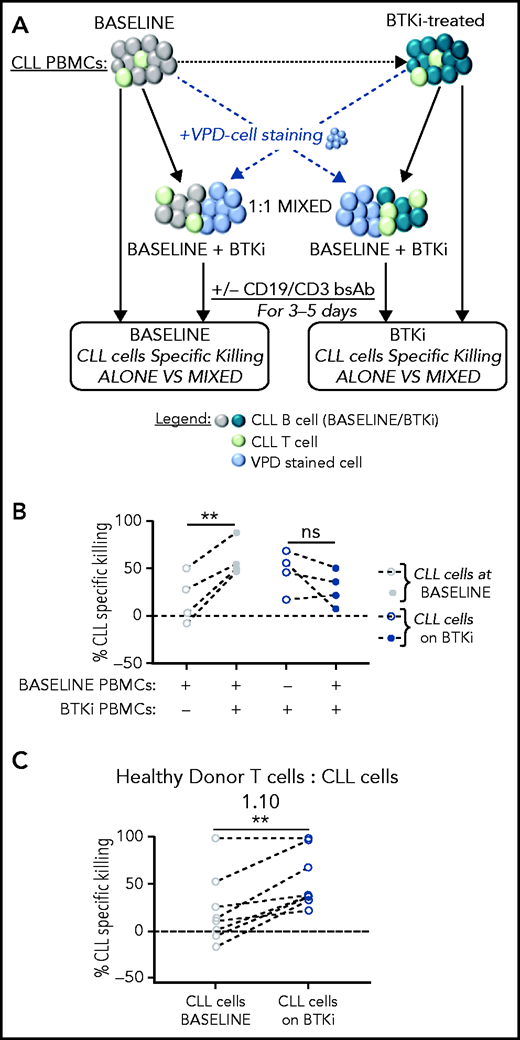
Treatment of CLL patients with BTKi enhances the cytotoxic effector function of autologous and allogeneic T cells in response to CD19/CD3 bsAb. (A) Tumor cell killing in response to the CD19/CD3 bsAb was tested in PBMCs obtained from the same CLL patients before starting therapy (baseline), and again on BTKi therapy (BTKi) mixed at a 1:1 ratio. VPD staining was used to identify the source of the sample in the mixing experiments. CLL cell killing was assessed in the VPD-negative population. (B) CLL-specific killing after culture with CD19/CD3 bsAb; tested were PBMC samples from 4 patients obtained at baseline (gray circles), on BTKi therapy (blue circles) tested were PBMC samples were alone (dotted circles) or mixed containing 50% baseline and 50% BTKi-treated PBMCs (plain circles). Each dot represents 1 patient; lines connect samples obtained from the same patient. (C) To test whether CLL cells affect normal T-cell function, we mixed PBMCs from a healthy donor with CLL cells purified from baseline samples (gray circles) or during BTKi therapy (blue circles) at 1:10 T cells:CLL cell ratios (n = 8). CLL-specific killing after 3 days of culture with the CD19/CD3 bsAb is shown. Each dot represents 1 patient; lines connect samples obtained from the same patient. Statistical significance by Wilcoxon matched-pair signed-rank test. **P < .01.
Treatment of CLL patients with BTKi enhances the cytotoxic effector function of autologous and allogeneic T cells in response to CD19/CD3 bsAb. (A) Tumor cell killing in response to the CD19/CD3 bsAb was tested in PBMCs obtained from the same CLL patients before starting therapy (baseline), and again on BTKi therapy (BTKi) mixed at a 1:1 ratio. VPD staining was used to identify the source of the sample in the mixing experiments. CLL cell killing was assessed in the VPD-negative population. (B) CLL-specific killing after culture with CD19/CD3 bsAb; tested were PBMC samples from 4 patients obtained at baseline (gray circles), on BTKi therapy (blue circles) tested were PBMC samples were alone (dotted circles) or mixed containing 50% baseline and 50% BTKi-treated PBMCs (plain circles). Each dot represents 1 patient; lines connect samples obtained from the same patient. (C) To test whether CLL cells affect normal T-cell function, we mixed PBMCs from a healthy donor with CLL cells purified from baseline samples (gray circles) or during BTKi therapy (blue circles) at 1:10 T cells:CLL cell ratios (n = 8). CLL-specific killing after 3 days of culture with the CD19/CD3 bsAb is shown. Each dot represents 1 patient; lines connect samples obtained from the same patient. Statistical significance by Wilcoxon matched-pair signed-rank test. **P < .01.
To test whether CLL cells affect normal T-cell function, we mixed healthy donor PBMCs with purified CLL cells at 1:10 E:T ratios, replicating the T-cell to CLL-cell ratios commonly observed in patient samples. After 3 days of culture with the CD19/CD3 bsAb, median-specific killing of baseline CLL cells mixed with allogeneic healthy T cells was 13% compared with 38% when the allogeneic T cells were directed against BTKi-treated CLL cells (P = .003; Figure 4C). Taken together, these experiments indicate that BTKi therapy reduces the ability of CLL cells to restrain immune effector functions resulting in superior cytotoxic activity of T cells.
BTKi therapy downregulates an immune regulatory program in CLL
To investigate how BTKi treatment affects putative immunosuppressive pathways in CLL cells, we analyzed the transcriptomes of CD19-selected CLL cells obtained at baseline and after 6 months of treatment with either ibrutinib or acalabrutinib.8,29 Expression of 22 of 85 immunomodulatory genes compiled from 33 diverse cancer types30 was modulated (absolute fold-change ≥ 1.5, false discovery rate < 0.1) by BTKi treatment (Figure 5A). Notably, CTLA-4,31 CD276 (B7-H3),32 and CD200,33 which encode potent immunosuppressive molecules, were significantly downregulated in CLL cells by BTKi therapy (Figure 5A). There was no apparent difference in the gene expression response between patients treated with ibrutinib or acalabrutinib. Using flow cytometry, we confirmed significant downregulation of CTLA-4 and CD200 protein expression in CLL cells (Figure 5B,C).
![Modulation of an immune regulatory program in CLL cells by BTKi therapy. (A) Heatmap of 22 immunomodulatory genes that were significantly modulated by BTKi therapy (absolute fold change >1.5, false discovery rate <0.1). Depicted is the log2 fold change after 6 months of treatment with ibrutinib (n = 14) or acalabrutinib (n = 20) compared with baseline. (B) Expression of CD200 (n = 16) and (C) intracellular CTLA-4 (n = 12) were measured by flow cytometry in CLL cells before starting therapy (baseline, gray triangles) and after 6 months on a BTKi (acalabrutinib [purple circles] or ibrutinib [green diamonds]). Mean fluorescence intensity (MFI) of the entire CLL population is shown. Statistical significance by Wilcoxon matched-pair signed-rank test. ***P < .001; ****P < .0001.](https://ash.silverchair-cdn.com/ash/content_public/journal/blood/138/19/10.1182_blood.2020009686/4/m_bloodbld2020009686f5.png?Expires=1769109343&Signature=oD5djM5MWmfmt312qE2Io66Rros4~M47-J9gvGRd6T9VE0TcaI~61TlMpBlgqhC~CP9EXTUWnCVJAVw~4cP7RTMpSBrBzhEbePCA7dbFhuoQ0aqANXYtpiuZQvG~5IFWcqUE3kbfH4Q5e2mlXDt2eaBrzyNHiZZmZ0I5IGhxdAzZNE4qHhZ-~hkVbkUP1nGHf6SmtN4OpIzXRIgrayWoKfB-gwtfohdwBWsZaMUtROVdK~1bBFaxQbXlyq7igp3aNZ-q9kv7By4zHYkYthQrzZBKep~zOup5yciAe1crgL7NxP-NHaXkAxzpVP7B5UUov6X8IaHVu72-bUZUI5Nwrw__&Key-Pair-Id=APKAIE5G5CRDK6RD3PGA)
Modulation of an immune regulatory program in CLL cells by BTKi therapy. (A) Heatmap of 22 immunomodulatory genes that were significantly modulated by BTKi therapy (absolute fold change >1.5, false discovery rate <0.1). Depicted is the log2 fold change after 6 months of treatment with ibrutinib (n = 14) or acalabrutinib (n = 20) compared with baseline. (B) Expression of CD200 (n = 16) and (C) intracellular CTLA-4 (n = 12) were measured by flow cytometry in CLL cells before starting therapy (baseline, gray triangles) and after 6 months on a BTKi (acalabrutinib [purple circles] or ibrutinib [green diamonds]). Mean fluorescence intensity (MFI) of the entire CLL population is shown. Statistical significance by Wilcoxon matched-pair signed-rank test. ***P < .001; ****P < .0001.
Modulation of an immune regulatory program in CLL cells by BTKi therapy. (A) Heatmap of 22 immunomodulatory genes that were significantly modulated by BTKi therapy (absolute fold change >1.5, false discovery rate <0.1). Depicted is the log2 fold change after 6 months of treatment with ibrutinib (n = 14) or acalabrutinib (n = 20) compared with baseline. (B) Expression of CD200 (n = 16) and (C) intracellular CTLA-4 (n = 12) were measured by flow cytometry in CLL cells before starting therapy (baseline, gray triangles) and after 6 months on a BTKi (acalabrutinib [purple circles] or ibrutinib [green diamonds]). Mean fluorescence intensity (MFI) of the entire CLL population is shown. Statistical significance by Wilcoxon matched-pair signed-rank test. ***P < .001; ****P < .0001.
Our studies focused on samples from patients treated with BTKis. To test the effect of BTKis in vitro, we cultured CLL PBMCS with or without the addition of ibrutinib or acalabrutinib. Both BTKis increased bsAb-recruited allogeneic T-cell cytotoxicity within 5 days (supplemental Figure 6A) and significantly downregulated CTLA4 expression in CLL cells after 24 hours of exposure (supplemental Figure 6B). Taken together, these experiments support a direct effect of BTKis on the immunosuppressive program in CLL cells.
CTLA-4 blockade by ipilimumab induces superior CLL-specific killing in treatment-naïve patient samples in response to CD19/CD3 bsAb
CTLA-4 has previously been reported to be overexpressed in peripheral blood CLL cells compared with normal B lymphocytes.34 In the TCL1 murine CLL model, CTLA-4 blockade reduced leukemic cell burden.35 Therefore, we hypothesized that downregulation of CTLA-4 in CLL cells by BTKi contributes to the observed improvement in cytotoxic T-cell responses. In PBMCs from BTKi-naïve patients, CTLA-4 blockade with ipilimumab increased CD19/CD3 bsAb-dependent CLL cell killing from median −12% (IQR, −15 to 4) to 2% (IQR, −4 to 30) (P = .03) (Figure 6A). To block CTLA-4 specifically on tumor cells, purified CLL cells were treated with ipilimumab for 24 hours, then washed before healthy donor allogeneic T cells were added to a 1:10 E:T ratio. CLL cells from the same patients obtained before starting therapy and after at least 6 months on a BTKi were assayed concurrently. For baseline CLL cells, ipilimumab increased median bsAb-dependent killing from 48% (IQR, 7-96) to 70% (IQR, 32-97) (P = .03). In contrast, ipilimumab did not increase killing of CLL cells obtained during BTKi-treatment (P = .7) (Figure 6B), suggesting that BTKi-induced downregulation of CTLA-4 is as effective as CTLA-4 blockade with ipilimumab. In fact, median specific killing (70%; IQR, 32-97) of baseline CLL cells treated with ipilimumab was equal to that (72%; IQR, 31-96) of CLL cells from the same patients sampled during ibrutinib therapy (P > .1).
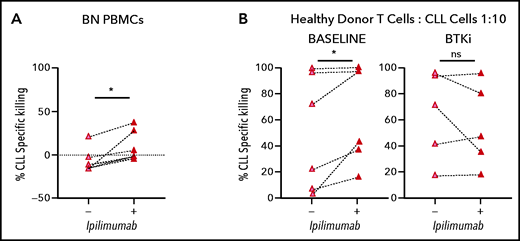
BTKi therapy and CTLA-4 blockade by ipilimumab enhance the cytotoxic effector function of autologous and allogeneic T cells in response to CD19/CD3 bsAb. (A) CLL PBMCS from BTKi-naïve (BN, n = 6) patients were cultured with CD19/CD3 bsAb with or without the addition of ipilimumab (50 μg/mL). Depicted is the specific killing of CLL cells after 3 days of culture. (B) Purified CLL cells obtained from the same CLL patients before starting therapy (baseline) and after at least 6 months on BTKi therapy (BTKi) (n = 6), were incubated with or without ipilimumab for 24 hours before coculture with CD19/CD3 bsAb and healthy donor allogeneic T cells, at a 1:10 E:T ratio. Depicted is the specific killing of CLL cells after 3 days of culture. Results are reported as median and IQR. Statistical significance by Wilcoxon matched-pair signed-rank test. *P < .05.
BTKi therapy and CTLA-4 blockade by ipilimumab enhance the cytotoxic effector function of autologous and allogeneic T cells in response to CD19/CD3 bsAb. (A) CLL PBMCS from BTKi-naïve (BN, n = 6) patients were cultured with CD19/CD3 bsAb with or without the addition of ipilimumab (50 μg/mL). Depicted is the specific killing of CLL cells after 3 days of culture. (B) Purified CLL cells obtained from the same CLL patients before starting therapy (baseline) and after at least 6 months on BTKi therapy (BTKi) (n = 6), were incubated with or without ipilimumab for 24 hours before coculture with CD19/CD3 bsAb and healthy donor allogeneic T cells, at a 1:10 E:T ratio. Depicted is the specific killing of CLL cells after 3 days of culture. Results are reported as median and IQR. Statistical significance by Wilcoxon matched-pair signed-rank test. *P < .05.
Discussion
CLL is an immunosuppressive disease characterized by increased infectious morbidity and mortality,36,37 blunted responses to vaccines,38 and inferior activity of both antibody and cellular immunotherapies.39,40 CLL cells are clearly sensitive to T-cell attack as initially demonstrated by donor lymphocyte infusion after allogeneic stem cell transplantation,41 and more recently shown by CAR T-cell therapy.42,43 Ibrutinib, at least in part, improves immune function and reduces infection rates.22,44,45 We previously reported that ongoing therapy with ibrutinib improved killing of CLL cells by a CD19/CD3 bsAb in vitro and in patient-derived xenografts.25 Herein, we sought to investigate how ibrutinib improves T cell–mediated killing of CLL cells and test whether ITK inhibition is required. We show that treatment with BTK is, irrespective of ITK inhibition, downregulates an immunosuppressive program in CLL cells resulting in enhanced cytotoxicity of autologous T cells.
It is now well established that ibrutinib reshapes the immune microenvironment. Specifically, ibrutinib has been shown to disrupt tumor-macrophage interactions, normalize T-cell counts, downregulate expression of activation and exhaustion markers on T cells and restore immune synapse formation.22,23,46 To investigate how BTKi therapy can be harnessed to improve T cell–dependent immunotherapy, we tested our CD19/CD3-bispecific antibody in PBMCs from CLL patients treated with ibrutinib or acalabrutinib and used samples obtained from the same patients before initiation of the BTKi or from BTKi-naïve patients for comparison. In PBMCs from patients treated with a BTKi, CD19/CD3 bsAb-triggered cytotoxicity by autologous T cells in vitro was increased. There was no difference between samples from ibrutinib and acalabrutinib-treated patients, indicating that ITK inhibition is not required for, nor detrimental to T-cell cytotoxicity. The bsAb shifted T cells toward a Th1 polarization and increased expression of Ki-67, granzyme B, and activation markers on CD4+ and CD8+ T cells across all patient samples. Experiments mixing paired pretreatment and BTKi-treated PBMCs from the same patients and experiments mixing healthy donor PBMCs with purified CLL cells were designed to differentiate between the effects of BTKi therapy on CLL cells and T cells and indicated that BTKi therapy reduced the ability of CLL cells to evade T cell–mediated destruction.
To investigate the effect of BTKi on factors implicated in CLL immune evasion,47-49 we took advantage of our previous RNA sequencing efforts in patients treated with ibrutinib or acalabrutinib.8,29 In these data sets, we specifically interrogated transcriptional changes in immunomodulatory genes compiled from 33 diverse cancer types30 and identified significant downregulation of known inhibitors of antitumor immunity CTLA-4, CD200, and CD276.31-33 All 3 molecules are pursued as immunotherapeutic targets, with the anti-CTLA-4 ipilimumab US Food and Drug Administration–approved for use in select solid tumor indications. Reduced expression of CTLA-4 in T cells of CLL patients treated with BTKis has been reported,22,23,50,51 and CTLA-4 blockade decreased leukemic cell burden in the TCL1 murine CLL model.35 Having observed improved killing of CLL cells from BTKi-naïve patients with the addition of ipilimumab to the CD19/CD3 bs Ab in vitro, we sought to test whether CTLA-4 downregulation in CLL is sufficient to enhance antitumor T-cell responses. We therefore treated CLL cells with ipilimumab before exposing them to healthy allogeneic T cells. Using CLL cells collected sequentially from the same patients, we found that ipilimumab enhanced bsAb-induced killing in baseline samples but could not further increase cytotoxicity in samples collected during BTKi therapy. Absence of an additive effect of ipilimumab in samples from patients on BTKi supports the hypothesis that CTLA-4 downregulation by BTKi is an important contributor to enhanced T-cell cytotoxicity.
The CD19/CD3 bsAb used here incorporates state-of-the-art engineering principles that include a full-length Fc region, important for half-live extension in vivo, and inactivation of Fc-mediated innate immune responses. CD20/CD3 bsAbs targeting CD20 that use similar design principles are demonstrating single agent efficacy in clinical trials.52,53
In summary, BTKis, irrespective of ITK inhibition, improve T-cell cytotoxic response to T cell–engaging bsAbs. In this context, we attribute improved antitumor effects primarily to the downregulation of immunosuppressive regulators in CLL cells; and, among those, CTLA-4 emerges as a possible mechanistic link. The combination of BTKis with bispecific antibodies is a promising strategy to consolidate remissions and overcome drug resistance in CLL. Conceivably, such combinations could hold promise also more broadly in other types of mature B-cell malignancies. These concepts should be tested in clinical trials.
Acknowledgments
The authors thank patients for participating and donating samples to make this research possible, Susan Soto and Pia Nierman for protocol support, National Heart, Lung, and Blood Institute (NHLB) Flow Cytometry Cores, NHLBI Sequencing and Genomics Core, and NHLBI Bioinformatics and Computational Biology Core.
This study was supported by the Intramural Research Program of the NHLBI, National Institutes of Health.
Authorship
Contribution: M.M., C.S., and A.W. conceptualized the article; M.M., E.M.G., D.E., and A.B. undertook experiments; M.M., E.M.G., D.E., and E.K.K. provided data analysis and figures; M.M., D.E., and A.W. wrote the original draft; all authors reviewed and edited the article; A.W. supervised; and A.W. acquired funding.
Conflict-of-interest disclosure: A.W. received research support from Pharmacyclics LLC, an Abbvie Company, Acerta Pharma, a member of the Astra-Zeneca group, and Merck.
The current affiliation for M.J.B is Astra-Zeneca, Lisbon, Portugal.
Correspondence: Adrian Wiestner, National Heart, Lung, and Blood Institute, National Institutes of Health, 10 CRC, Room 3-5140, 10 Center Dr, Bethesda, MD 20892-1202; e-mail: wiestnera@mail.nih.gov.
Presented in abstract form at the 61st annual meeting of the American Society of Hematology, Orlando, FL, December 2019.
The online version of this article contains a data supplement.
The publication costs of this article were defrayed in part by page charge payment. Therefore, and solely to indicate this fact, this article is hereby marked “advertisement” in accordance with 18 USC section 1734.

This feature is available to Subscribers Only
Sign In or Create an Account Close Modal