

Key Points
Activating somatic mutations in MAPK pathway genes are enriched among CLL patients who did not respond to PI3K inhibitors.
Activation of pERK is observed in primary and acquired PI3K resistance regardless of mutational status.

Abstract
Inhibitors of Bruton tyrosine kinase (BTK) and phosphatidylinositol 3-kinase δ (PI3Kδ) that target the B-cell receptor (BCR) signaling pathway have revolutionized the treatment of chronic lymphocytic leukemia (CLL). Mutations associated with resistance to BTK inhibitors have been identified, but limited data are available on mechanisms of resistance to PI3Kδ inhibitors. Here we present findings from longitudinal whole-exome sequencing of cells from patients with multiply relapsed CLL (N = 28) enrolled in trials of PI3K inhibitors. The nonresponder subgroup was characterized by baseline activating mutations in MAP2K1, BRAF, and KRAS genes in 60% of patients. PI3Kδ inhibition failed to inhibit ERK phosphorylation (pERK) in nonresponder CLL cells with and without mutations, whereas treatment with a MEK inhibitor rescued ERK inhibition. Overexpression of MAP2K1 mutants in vitro led to increased basal and inducible pERK and resistance to idelalisib. These data demonstrate that MAPK/ERK activation plays a key role in resistance to PI3Kδ inhibitors in CLL and provide a rationale for therapy with a combination of PI3Kδ and ERK inhibitors.
Introduction
Treatment of chronic lymphocytic leukemia (CLL) has been revolutionized by the development of the targeted agents against the B-cell receptor (BCR) signaling pathway. One key kinase activated downstream of BCR is the phosphatidylinositol-3 kinase (PI3K), a kinase that regulates cellular processes including growth, proliferation, motility, and metabolism.1,2 The class I PI3K enzyme is composed of a catalytic (p110) and a regulatory (p85) subunit, with the p110 catalytic subunit having four isoforms—α, β, γ, δ—that differ in their cell type specificity. The p110δ isoform is predominantly expressed in hematopoietic cells, and genetic inactivation of the p110δ (p110δ D910A/D910A) crossed into the Eμ-TCL1 CLL mouse model leads to impaired BCR signaling and B-cell migration and significantly delays the onset of CLL.3 The p110δ isoform is the critical isoform in CLL; its inhibition significantly reduces downstream AKT activation and CLL cell survival.4
The first-in-class PI3Kδ inhibitor idelalisib showed an overall response rate of 70% to 80% and median progression-free survival of 32 months at the recommended phase 2 dose of 150 mg twice per day (∼1 µM) in its initial phase 1 study.5,6 In 2014, idelalisib was the first PI3Kδ inhibitor approved in any malignancy for the treatment of patients with CLL who relapsed after at least 2 previous regimens and who were appropriate candidates for rituximab.7
Despite this approval, and the multiple other PI3Kδ inhibitors now approved and in clinical trials, limited data are available on the mechanisms of primary or acquired resistance to these drugs. So far, resistance has been studied primarily in solid tumors and been attributed to alterations that increase the activity of PIK3CA, NRAS, or KRAS.8-10 In a human epidermal growth factor receptor 2 (HER2)-overexpressing breast cancer model, compensatory upregulation of ERK signaling was reported in response to PI3K inhibition and was attributed to PI3K signaling to RAS as well as HER2 overexpression.10 Whether these mechanisms are relevant to B-cell malignancies remains to be determined.
In B cells, the MAPK/ERK pathway can be activated downstream of BCR and PI3K.4,11 In CLL, the MAPK/ERK pathway is aberrantly activated, in part because of constitutive BCR pathway activation and in part because of acquired activating mutations.11 In fact, 8.7% of patients with CLL harbor mutations in MAPK/ERK pathway genes early in their disease course.12 Although MAPK activation is common in CLL, marked heterogeneity in the degree of activation is present among different biological subgroups of CLL.11 It is currently unknown how the differences in MAPK activation affect response to targeted therapy. By using a combination of next-generation sequencing and experimental data, we show that resistance to treatment with PI3K inhibitors in CLL can be mediated by activation of the MAPK/ERK pathway.
Methods
Identification of somatic mutations
High-confidence somatic mutations were identified by using a set of algorithms within the Firehose pipeline, which was developed by the Cancer Genome Analysis group at the Broad Institute(https://software.broadinstitute.org/cancer/cga/Firehose). The details of these pipelines have been published previously.12-14 Specifically, the somatic single nucleotide mutations were detected using MuTect,13 and somatic small nucleotide insertions and deletions were detected using Indelocator. The somatic mutation calls were filtered using local realignment for a more accurate allele-fraction estimation as described previously.12 Significantly mutated genes were identified using MutSig2CV.14 Finally, the mutations of interest were visualized using Integrative Genomics Viewer (IGV)15 for manual confirmation of the quality of the mutation call.
Estimation of clonality using ABSOLUTE
ABSOLUTE16 infers the purity and ploidy of the tumor samples, which include intermixed normal tissue, using mutation and copy-number data. ABSOLUTE also calculates the local copy number and the cancer cell fraction (CCF) of each mutation (the fraction of cancer cells harboring the mutation). Mutations with CCF <0.1 were filtered out because of low power.17 The CCF obtained by using the ABSOLUTE pipeline is then clustered by the PhylogicNDT Cluster tool by identifying mutations with consistent CCF values across serial samples, and the posterior probability distribution is used to identify the most likely clonal architecture (PhylogicNDT BuildTree). Those mutations with a posterior probability of CCF >0.95 were classified as clonal, or if the CCF was lower, then they were classified as subclonal. Phylogenetic analysis, subclonal reconstruction, and tree building were performed with the PhylogicNDT package.18 Dynamic subclones were those with at least 10% difference in most likely CCF values between any 2 time points. Pathway analysis was performed using the MSigDB (The Molecular Signatures) database.19 For additional information regarding methods, please see supplemental Methods (available on the Blood Web site).
Results
Overall genomic landscape at time of first sampling
We performed whole-exome sequencing on matched tumor and germline samples from 28 patients with CLL treated with PI3K inhibitors. Among the CLL patients, 22 (78.57%) of 28 were treated with idelalisib, a δ-specific inhibitor, 3 received pilaralisib (XL147), a pan-PI3K inhibitor, and 3 received voxtalisib (XL765), a pan-PI3K/mammalian target of rapamycin (mTOR) dual inhibitor. The cohort was heavily pretreated with a median of 4.5 previous therapies; the adverse cytogenetic aberrations del(17p) and del(11q) were seen in 18% and 32% of the patients, respectively (Table 1). A median of 2 longitudinal tumor samples (range, 1-6 tumor samples) were sequenced per patient (68 samples). The cohort was subdivided into 18 responders (47 samples) and 10 nonresponders (21 samples) on the basis of their initial clinical response to the PI3K inhibitor. An average of 23 ± 12 nonsilent somatic mutations (range, 4-58 nonsilent somatic mutations) were identified at the time of first sampling. The frequency of nonsilent mutations was 0.64 ± 0.32 per Mb (range, 0.11-1.61 nonsilent mutations) and is typical of frequencies in previously published CLL cohorts.12,20,21 At the time of first sampling, a comparison of the median number of silent (P = .41) and nonsilent (P = .72) mutations between responder and nonresponder subgroups showed no difference (Figure 1A). We did not find any difference in the median number of silent (P = .64) and nonsilent (P = .56) mutations between the initial time point and the samples with the lowest number of mutations at the later time points (Figure 1B). TP53, SF3B1, DDX3X, and BRAF were identified as significantly mutated genes at first sampling in this cohort by using MutSig2CV14 (Figure 1C). The distribution of these significantly mutated genes between responders and nonresponders is provided in supplemental Table 1. Interestingly, the mutation frequencies of these genes were higher than reported previously in the 2 largest sequenced cohorts of CLL12,22 : BRAF, 11% vs 4%12 (P = .0999); DDX3X, 14% vs 2%12 (P = .0022); SF3B1, 36% vs 21%12 (P = .0641); and TP53, 21% vs 7%12 (P = .0116). This likely reflects the very heavily pretreated status of these patients.
Clinical characteristics of enrolled patients
| Characteristic | No. | % |
|---|---|---|
| Total | 28 | 100 |
| Median age at diagnosis, y (range) | 54 (31-69) | |
| Sex | ||
| Male | 23 | 82 |
| Female | 5 | 18 |
| IGHV mutational status | ||
| Mutated | 8 | 28 |
| Unmutated | 15 | 54 |
| Unknown | 5 | 18 |
| Zap70 | ||
| Negative | 9 | 32 |
| Positive | 14 | 50 |
| Unknown | 5 | 18 |
| FISH (by Dohner hierarchy) | ||
| del (17p) | 5 | 18 |
| del (11q) | 9 | 32 |
| Trisomy 12 | 0 | 0 |
| del (13q) | 10 | 36 |
| Normal | 4 | 14 |
| Karyotype | ||
| Complex, 5+ abnormalities | 7 | 25 |
| Complex, 3-4 abnormalities | 2 | 7 |
| Not complex (<3 abnormalities) | 9 | 32 |
| Unknown | 10 | 36 |
| Treatment history | ||
| Median time from diagnosis to sampling, y (range) | 7.9 (0.1-19.2) | |
| No. of treated patients at first sample | 26 | 93 |
| Median time from diagnosis to first treatment, y (range) | 2.0 (0-7.4) | |
| Median no. of previous treatments (range) | 4.5 (0-6) | |
| PI3K inhibitors used in this study | ||
| Idelalisib (PI3Kδ) | 22 | 78 |
| Pilaralisib (pan-PI3K) | 3 | 11 |
| Voxtalisib (pan-PI3K/mTOR) | 3 | 11 |
FISH, fluorescence in situ hybridization; mTOR, mammalian target of rapamycin.
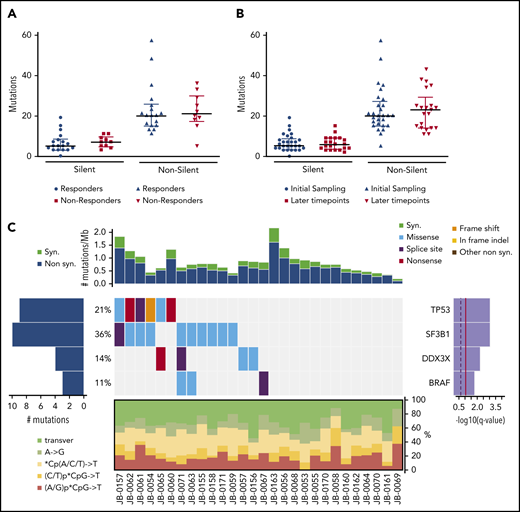
Somatic mutations identified by whole-exome sequencing. (A) Comparison of mutational load between responders (n = 18) and nonresponders (n = 10). (B) Comparison of mutational load between the first time point sample (initial, n = 28) and the lowest value for each patient among all their later time points (n = 21). Data are shown as median with interquartile range. P = not significant (Wilcoxon test) (A-B). (C) Overall genomic landscape of somatic single nucleotide variants at the time of first sampling. Top: synonymous (syn) and nonsynonymous (non syn) mutation rates are expressed as the number of mutations per Mb, with each column corresponding to the individual patient shown at the bottom. The heatmap in the middle represents significantly mutated genes as identified by MutSig2CV, with each gene listed on the right with its q value and the percentage of patients with at least 1 mutation in that gene. The heatmap shows individual patient mutations color-coded by type per the color key in the upper right corner. The panel at the bottom of the heatmap shows the distribution of individual base substitution types for each sample. transver, transversion.
Somatic mutations identified by whole-exome sequencing. (A) Comparison of mutational load between responders (n = 18) and nonresponders (n = 10). (B) Comparison of mutational load between the first time point sample (initial, n = 28) and the lowest value for each patient among all their later time points (n = 21). Data are shown as median with interquartile range. P = not significant (Wilcoxon test) (A-B). (C) Overall genomic landscape of somatic single nucleotide variants at the time of first sampling. Top: synonymous (syn) and nonsynonymous (non syn) mutation rates are expressed as the number of mutations per Mb, with each column corresponding to the individual patient shown at the bottom. The heatmap in the middle represents significantly mutated genes as identified by MutSig2CV, with each gene listed on the right with its q value and the percentage of patients with at least 1 mutation in that gene. The heatmap shows individual patient mutations color-coded by type per the color key in the upper right corner. The panel at the bottom of the heatmap shows the distribution of individual base substitution types for each sample. transver, transversion.
Distribution of driver and PI3K pathway mutations in relation to treatment response
Next, we compared the mutational landscape between responders and nonresponders. We found 7 genes to be exclusively mutated in nonresponders: BRAF (n = 5), KRAS (n = 2), MAP2K1 (n = 2), XPO1 (n = 1), PLEKHA1 (n = 1), NXF1 (n = 1), and INPPL1 (n = 1) (Figure 2A; supplemental Table 2). In a previous report that used whole-exome sequencing to identify CLL driver genes,12 MAPK-ERK pathway mutations were found in 8.7% of the patients, with at least 1 mutation in each of NRAS, KRAS, BRAF, and MAP2K1. However, in our cohort, we found MAPK pathway mutations (KRAS, BRAF, and MAP2K1) in 6 (60%) of 10 PI3K inhibitor nonresponders and in only 1 (5.5%) of 18 responders who carried an NRAS mutation (P < .005) (supplemental Figure 1A). Moreover, 3 patients have 2 mutations in MAPK pathway genes, suggesting extra selection, and all but 1 of the MAPK pathway mutations were subclonal (supplemental Table 2). Among the 5 patients with BRAF mutations, 3 had the mutation at the time of first sampling (Figure 1C). The fourth acquired a BRAF mutation with therapy, and the final patient showed a marked increase in CCF of the BRAF clone with therapy (supplemental Table 2). We further evaluated the CCF of these mutations during PI3K inhibitor therapy because mutations conferring resistance are likely to be positively selected and show increasing CCF values over time. In fact, the CCF values for MAP2K1 (P = .01) and PLEKHA1 (P < .001) mutations increased with time, potentially reflecting positive selection (Figure 2B). To further profile clonal evolution over time in responders compared with nonresponders, we analyzed patients with at least 3 serial samples (6 responders; 4 nonresponders) using the PhylogicNDT package for phylogenetic analysis, subclonal reconstruction, and tree building.18 We defined dynamic subclones as those showing at least a 10% difference in most likely CCFs between any 2 time points. A median of 2 dynamic subclones were seen per patient, and there was no difference between responders and nonresponders. To evaluate the biological pathways mutated in the nonresponder dynamic subclones, an enrichment analysis was performed comparing the mutated genes in the dynamic subclones to the C2 curated gene sets from the MSigDB database.19 The top 10 significantly enriched gene sets that overlap with the dynamic subclones are listed in supplemental Table 3A. Among the top 10 significantly enriched gene sets, 9 overlap with pathways associated with cancer or ERBB2 signaling that contains MAPK pathway genes (supplemental Table 3A-B). The NABA MATRISOME gene set overlapped with genes encoding extracellular matrix proteins in nonresponder dynamic subclones. The list of genes that are mutated in the nonresponder dynamic clones and that drive the overlap with these gene sets is provided in supplemental Table 3B.
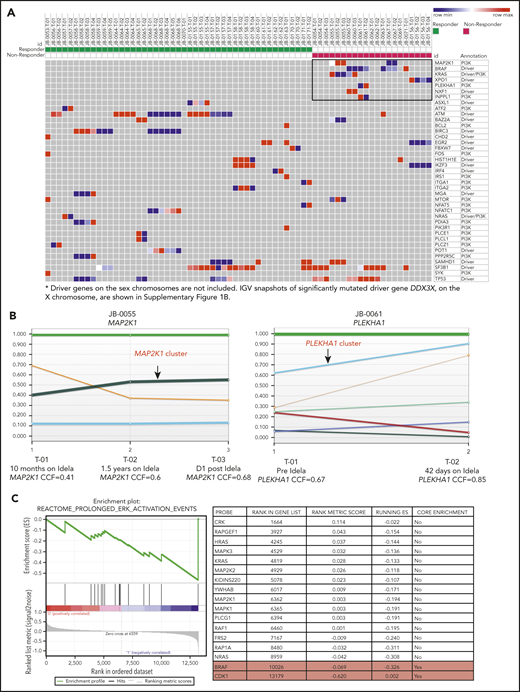
MAPK pathway mutations in PI3K inhibitor resistance to CLL. (A) Heatmap showing the distribution of mutations in selected genes based on response status. Previously described CLL drivers and PI3K pathway mutations from responders (left) and nonresponders (right) are plotted on the basis of their CCF values. In the heatmap, color gradation from blue (low) to red (high) indicates the range of CCF values. The 7 genes exclusively mutated in nonresponders are highlighted in the black box. (B) Clonal evolution of the mutations in MAP2K1 (in patient JB-0055) and PLEKHA1 (in patient JB-0061), derived by using the ABSOLUTE and PhylogicNDT tools. Each colored line represents a CCF distribution of a given gene cluster at different time points (T-01, T-02, and T-03 for JB-0055 and T-01 and T-02 for JB-0061). (C) Gene set enrichment analysis comparing the RNA-seq results from CLL samples before and after treatment with a PI3K inhibitor, from 2 primary nonresponders and 3 progressors after initial response. P < .001, q = 0.03. Idela, idelalisib.
MAPK pathway mutations in PI3K inhibitor resistance to CLL. (A) Heatmap showing the distribution of mutations in selected genes based on response status. Previously described CLL drivers and PI3K pathway mutations from responders (left) and nonresponders (right) are plotted on the basis of their CCF values. In the heatmap, color gradation from blue (low) to red (high) indicates the range of CCF values. The 7 genes exclusively mutated in nonresponders are highlighted in the black box. (B) Clonal evolution of the mutations in MAP2K1 (in patient JB-0055) and PLEKHA1 (in patient JB-0061), derived by using the ABSOLUTE and PhylogicNDT tools. Each colored line represents a CCF distribution of a given gene cluster at different time points (T-01, T-02, and T-03 for JB-0055 and T-01 and T-02 for JB-0061). (C) Gene set enrichment analysis comparing the RNA-seq results from CLL samples before and after treatment with a PI3K inhibitor, from 2 primary nonresponders and 3 progressors after initial response. P < .001, q = 0.03. Idela, idelalisib.
These results suggest that activation of the MAPK/ERK pathway may mediate resistance to PI3K inhibition. To test whether this enrichment in MAPK/ERK pathway genes at the mutational level translates into changes at the transcriptional level, we performed RNA sequencing (RNA-seq) analysis comparing longitudinal samples from 5 individuals prior to PI3K inhibitor therapy and after progression. Samples available for this analysis included those from 2 primary nonresponders and 3 progressors after initial response. Gene set enrichment analysis of the RNA-seq data showed enrichment in ERK activation at the postprogression time points (P < .001; q = .03) (Figure 2C). These pathway analysis results at the expression level suggest that RAS/MAPK signaling is significantly enriched among nonresponders, including both primary nonresponders and those with subsequent progression. On the basis of these findings, we hypothesized that alterations in MAPK/ERK activity are associated with both de novo and acquired resistance to PI3K inhibitor therapy.
AKT and ERK activation status in PI3K responders and nonresponders
Previous studies have shown that idelalisib inhibits signaling downstream of the BCR, including AKT and ERK activation.4 Hence, we profiled the relative phosphorylation of AKT (pAKT) and ERK1/2 (pERK1/2) in samples from the responder and nonresponder patient subgroups treated ex vivo with idelalisib and stimulated with anti-immunoglobulin M (IgM) (Figure 3A-D). When all patients were grouped, AKT phosphorylation was efficiently inhibited by idelalisib in both responders and nonresponders (10 responders, P < .001; 5 nonresponders, P < .001) (Figure 3A-B). However, ERK phosphorylation was significantly reduced by idelalisib only in responders compared with nonresponders (10 responders, P < .01; 5 nonresponders, P = 1.00) (Figure 3A,C). Fold inhibition in comparison with the vehicle-treated group also showed significant reduction in pERK levels in responders (Figure 3D) but no change in nonresponders (P < .05). However, fold inhibition of pAKT compared with the vehicle-treated group showed comparable inhibition between responders and nonresponders (P = .98; Figure 3D).
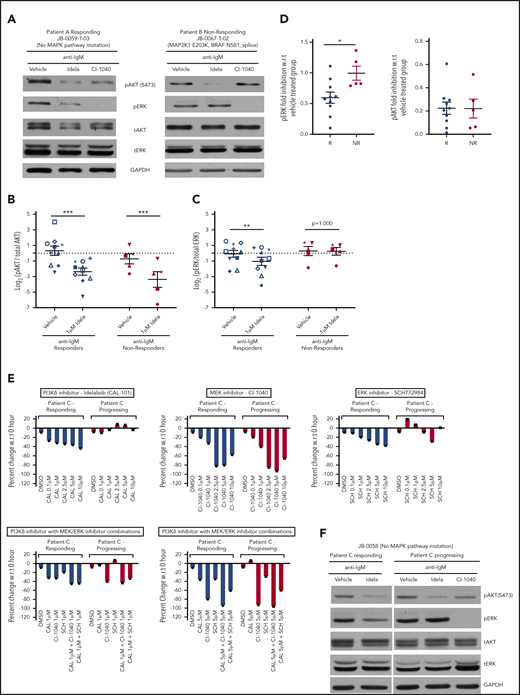
PI3K inhibitor nonresponders show upregulation of ERK1/2 signaling. (A) Western blot analysis of peripheral blood mononuclear cells (PBMCs) from a PI3K responding (left) and nonresponding (right) patient pretreated with either vehicle or 1 μM idelalisib (Idela) or 1 μM CI-1040 (MEK1/2 inhibitor) for 1 hour and stimulated with anti-IgM for 15 minutes. The samples were profiled for pERK, total ERK, pAKT, total AKT, and glyceraldehyde-3-phosphate dehydrogenase (GAPDH). Quantification of pAKT (B) and pERK (C) from 10 independent responders and 5 independent nonresponders. A different symbol is used for each patient to trace their response. The measurements were log transformed to satisfy statistical model assumptions. (D) Fold inhibition of pERK and pAKT with 1 μM idelalisib, in 10 responders (R) and 5 nonresponders (NR) compared with the vehicle-treated group. (E) CellTiter-Glo luminescent cell viability experiment at 48 hours for a patient who initially responded to idelalisib but later progressed on the drug. The patient’s PBMCs from responding and progressing time points were treated with the indicated doses of idelalisib, CI-1040 (MEK1/2 inhibitor), SCH772984 (ERK1/2 inhibitor), or a combination of idelalisib with either CI-1040 or SCH772984 at 1 μM and 5 μM concentrations. (F) Representative immunoblot of a sample from a patient with acquired resistance at responding and progressing time points. The sample was treated with either vehicle or 1 μM idelalisib or 1 μM CI-1040 for 1 hour and stimulated with anti-IgM for 15 minutes. The samples were profiled for pERK, total ERK, pAKT, total AKT, and GAPDH. Data are presented as mean ± standard error of the mean (SEM). ***P < .001; **P < .01; *P < .05 by mixed effects analysis of variance, Holm-Sidak test. CAL-101 (idela), idelalisib; DMSO, dimethyl sulfoxide; SCH, SCH772984 (a selective ERK1/2 inhibitor); w.r.t., with respect to.
PI3K inhibitor nonresponders show upregulation of ERK1/2 signaling. (A) Western blot analysis of peripheral blood mononuclear cells (PBMCs) from a PI3K responding (left) and nonresponding (right) patient pretreated with either vehicle or 1 μM idelalisib (Idela) or 1 μM CI-1040 (MEK1/2 inhibitor) for 1 hour and stimulated with anti-IgM for 15 minutes. The samples were profiled for pERK, total ERK, pAKT, total AKT, and glyceraldehyde-3-phosphate dehydrogenase (GAPDH). Quantification of pAKT (B) and pERK (C) from 10 independent responders and 5 independent nonresponders. A different symbol is used for each patient to trace their response. The measurements were log transformed to satisfy statistical model assumptions. (D) Fold inhibition of pERK and pAKT with 1 μM idelalisib, in 10 responders (R) and 5 nonresponders (NR) compared with the vehicle-treated group. (E) CellTiter-Glo luminescent cell viability experiment at 48 hours for a patient who initially responded to idelalisib but later progressed on the drug. The patient’s PBMCs from responding and progressing time points were treated with the indicated doses of idelalisib, CI-1040 (MEK1/2 inhibitor), SCH772984 (ERK1/2 inhibitor), or a combination of idelalisib with either CI-1040 or SCH772984 at 1 μM and 5 μM concentrations. (F) Representative immunoblot of a sample from a patient with acquired resistance at responding and progressing time points. The sample was treated with either vehicle or 1 μM idelalisib or 1 μM CI-1040 for 1 hour and stimulated with anti-IgM for 15 minutes. The samples were profiled for pERK, total ERK, pAKT, total AKT, and GAPDH. Data are presented as mean ± standard error of the mean (SEM). ***P < .001; **P < .01; *P < .05 by mixed effects analysis of variance, Holm-Sidak test. CAL-101 (idela), idelalisib; DMSO, dimethyl sulfoxide; SCH, SCH772984 (a selective ERK1/2 inhibitor); w.r.t., with respect to.
One of the patients in our cohort initially responded to idelalisib and subsequently progressed; this patient provided an opportunity to evaluate ERK activation status over time in relation to response in the setting of acquired resistance. We first assayed cellular metabolic activity after in vitro treatment with idelalisib, comparing the earlier responding time point with the later progressing time point. We observed a dose-dependent reduction in metabolic activity with idelalisib in the earlier sample, whereas no effect was seen in the progressing sample (Figure 3E). Similarly, idelalisib inhibited pERK in the responding sample, but not in the progressing sample (Figure 3F). Finally, we tested whether treatment with a MEK1/2 or ERK1/2 inhibitor would overcome this constitutive and persistent ERK activation. We found that the MEK1/2 inhibitor decreased both metabolic activity and ERK signaling at both the responding and progressing time points (Figure 3E-F). The ERK1/2 inhibitor alone showed limited decrease in metabolic activity at the progression time point, but in combination with idelalisib, it had significant activity (Figure 3E-F). Taken together, these data directly implicate ERK pathway activation in both primary and acquired resistance to idelalisib.
Activating mutations in MAP2K1 confer resistance to PI3K inhibitors
Because of the limited availability of primary patient samples, we prioritized mutations in MAP2K1, which lies immediately upstream of ERK, for further functional characterization. MAP2K1 is a previously reported CLL driver (2%)12 that was found to be mutated in 20% of the nonresponders (2 of 10; Q56P and E203K). We also found additional MAP2K1 mutations—4 patients with F53L and 1 patient with each of F53V, C121S, Y103C, and Q56P—in a separate cohort of patients with multiply relapsed CLL at The Ohio State University (Figure 4A). All of these mutations have been described as activating in solid tumors and have been linked with resistance to BRAF inhibitors.23,24 Given the higher frequency of F53L mutations, we selected this mutation, along with Q56P and E203K from our primary PI3K sequencing cohort, for further characterization.
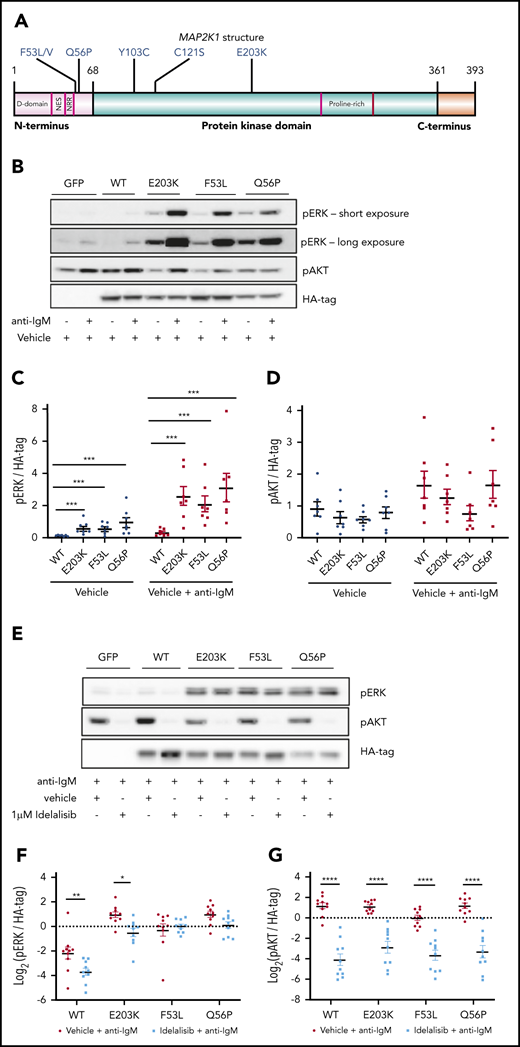
MEC1 cells overexpressing MAP2K1 mutations show constitutive ERK phosphorylation. (A) Graphical representation of MAP2K1 mutations identified in this PI3K resistance cohort and a relapsed refractory CLL cohort. (B) Representative immunoblot of MEC1 cells overexpressing WT and mutant MAP2K1, both unstimulated and with anti-IgM stimulation for 15 minutes. The labels on the top indicate the construct used: GFP only, WT MAP2K1, and MAP2K1 mutants (E203K, F53L, and Q56P). The cells were profiled for pERK, pAKT, and HA-tag. (C) Quantification of pERK from MEC1WT and MEC1MUT cells, unstimulated and after anti-IgM stimulation (n = 7 experiments). (D) Quantification of pAKT from MEC1WT and MEC1MUT cells, unstimulated and after anti-IgM stimulation (n = 7 experiments), showed no significant differences. (E) Representative immunoblot of MEC1 cells overexpressing WT or MAP2K1 mutants after in vitro treatment with either vehicle or 1 μM idelalisib for 1 hour and stimulation with anti-IgM for 15 minutes. (F) Quantification of pERK from MEC1WT and MEC1MUT cells after 1 μM idelalisib treatment in vitro (n = 10 experiments). (G) Quantification of pAKT from MEC1WT and MEC1MUT cells after 1 μM idelalisib treatment in vitro (n = 10 experiments). (F-G) The measurements were log transformed to satisfy statistical model assumptions. Data represented as mean ± SEM. ****P < .0005; ***P < .001; **P < .01; *P < .05.
MEC1 cells overexpressing MAP2K1 mutations show constitutive ERK phosphorylation. (A) Graphical representation of MAP2K1 mutations identified in this PI3K resistance cohort and a relapsed refractory CLL cohort. (B) Representative immunoblot of MEC1 cells overexpressing WT and mutant MAP2K1, both unstimulated and with anti-IgM stimulation for 15 minutes. The labels on the top indicate the construct used: GFP only, WT MAP2K1, and MAP2K1 mutants (E203K, F53L, and Q56P). The cells were profiled for pERK, pAKT, and HA-tag. (C) Quantification of pERK from MEC1WT and MEC1MUT cells, unstimulated and after anti-IgM stimulation (n = 7 experiments). (D) Quantification of pAKT from MEC1WT and MEC1MUT cells, unstimulated and after anti-IgM stimulation (n = 7 experiments), showed no significant differences. (E) Representative immunoblot of MEC1 cells overexpressing WT or MAP2K1 mutants after in vitro treatment with either vehicle or 1 μM idelalisib for 1 hour and stimulation with anti-IgM for 15 minutes. (F) Quantification of pERK from MEC1WT and MEC1MUT cells after 1 μM idelalisib treatment in vitro (n = 10 experiments). (G) Quantification of pAKT from MEC1WT and MEC1MUT cells after 1 μM idelalisib treatment in vitro (n = 10 experiments). (F-G) The measurements were log transformed to satisfy statistical model assumptions. Data represented as mean ± SEM. ****P < .0005; ***P < .001; **P < .01; *P < .05.
MEC1 and OSU-CLL cell lines were independently transduced with lentiviral vectors expressing green fluorescent protein (GFP) only (MEC1GFP, OSUGFP), GFP-containing hemagglutinin (HA)-tagged wild-type (WT) MAP2K1 (MEC1WT, OSUWT), or GFP-containing HA-tagged E203K, F53L, or Q56P MAP2K1 mutants (MEC1MUT, OSUMUT). All 3 mutations have been reported to increase baseline ERK phosphorylation in solid tumor models compared with WT.25,26 We therefore first determined the ERK phosphorylation status in MEC1 cells expressing these mutations under unstimulated (basal) or anti-IgM stimulated conditions (Figure 4B-D). Consistent with the previous studies in solid tumors, we found that all 3 MEC1MUT (E203K, F53L, and Q56P) showed increased ERK phosphorylation compared with MEC1WT in both unstimulated (E203K, P < .001; F53L, P < .001; Q56P, P < .001) and anti-IgM stimulated (E203K, P < .001; F53L, P < .001; Q56P, P < .001) conditions (n = 7 for both; Figure 4C). In contrast, no significant difference in AKT phosphorylation was observed when comparing MEC1WT and MEC1MUT in either unstimulated or anti-IgM stimulated conditions (n = 7; Figure 4D). Having observed constitutive ERK phosphorylation in the MEC1MUT, we hypothesized that the mutants would show reduced response to PI3K inhibition. We studied the effect of the PI3Kδ inhibitor idelalisib on ERK1/2 signaling in the MEC1 and OSU-CLL cell lines expressing either WT or mutant MAP2K1 (Figure 4E-G). We found that idelalisib inhibited pERK levels in MEC1WT and MEC1E203K (n = 10; P < .01). However, MEC1F53L and MEC1Q56P were resistant to pERK inhibition by idelalisib (Figure 4F). Similarly, in OSU-CLL cells, we found that idelalisib inhibited pERK levels only in the WT but not in any of the OSUMUT (supplemental Figure 2). In contrast, AKT phosphorylation was significantly inhibited by idelalisib in both MEC1MUT and MEC1WT cells under anti-IgM stimulated conditions (n = 10, P < .001 for both; Figure 4G) and in both OSUMUT and OSUWT cells (supplemental Figure 2).
Inhibition of MAPK pathway signaling restores sensitivity to idelalisib in MEC1 cells
Given the persistent activation of ERK1/2 in MEC1MUT after idelalisib treatment, we hypothesized that inhibition using CI-1040 (a selective MEK1/2 inhibitor)27 or SCH772984 (a selective ERK1/2 inhibitor)28 would overcome idelalisib resistance (Figure 5A-E). We observed that pERK levels in both MEC1WT and MEC1MUT cells were substantially reduced by treatment with either a MEK1/2 inhibitor (WT, P < .001; E203K, P < .001; F53L, P < .001; Q56P, P < .001) or an ERK1/2 inhibitor (WT, P < .001; E203K, P < .001; F53L, P < .001; Q56P, P < .001), but not by idelalisib alone in the mutants (WT, P < .05; E203K, P = .33; F53L, P = .67; Q56P, P = .61) (n = 3 for all; Figure 5B). The combination of idelalisib with either the MEK1/2 or the ERK1/2 inhibitor also greatly inhibited pERK levels in the MEC1MUT (WT, P < .001; E203K, P < .001; F53L, P < .001; Q56P, P < .001) (n = 3; Figure 5C). In addition, in both MEC1WT and MEC1MUT cells, treatment with either the MEK1/2 or ERK1/2 inhibitor alone did not have any effect on AKT phosphorylation (Figure 5D). However, treatment with idelalisib either alone or in combination with the MEK1/2 or ERK1/2 inhibitor substantially reduced pAKT levels in both MEC1WT and MEC1MUT cells (WT, P < .001; E203K, P < .001; F53L, P < .001; Q56P, P < .001) (n = 3; Figure 5D-E). Very similar results were obtained by using the US Food and Drug Administration–approved MEK1/2 inhibitor trametinib,29 which inhibited pERK in MEC1WT and MEC1MUT cells in a fashion similar to that of CI-1040 (supplemental Figure 3).
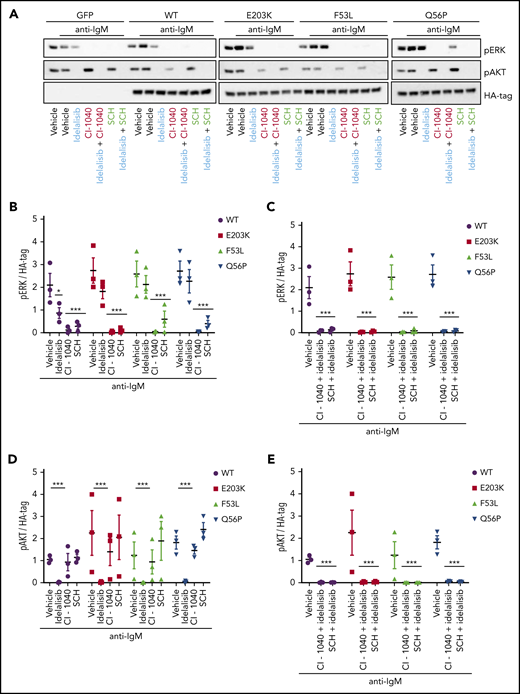
Inhibition of MAPK pathway signaling restores sensitivity to idelalisib in MEC1 cells overexpressing MAP2K1 mutants. (A) Representative immunoblot from MEC1 cell lines stably expressing WT and mutant MAP2K1 after 1-hour in vitro treatment with vehicle, 5 μM idelalisib, 5 μM CI-1040 (MEK1/2 inhibitor) or 5 μM SCH772984 (ERK1/2 inhibitor) alone or in combination followed by stimulation with anti-IgM for 15 minutes. (B) pERK densitometry analysis of MEC1WT and MEC1MUT cells after vehicle, 5 μM idelalisib, 5 μM CI-1040, or 5 μM SCH772984 treatment in vitro (n = 3) for 1 hour followed by stimulation with anti-IgM for 15 minutes. (C) pERK densitometry analysis of MEC1WT and MEC1MUT cells after combination treatment with 5 μM idelalisib and 5 μM CI-1040 or 5 μM idelalisib and 5 μM SCH772984 in vitro (n = 3) for 1 hour followed by stimulation with anti-IgM for 15 minutes. (D) pAKT densitometry analysis of MEC1WT and MEC1MUT cells after in vitro treatment with vehicle, 5 μM idelalisib, 5 μM CI-1040, or 5 μM SCH772984 (n = 3) for 1 hour followed by stimulation with anti-IgM for 15 minutes. (E) pAKT densitometry analysis of MEC1WT and MEC1MUT cells after combination treatment with 5 μM idelalisib with either 5 μM CI-1040 or 5 μM SCH772984 in vitro (n = 3) for 1 hour followed by stimulation with anti-IgM for 15 minutes. Data represented as mean ± SEM.***P < .001; *P < .05.
Inhibition of MAPK pathway signaling restores sensitivity to idelalisib in MEC1 cells overexpressing MAP2K1 mutants. (A) Representative immunoblot from MEC1 cell lines stably expressing WT and mutant MAP2K1 after 1-hour in vitro treatment with vehicle, 5 μM idelalisib, 5 μM CI-1040 (MEK1/2 inhibitor) or 5 μM SCH772984 (ERK1/2 inhibitor) alone or in combination followed by stimulation with anti-IgM for 15 minutes. (B) pERK densitometry analysis of MEC1WT and MEC1MUT cells after vehicle, 5 μM idelalisib, 5 μM CI-1040, or 5 μM SCH772984 treatment in vitro (n = 3) for 1 hour followed by stimulation with anti-IgM for 15 minutes. (C) pERK densitometry analysis of MEC1WT and MEC1MUT cells after combination treatment with 5 μM idelalisib and 5 μM CI-1040 or 5 μM idelalisib and 5 μM SCH772984 in vitro (n = 3) for 1 hour followed by stimulation with anti-IgM for 15 minutes. (D) pAKT densitometry analysis of MEC1WT and MEC1MUT cells after in vitro treatment with vehicle, 5 μM idelalisib, 5 μM CI-1040, or 5 μM SCH772984 (n = 3) for 1 hour followed by stimulation with anti-IgM for 15 minutes. (E) pAKT densitometry analysis of MEC1WT and MEC1MUT cells after combination treatment with 5 μM idelalisib with either 5 μM CI-1040 or 5 μM SCH772984 in vitro (n = 3) for 1 hour followed by stimulation with anti-IgM for 15 minutes. Data represented as mean ± SEM.***P < .001; *P < .05.
MEC1MUT and OSU-CLLMUT cells have attenuated sensitivity to idelalisib which is reversed by MAPK pathway inhibition
Because MAPK/ERK activation is important for cell growth and survival, we wanted to determine whether MEC1MUT showed increased growth compared with controls (MEC1GFP and MEC1WT). Indeed, we found that MEC1MUT had significantly higher cell counts at 72 hours than MEC1WT as measured by using CountBright absolute counting beads (E203K, P < .001; F53L, P < .01; Q56P, P < .001) (n = 6; Figure 6A). We next measured viability at 72 hours in MEC1WT and MEC1MUT (supplemental Figure 4A) and 96 hours in OSU-CLLWT and OSU-CLLMUT cells (Figure 6B) after treatment with PI3K and MEK1/2 inhibitors using the CellTiter-glo assay. We found that in both OSU-CLL and MEC1 cells, treatment with either the PI3K or MEK1/2 inhibitor resulted in a significant decrease in survival in both WT and mutant cells compared with their respective vehicle-treated controls (Figure 6B; supplemental Figure 4A). However, in comparing the survival of the WT and mutant cell lines after treatment with idelalisib, we found that the mutant cells showed greater survival (ie, they were relatively resistant) with both 5 µM (OSU: E203K, P = .06; F53L, P < .001; Q56P, P < .001; MEC1: F53L, P < .01; Q56P, P < .01) and 10 µM (OSU: E203K, P < .01; F53L, P < .001; Q56P, P < .001; MEC1: F53L, P < .001; Q56P, P < .01) idelalisib (n = 3 for both; Figure 6B; supplemental Figure 4A). The data suggest that cells expressing the Q56P mutation are the most resistant to PI3K inhibition, followed by cells expressing the F53L mutation and finally by cells expressing the E203K mutation. We note that in the OSU-CLL cell line, the MEK inhibitors alone lead to potent decrease in viability in all cell lines (WT, P < .001; E203K, P < .001; F53L, P < .001; Q56P, P < .001), but the combination of MEK1/2 and PI3K inhibition still has additive effects in most cell lines when compared with single-agent MEK1/2 inhibition (WT, P < .001; E203K, P = not significant; F53L, P < .001; Q56P, P < .001) (n = 3 for all cell lines; Figure 6B; supplemental Figure 5A). The MEC1 cell lines showed a diminished but still significant response to single-agent MEK1/2 or PI3K inhibition, but when the inhibitors were combined, they showed even greater reductions in viability (WT, P < .001; E203K, P < .001; F53L, P < .001; Q56P, P < .001) (n = 3; supplemental Figure 4A-B).
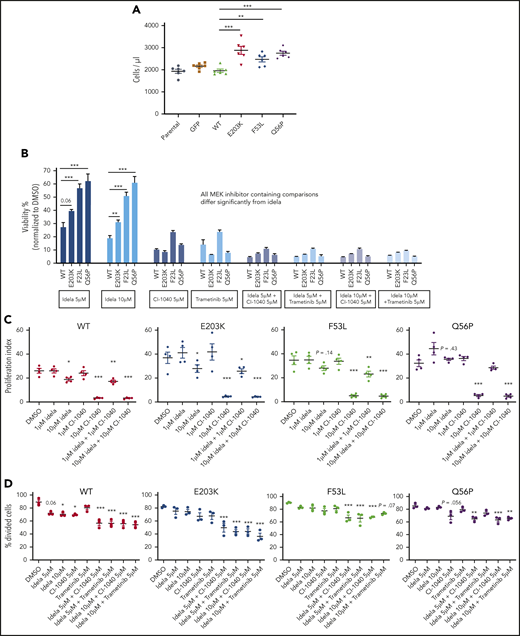
MEC1MUT and OSUMUT cells have attenuated sensitivity to idelalisib which is reversed by MAPK pathway inhibition. (A) Cell counts of MEC1 cells overexpressing WT or mutant MAP2K1, using CountBright absolute counting beads at 72 hours (n = 6). (B) CellTiter-glo luminescent cell viability was assessed at 96 hours on WT and mutant MAP2K1-expressing OSU-CLL cells. The cells were treated with the indicated doses of idelalisib (idela), a MEK1/2 inhibitor (CI-1040 or trametinib), or a combination of idelalisib with either CI-1040 or trametinib. (C) Proliferation of WT and mutant MAP2K1-expressing MEC1 cells was assessed following 48-hour serum starvation and labeling with the CellTrace Violet Proliferation Kit. The labeled cells were cultured on anti-IgM–coated plates for 7 days with vehicle control, idelalisib (1 μM or 10 μM), CI-1040 (1 μM or 10 μM), or the combination of idelalisib and CI-1040 (1 μM each or 10 μM each), and proliferation index was measured (n = 4). (D) OSU-CLL cells expressing WT and mutant MAP2K1 were synchronized by 48-hour serum starvation and labeled using the CellTrace Violet Proliferation Kit. The labeled cells were cultured with the indicated doses of vehicle control, idelalisib, CI-1040, trametinib, or the combination of idelalisib with either CI-1040 or trametinib and the percentage of divided cells was measured (n = 4). Data represented as mean ± SEM. ***P < .001; **P < .01; *P < .05.
MEC1MUT and OSUMUT cells have attenuated sensitivity to idelalisib which is reversed by MAPK pathway inhibition. (A) Cell counts of MEC1 cells overexpressing WT or mutant MAP2K1, using CountBright absolute counting beads at 72 hours (n = 6). (B) CellTiter-glo luminescent cell viability was assessed at 96 hours on WT and mutant MAP2K1-expressing OSU-CLL cells. The cells were treated with the indicated doses of idelalisib (idela), a MEK1/2 inhibitor (CI-1040 or trametinib), or a combination of idelalisib with either CI-1040 or trametinib. (C) Proliferation of WT and mutant MAP2K1-expressing MEC1 cells was assessed following 48-hour serum starvation and labeling with the CellTrace Violet Proliferation Kit. The labeled cells were cultured on anti-IgM–coated plates for 7 days with vehicle control, idelalisib (1 μM or 10 μM), CI-1040 (1 μM or 10 μM), or the combination of idelalisib and CI-1040 (1 μM each or 10 μM each), and proliferation index was measured (n = 4). (D) OSU-CLL cells expressing WT and mutant MAP2K1 were synchronized by 48-hour serum starvation and labeled using the CellTrace Violet Proliferation Kit. The labeled cells were cultured with the indicated doses of vehicle control, idelalisib, CI-1040, trametinib, or the combination of idelalisib with either CI-1040 or trametinib and the percentage of divided cells was measured (n = 4). Data represented as mean ± SEM. ***P < .001; **P < .01; *P < .05.
It is widely accepted that in solid tumors, PI3K inhibitors inhibit proliferation rather than induce cell death.30 Hence, we next decided to directly measure proliferation using a CellTrace Violet assay with continuous idelalisib treatment of 168 hours (day 7) in MEC1 cells or 96 hours (day 4) in OSU cells. In MEC1 cells, we found that 10 µM idelalisib led to a modest but significant decrease in proliferation in MEC1WT (n = 4; P < .05) compared with the decrease in MEC1MUT (E203K, P < .05; F53L, P = .14; Q56, P = .43) (n = 4; Figure 6C). Moreover, treating the cells with an MEK1/2 inhibitor either alone or with a PI3K inhibitor significantly decreased proliferation in both WT and mutant cell lines (WT, P < .001; E203K, P < .001; F53L, P < .001; Q56P, P < .001) (n = 4; Figure 6C). In OSU-CLL cells, idelalisib at 5 µM and 10 µM inhibits proliferation only in the WT cells (5 µM, P = .06; 10 µM, P < .05) and not in any of the mutants (n = 3; Figure 6D). Furthermore, treating the OSU-CLL cell lines with either 5 µM CI-1040 or trametinib alone had little (CI-1040: WT, P < .05; Q56P, P = .056) to no effect on proliferation (n = 3; Figure 6D). However, the combination of 5 µM CI-1040 or 5 µM trametinib with either 5 µM or 10 µM idelalisib significantly inhibited proliferation in both OSUWT and OSUMUT cells, providing a rationale for combination therapy (Figure 6D). Estimated effects of combination therapy compared with single-agent MEK or PI3K inhibition are shown with confidence intervals (CIs; 95% family-wise CIs) on log2-transformed data (supplemental Figure 5B), and they show that the separation of the CIs suggests additional benefit of the combination therapy in both WT and mutant OSU cells.
Discussion
In this study, we identify recurrent MAPK pathway mutations as mediators of primary resistance to PI3K inhibition in CLL. Our data further demonstrate that PI3K inhibitor nonresponders, regardless of mutation status, show enhanced MAPK signaling, with persistent activation of ERK1/2. MAP2K1 mutations found in PI3K inhibitor nonresponders were expressed in MEC1 and OSU-CLL cell lines, were found to confer resistance to idelalisib, and showed a selective growth advantage over WT. Treatment with MEK1/2 inhibitors either alone or in combination with idelalisib rescued this PI3K resistance in both primary leukemia cells and engineered cell lines, suggesting that the addition of MEK inhibitor either at the start of therapy or as an add-in therapy during early progression may overcome resistance to PI3K inhibitors.
The impact of somatic mutations in the MAPK pathway has not previously been studied in CLL, but here we demonstrate constitutive ERK activation associated with the MAP2K1 mutations seen in CLL. Our cohort is also enriched in patients with activating mutations in RAS or BRAF, which are expected to have a similar phenotype of ERK activation, and in fact we demonstrate this in the case of BRAF (supplemental Figure 6A-C). The clinical implications of this activation in other contexts is not yet known but, interestingly, activation of ERK1/2 has recently been reported with resistance to ibrutinib in both CLL31 and Waldenström macroglobulinemia.32 These data taken together suggest that ERK activation may represent a common bypass pathway for a variety of signaling inhibitors and raise the possibility that patients with preexisting mutations in MAP2K1 or the RAS/RAF/MAP2K1 pathway may also show reduced sensitivity to ibrutinib.
One of the patients in our cohort who initially responded to idelalisib later progressed. Idelalisib inhibited pERK1/2 at the responding time point but not at the resistant time point. Neither this patient nor several other PI3K nonresponders, none of whom showed pERK1/2 inhibition with idelalisib treatment, carried any MAPK pathway mutations. An interesting question emerging from these data are how MAPK signaling is upregulated in these patients in the absence of MAPK pathway mutations (supplemental Figure 7).
There are several hypothetical mechanisms. A recent report on CLL demonstrated elevated levels of IGF1R expression in idelalisib-treated patients at baseline and at progression compared with previously untreated CLL controls.33 Those authors showed that overexpression of IGF1R in A20 cells led to elevated pERK levels and resulted in decreased response to a PI3Kδ inhibitor. Their results were similar to our results with the MEK1/2 and ERK1/2 inhibitors: they found that inhibiting IGF1R using linsitinib reduced pERK levels and re-sensitized the cells to PI3Kδ inhibition. These findings are consistent with our data, suggesting that ERK upregulation through a variety of means leads to PI3K inhibitor resistance. Given these findings, we sought to clarify whether IGF1R may be a mechanism of ERK upregulation in our PI3K nonresponders. RNA-seq results showed no significant difference in IGF1R (P = .119) or IGF2R (P = .285) expression levels between PI3K pre- and posttreatment time points (supplemental Figure 8A). Furthermore, IGF1R protein levels by western blot were comparable between responders and nonresponders (P = .38) (supplemental Figure 8B), suggesting that this mechanism is not present in our cohort. However, in a more recent study,34 the authors showed that a subset of CLL patients with low IGF1R expression levels showed elevated expression of FGFR1, suggesting another possible mechanism of ERK upregulation in nonresponders without a MAPK pathway mutation.
Additional possible mechanisms involve an increase in the expression of inositol 1,4,5-triphosphate 3-kinase B (ITPKB). ITPKB leads to the production of IP4,35 which can enhance Ras signaling by competing with RasGAP (RASA3/GAP1IP4BP).35 Studies of mouse B cells36 suggest that IP4 sequesters RASA3/GAP1IP4BP, resulting in sustained Ras/ERK activation and increased B-cell survival. Preliminary analysis of our RNA-seq data from patients before and after receiving PI3K inhibitors shows that ITPKB expression (P = .06) increases and RASA3/GAP1IP4BP expression significantly decreases (P = .0019) at the time points after PI3K inhibitor administration (supplemental Figure 9A-B). This hypothesis needs to be further tested and validated in experimental and clinical settings.
In summary, our findings provide evidence that MAPK pathway mutations drive primary resistance to PI3K inhibitors in CLL. We identified MAP2K1 (20%) and MAPK pathway mutations (60%) as being enriched among patients for whom treatment with PI3K inhibitors failed. By using peripheral blood mononuclear cells from patients with both de novo and acquired resistance, as well as MEC1 and OSU-CLL cells overexpressing MAP2K1 mutations, we demonstrated that persistent ERK1/2 activation mediates PI3K inhibitor resistance in CLL. We also provide evidence that the addition of either MEK1/2 or ERK1/2 inhibitors alone or in combination with idelalisib abolishes the protective effects triggered by ERK1/2 activation. Although our findings would ideally be confirmed in an independent patient cohort, these results nevertheless suggest that the strategy of treating patients with a combination of PI3K and MAPK pathway inhibitors at the start of therapy, or with the latter as an add-in during early progression, could reduce or control PI3K resistance. Several MEK1/237 and ERK1/238 inhibitors are in clinical trials, and a combination clinical trial is under consideration.
For original data, please contact Jennifer R. Brown by e-mail at jennifer_brown@dfci.harvard.edu.
Presented in abstract form at the 60th Annual Meeting and Exposition of the American Society of Hematology, San Diego, CA, 3 December 2018.
The online version of this article contains a data supplement.
The publication costs of this article were defrayed in part by page charge payment. Therefore, and solely to indicate this fact, this article is hereby marked “advertisement” in accordance with 18 USC section 1734.
The data reported in this article have been deposited in the dbGAP database (accession number phs000879.v2.p1).
There is a Blood Commentary on this article in this issue.
Acknowledgments
The authors thank all the patients and their families who participated in the PI3K inhibitor clinical trials and who were willing to donate their samples for this research, and the CLL group at The Ohio State University for the development and characterization of a novel CLL cell line (OSU-CLL), which was received as a generous gift from them.
This work was supported by a grant from the National Institutes of Health, National Cancer Institute (R01 CA 213442) (principal investigator, J.R.B.), and by Gilead Sciences. G.G. was partially funded by the Paul C. Zamecnick Chair in Oncology at the Massachusetts General Hospital Cancer Center.
Authorship
Contribution: J.R.B., A.J., S.K., and I.M. designed the research; J.R.B., A.J., I.M., S.K., A.N., J.K.K., S.D., E.M.T., G.I., D.L., and I.L. performed the research and collected the data; J.R.B., A.J., and G.G. contributed vital new reagents or analytical tools; I.M., S.K., S.T., D.L., I.L., E.M.T., A.N., and J.K.K. analyzed and interpreted the data and performed statistical analyses; I.M., J.R.B., S.K., A.N., J.K.K., E.M.T., G.I., S.T., D.L., I.L., S.D., S.M.F., G.G., and A.J. wrote the manuscript; S.M.F. provided administrative support (ie, biobanking, managing, and organizing samples); and J.R.B. supervised the study.
Conflict-of-interest disclosure: J.R.B. has served as a consultant for AbbVie, Acerta, AstraZeneca, Beigene, Catapult, Dynamo Therapeutics, Eli Lilly, Genentech/Roche, Juno/Celgene/Bristol Myers Squibb, Loxo, MEI Pharma, Nextcea, Novartis, Pfizer, Pharmacyclics, Rigel, and Verastem; received research funding from Gilead, Loxo, Sun, TG Therapeutics and Verastem; and served on data safety monitoring committees for Invectys. G.G. received research funds from IBM and Pharmacyclics; is an inventor in patent applications related to MuTect, ABSOLUTE, MutSig, MSMuTect, MSMutSig, MSIdetect, POLYSOLVER, and TensorQTL; and is a founder and consultant and has privately held equity in Scorpion Therapeutics. I.L. is a consultant for PACT Pharma Inc. The remaining authors declare no competing financial interests
The current affiliation for S.D. is Janssen Research and Development, Raritan, NJ.
The current affiliation for A.J. is Vincerx Pharma, Palo Alto, CA.
The current affiliation for S.K. is Takeda, Cambridge, MA.
Correspondence: Jennifer R. Brown, Dana-Farber Cancer Institute, Harvard Medical School, 450 Brookline Ave, Boston, MA 02215; e-mail: jennifer_brown@dfci.harvard.edu.

This feature is available to Subscribers Only
Sign In or Create an Account Close Modal