

Key Points
Multiple mechanisms of acquired CD19 mutations contribute to CD19 loss and relapse with blinatumomab.
Identification of CD19 ex2part alternative splicing levels represents a new biomarker predictive of blinatumomab resistance or failure.

Abstract
Blinatumomab, a bispecific antibody that directs CD3+ T cells to CD19+ tumor cells, shows variable efficacy in B-progenitor acute lymphoblastic leukemia (B-ALL). To determine tumor-intrinsic and -extrinsic determinants of response, we studied 44 adults with relapsed or refractory B-ALL (including 2 minimal residual disease positive) treated with blinatumomab using bulk tumor and single-cell sequencing. The overall response rate in patients with hematological disease was 55%, with a high response rate in those with CRLF2-rearranged Philadelphia chromosome–like ALL (12 [75%] of 16). Pretreatment samples of responders exhibited a tumor-intrinsic transcriptomic signature of heightened immune response. Multiple mechanisms resulted in loss of CD19 expression, including CD19 mutations, CD19-mutant allele-specific expression, low CD19 RNA expression, and mutations in CD19 signaling complex member CD81. Patients with low hypodiploid ALL were prone to CD19− relapse resulting from aneuploidy-mediated loss of the nonmutated CD19 allele. Increased expression of a CD19 isoform with intraexonic splicing of exon 2, CD19 ex2part, at baseline or during therapy was associated with treatment failure. These analyses demonstrate both tumor-intrinsic and -extrinsic factors influence blinatumomab response. We show that CD19 mutations are commonly detected in CD19− relapse during blinatumomab treatment. Identification of the CD19 ex2part splice variant represents a new biomarker predictive of blinatumomab therapy failure.
Introduction
Blinatumomab, a CD19/CD3 bispecific T-cell engager, promotes T cell–mediated cytotoxicity on B-cell lymphoblasts by directing CD3+ T cells toward CD19+ B cells. It has shown promise in the treatment of relapsed/refractory (R/R) B-cell precursor acute lymphoblastic leukemia (B-ALL), with longer median overall survival observed with single-agent blinatumomab compared with salvage chemotherapy alone.1 Treatment with blinatumomab is also associated with superior minimal residual disease (MRD) response rates in patients with MRD+ ALL, and response rates are generally higher in patients with lower disease burden.2,3
However, many patients do not respond or subsequently relapse, and the mechanisms underlying treatment response and resistance are unclear. Several immune evasion mechanisms have been demonstrated to contribute to blinatumomab resistance. Higher levels of regulatory T cells, measured by CD4/CD25/FOXP3 expression, are associated with decreased response to blinatumomab because of interleukin-10 (IL-10)–mediated suppression of T-cell proliferation.4 Expression of programmed death ligand-1, the binding ligand of inhibitory checkpoint molecule programmed death-1, was increased in R/R tumors exhibiting poor response to blinatumomab, highlighting tumor cell–mediated inhibition of T-cell function as an immune escape mechanism.5,6
CD19− relapse is associated with blinatumomab failure, with various rates observed among different studies (8% to 35%),7-9 although the molecular mechanism of blinatumomab-induced CD19 loss is largely unknown. Studies from CD19-directed chimeric antigen receptor (CAR) T-cell therapy (CTL019, tisagenlecleucel) report CD19 truncating mutations and loss of heterozygosity as the causes of CD19 loss.10 Several case studies also report lineage switch of KMT2A- and ZNF384-rearranged B-ALL to acute myeloid leukemia after blinatumomab or CAR19 treatment, resulting in the loss of CD19 and other B-cell surface markers.11-14 However, a comprehensive study identifying predictors of response to and relapse with blinatumomab is lacking. The goals of this study were to investigate the genomic, immune cell, and microenvironmental features associated with response to blinatumomab using transcriptome and genome sequencing and single-cell profiling.
Methods
Patients and clinical specimens
We retrospectively studied 44 adult patients with R/R B-ALL treated with blinatumomab at City of Hope Medical Center between May 2012 and June 2018.7 Patients received up to 5 cycles of blinatumomab. Pretreatment refers to the time point of R/R disease during prior therapy and just before blinatumomab therapy was started. Pretreatment samples (n = 38) were from consecutive cases treated with blinatumomab who had ≥2 × 10⁶ cryopreserved bone marrow or peripheral blood mononuclear cells available (Figure 1A). When available, posttreatment samples from the same patient were analyzed. To study the mechanisms of CD19 loss, an additional 6 posttreatment samples were selected based on CD19 negativity. For bulk RNA sequencing (RNA-seq) and DNA-seq, tumor cells were enriched by fluorescence-activated cell sorting when samples contained <60% blasts. For bulk sequencing of pretreatment samples, 7 (35%) of 20 responder and 6 (33.3%) of 18 nonresponder samples were enriched. The study was approved by the institutional review boards of City of Hope Medical Center and St Jude Children’s Research Hospital, with informed consent.

Cohort characteristics and blinatumomab response. (A) CONSORT diagram of B-ALL patients included in the study. (B) Ribbon plot showing response to blinatumomab in each genomic subtype. Patients with full hematological disease (≥5% blasts; 42 of 44 patients) were included for response analysis. (C) Genomic alterations identified by whole-genome sequencing and whole-exome sequencing (WES) in blinatumomab responders compared with nonresponders (NRs). del, deletion; dim, diminished; ins, insertion; neg, negative; Ph, Philadelphia chromosome; pos, positive.
Cohort characteristics and blinatumomab response. (A) CONSORT diagram of B-ALL patients included in the study. (B) Ribbon plot showing response to blinatumomab in each genomic subtype. Patients with full hematological disease (≥5% blasts; 42 of 44 patients) were included for response analysis. (C) Genomic alterations identified by whole-genome sequencing and whole-exome sequencing (WES) in blinatumomab responders compared with nonresponders (NRs). del, deletion; dim, diminished; ins, insertion; neg, negative; Ph, Philadelphia chromosome; pos, positive.
Genomic analysis
Total stranded transcriptome sequencing (RNA-seq; 100-bp paired-end reads) was performed using the TruSeq Stranded Total RNA library preparation kit, and sequencing was performed using HiSeq 4000 and NovaSeq 6000 platforms (Illumina). A low-input RNA library preparation kit (NuGen Ovation V2) was used for samples with limited material (2-100 ng). Genetic subtypes were determined by integrating gene expression, rearrangement, copy-number, and single-nucleotide variant (SNV)/insertion/deletion (indel) data as previously described.15 Details of mapping, gene expression analysis, and fusion detection are provided in the supplemental Methods (available on the Blood Web site).
Whole exome sequencing (WES) of genomic DNA was performed using the TruSeq DNA Exome library preparation kit (Illumina). Sequencing (100-bp paired-end reads) was performed using the NovaSeq 6000 platform (Illumina) to an average haploid coverage of 100×. Whole-genome sequencing libraries were prepared using the HyperPrep library preparation kit (Roche) and sequenced using the NovaSeq 6000 System (Illumina) to a target depth of 800 million 150-bp paired-end reads per sample for an average haploid coverage of 30×. Details of mapping and structural and copy-number variant detection are provided in the supplemental Methods. Genomic data are publicly available and have been deposited in the European Genome Phenome Archive (accession EGAS00001004027).
Details regarding additional experimental and molecular methods used in this study are provided in the supplemental Methods.
Results
Patient characteristics
We identified 44 patients with R/R B-ALL treated with blinatumomab. Eligibility criteria were treatment failure or progression of ALL after at least 1 prior therapy (supplemental Table 2). Detectable disease (≥5% blasts) was found in the bone marrow or peripheral blood of 42 patients (95%). Demographic and clinical features are summarized in Table 1. The median number of prior therapies was 2 (range, 1-5). Prior allogeneic hematopoietic stem cell transplantation (HCT) had failed in nine patients (20%). One patient had received the CD22 antibody-drug conjugate inotuzumab ozogamicin. The median patient age was 35 years (range, 18-75), and 29 patients (65.9%) had Hispanic ancestry. The median white blood cell count was 2.95 × 10⁹/L (range, 0.1 × 10⁹/L to 21 × 109/L), and the median percentage of bone marrow blasts before treatment was 80%. The cohort was divided into responders (those who achieved complete remission by morphology using standard International Working Group criteria16 ; n = 25) and nonresponders (n = 19). Nine responders (36%) subsequently underwent allogeneic HCT after attaining remission with blinatumomab. Samples obtained before blinatumomab treatment (pretreatment) were available for 38 patients. We also studied 16 samples obtained after blinatumomab treatment (posttreatment): 11 patients who achieved complete remission but subsequently relapsed, and 5 of the 19 patients who were refractory to blinatumomab (Figure 1A; supplemental Figure 1; supplemental Table 2). Of the 11 patients with postblinatumomab relapse samples, 8 relapsed during blinatumomab therapy (CD19−, n = 6; CD19+, n = 2), 1 after completion of blinatumomab who did not undergo allogeneic HCT (SJBALL042232, CD19−) and 2 after completion of blinatumomab and after subsequent allogeneic HCT (SJALL055655, CD19+; SJALL055662, CD19 weak). Ten of the 11 samples were collected shortly after the first relapse post-blinatumomab, whereas SJBALL042245_R2 was collected at a later time point (after relapse with blinatumomab and subsequent relapse with additional therapies).
Patient demographics and clinical characteristics (N = 44)
| n (%) | |
|---|---|
| Age, y | |
| Median | 34.5 |
| Range | 18-75 |
| Sex | |
| Male | 29 (66) |
| Female | 15 (34) |
| Race | |
| African American | 2 (4.5) |
| Hispanic | 29 (66) |
| White | 8 (18) |
| Other | 5 (11) |
| Sample collection | |
| Pretreatment only | 28 |
| Pretreatment/posttreatment | 10 |
| Posttreatment only | 6 |
| WBC count, ×109/L | |
| Median | 3 |
| Range | 0.1-21 |
| Salvage treatment phase | |
| First | 14 (32) |
| Second | 11 (25) |
| Third | 12 (27) |
| Fourth | 6 (14) |
| Fifth | 1 (2) |
| BM blast percentage, % | |
| Median | 80 |
| Range | 0.2-100 |
| <5 | 1 (2.3) |
| ≥5 to ≤50 | 13 (30) |
| >50 | 25 (57) |
| Unknown | 5 (11) |
| Cytogenetics | |
| Standard risk | 36 (82) |
| High risk (Ph+, hypodiploid) | 8 (18) |
| CD19 expression on leukemic blasts | |
| Weak/diminished | 5 (14) |
| Strong | 32 (86) |
BM, bone marrow; WBC, white blood cell.
Response to blinatumomab
Patients with full hematological disease (42 of 44 patients) were included for response analysis. Two patients with MRD+ disease relapsed during blinatumomab treatment with CD19− disease, and their posttreatment samples were collected for analysis of mechanisms of CD19− relapse analysis. Overall, 23 (55%) of 42 patients achieved complete remission with blinatumomab treatment, whereas 19 patients did not respond. A lower disease burden (defined as bone marrow blasts ≤50%) was associated with increased response to blinatumomab, as reported previously7 (P = .039). We next investigated whether genomic subtype was associated with response to blinatumomab. Focusing on the pretreatment samples, we performed total stranded conventional input (n = 29) or low-input transcriptome sequencing (RNA-seq; n = 6) and whole-genome sequencing (n = 31) or WES (n = 31; collectively termed DNA-seq). An overview of the cohort is provided in supplemental Table 2. Genetic subtypes were determined by integrating gene rearrangement, DNA copy-number, SNV/indel, and gene expression data (supplemental Tables 3 and 4).15 The prevalence of Ph-like ALL was 54.8% (23 of 42 patients); 21 (91%) of these patients had Hispanic ancestry. The high prevalence of Hispanic ancestry and Ph-like ALL was reflective of the adult ALL population treated at City of Hope. Sixteen (70%) of 23 Ph-like ALL patients had CRLF2 rearrangement (either P2RY8-CRLF2 [n = 4] or IGH-CRLF2 [n = 12]). Four of the remaining patients with Ph-like ALL harbored IGH-EPOR, 2 harbored NUP214-ABL1, and 1 harbored a TERF-JAK2 rearrangment. Four patients had low-hypodiploid ALL (modal chromosome number 31-39; 9.5%). The prevalence of other B-ALL subtypes was low: KMT2A-like, 7.1%; low hyperdiploid (47-49 chromosomes), 4.8%; PAX5alt, 4.8%; Ph, 4.8%; hyperdiploid (≥50 chromosomes), 2.4%; DUX4 rearranged, 2.4%; and TCF3-PBX1, 2.4%; 7.1% could not be classified (Table 2). We observed a high response rate of 75% (12 of 16) for CRLF2-R Ph-like ALL, 57% (4 of 7) for non–CRLF2-rearranged Ph-like ALL, 50% (2 of 4) for low-hypodiploid ALL, and 33% (5 of 15) for other subtypes (Table 2).
Response to blinatumomab by genomic subtype
| Subtype | n (%) | |||||
|---|---|---|---|---|---|---|
| Patients | Responders | Age >50 y | BM blast >50% | Prior allogeneic HCT | Salvage treatment phase ≥third | |
| Ph-like, CRLF2 rearranged | 16 (38.1) | 12 (75) | 2 (12.5) | 11 (68.8) | 3 (18.8) | 7 (43.8) |
| Ph-like, non-CRLF2 | 7 (16.7) | 4 (57.1) | 1 (14.3) | 2 (28.6) | 2 (28.6) | 2 (28.6) |
| Low hypodiploid | 4 (9.5) | 2 (50) | 1 (25) | 2 (50) | 0 (0) | 2 (50) |
| KMT2A-like* | 3 (7.1) | 3 (100) | 2 (66.7) | 2 (66.7) | 0 (0) | 2 (66.7) |
| B-ALL unclassified | 3 (7.1) | 1 (33.3) | 2 (66.7) | 2 (66.7) | 1 (33.3) | 1 (33.3) |
| Low hyperdiploid | 2 (4.8) | 1 (50) | 0 (0) | 2 (100) | 1 (50) | 2 (100) |
| PAX5alt | 2 (4.8) | 0 (0) | 1 (50) | 0 (0) | 0 (0) | 1 (50) |
| BCR-ABL1 | 2 (4.8) | 0 (0) | 1 (50) | 2 (100) | 2 (100) | 2 (100) |
| DUX4 | 1 (2.4) | 0 (0) | 0 (0) | 0 (0) | 0 (0) | 0 (0) |
| High hyperdiploid | 1 (2.4) | 0 (0) | 1 (100) | 1 (100) | 0 (0) | 0 (0) |
| TCF3-PBX1 | 1 (2.4) | 0 (0) | 0 (0) | 1 (100) | 0 (0) | 0 (0) |
Patients with full hematological disease (≥5% blasts; 42 of 44 patients) were included in this table. The 2 patients with only MRD+ disease before receiving blinatumomab (SJALL061895 and SJALL061897) were excluded.
BM, bone marrow.
One KMT2A-like case had USP42-AFF3 fusion; no known driver fusion was identified for the other 2 cases.
Leukemogenic genetic mutations do not predict response to blinatumomab
There were no significant differences observed between responders and nonresponders in the somatic genetic alterations of 5 major leukemia pathways: transcriptional regulation of B-cell development (88% vs 79%; P = .64), cell-cycle regulation (75% vs 64%; P = .69), transcriptional regulation (excluding B-lineage transcription factors; 81% vs 86%; P = .99), chromatin regulation and histone modification (69% vs 86%; P = .40), and signaling (56% vs 29%; P = .16; Figure 1C). Notably, alteration of IKZF1, a known determinant of poor response in chemotherapy-treated cohorts,17,18 was higher in responders than nonresponders (75% vs 50%), indicating alteration of this gene is not a prognostic factor for blinatumomab treatment.
Heightened immune response signature in responders
To explore additional determinants of response to blinatumomab, gene expression signatures of pretreatment samples were studied using total stranded RNA-seq (n = 29; responders, n = 14; nonresponders, n = 15). Differential gene expression analysis identified 227 upregulated genes in responders and 118 upregulated genes in nonresponders (P < .05; fold-change >2 and counts per million >1; Figure 2A-B; supplemental Table 5). STRING19 protein-protein interaction network analysis was then performed using the upregulated genes from responders. This included 3 independent types of interaction: coexpression, biochemical/genetic data (experimentally determined), and previously curated pathway and protein-complex knowledge (from curated databases). Upregulated genes in responders corresponded to a well-connected interaction network centered around the immune response, whereas upregulated genes in nonresponders lacked a connectivity network (Figure 2C). In addition, the upregulated genes in responders harbored enrichment of GO pathways involving immune system processes (GO:0002376; P = 1.46 × 10⁻¹¹), cell activation (GO:0001775; P = 4.07 × 10−09), and immune response (GO:0006955; P = 1.48 × 10−08; Figure 2D; supplemental Table 6). In contrast, GO enrichment for biological processes was not observed in the network of upregulated genes in nonresponders.

Heightened immune response signature in blinatumomab responders. (A) Supervised hierarchical clustering of differential gene expressions showing upregulated genes in responders (n = 227 genes) and nonresponders (n = 118 genes). (B) Differential gene expression in responders. Protein coding genes with log counts per million (CPMs) >0 displayed. P < .01 and log2 fold-change >1 (red dots); P < .01 and log2 fold-change <1 (blue dots). (C) STRING (Search Tool for Retrieval of Interacting Genes/Proteins) protein-protein interaction network of upregulated genes (n = 227) in responders. The minimum required interaction score was set to 0.4, and the disconnected nodes were removed. (D) Enrichment of Gene Ontology (GO) pathways in responders. (E) Significantly enriched gene set enrichment analysis (GSEA) gene sets in responders. FDR, false discovery rate; NOM, nominal; TNFα, tumor necrosis factor α.
Heightened immune response signature in blinatumomab responders. (A) Supervised hierarchical clustering of differential gene expressions showing upregulated genes in responders (n = 227 genes) and nonresponders (n = 118 genes). (B) Differential gene expression in responders. Protein coding genes with log counts per million (CPMs) >0 displayed. P < .01 and log2 fold-change >1 (red dots); P < .01 and log2 fold-change <1 (blue dots). (C) STRING (Search Tool for Retrieval of Interacting Genes/Proteins) protein-protein interaction network of upregulated genes (n = 227) in responders. The minimum required interaction score was set to 0.4, and the disconnected nodes were removed. (D) Enrichment of Gene Ontology (GO) pathways in responders. (E) Significantly enriched gene set enrichment analysis (GSEA) gene sets in responders. FDR, false discovery rate; NOM, nominal; TNFα, tumor necrosis factor α.
To further define novel pathways associated with response, GSEA20 was performed with all expressed genes. In responders, 12 of 50 hallmark gene sets were significantly enriched at a false discovery rate <25% (supplemental Table 7), with no gene sets significantly enriched in nonresponders. Using ImmuneSigDB (immunological signatures collection), 1010 (of 4872) gene sets were enriched in responders at a false discovery rate <25% and 733 gene sets at nominal P < .05. One of the most significantly enriched hallmark pathways in responders compared with nonresponders was IL-6–JAK–STAT3 signaling (P = .0044; Figure 2E). Considering CRLF2-rearranged tumor cells exhibit constitutive JAK-STAT activation,21 and 57% (8 of 14) of responders in our cohort had CRLF2 rearrangement, we confirmed enrichment of IL-6–JAK–STAT3 in CRLF2-rearranged and non–CRLF2-rearranged responders independently compared with nonresponders (supplemental Figure 2). This indicates that IL-6–JAK–STAT3 enrichment is a hallmark of response irrespective of somatic tumor cell genetics. Additional hallmark pathways with significant enrichment in responders included tumor necrosis factor α signaling via NF-κB and the inflammatory response characterized by IL genes (Figure 2E). There was no overlap in leading-edge genes between these sets.
Single-cell analysis identifies immune signature in tumor cells and differences in T-cell subsets between responders and nonresponders
To determine the cell type responsible for the gene expression signature observed in responders, single-cell RNA-seq (sc-seq) incorporating T-cell clonality analysis using the 10× Genomics platform was performed on 4 pretreatment samples, including 2 responders and 2 nonresponders (Figure 3A-B). Cell types were assigned based on expression of key genes (CD19+ tumor, CD16+ monocytes, CD14+ monocytes, natural killer cells, and T cells; supplemental Figure 3), and GSEA was performed on the sc-seq data using a custom responder signature gene set identified from the bulk RNA-seq (supplemental Table 5). We observed enrichment of this custom gene set in the CD19+ tumor cells from the 2 responders (normalized enrichment score, 1.77; P < .0001), but no enrichment in other cell types, indicating the tumor cells were the source of the responder signature observed in bulk RNA-seq (Figure 3C).

Single-cell analysis of tumor mix cells. (A) Workflow for identifying tumor cells, T cells, and nontumor non–T cells for single-cell analysis by 10× Genomics in 2 responders, 2 nonresponders, and 1 postblinatumomab relapse sample. (B) tSNE plots of tumor mix cells showing 2 responders and 2 nonresponders visualized by sample, responder/nonresponder, and cell type. SJALL061890_R1 (n = 4512 cells), SJALL061888_R1 (n = 10 129 cells), SJALL061885_R1 (n = 4470 cells), and SJALL061884_R1 (n = 6275 cells). (C) GSEA of 10× Genomics 5′ gene expression of tumor mix cells showing enrichment of blinatumomab responder signature identified in bulk RNA-seq in CD19+ tumor cells from responders. BM, bone marrow; FACS, fluorescence-activated cell sorting; HSC, hematopoietic stem cell; NES, normalized enrichment score; NOM, nominal; PBMC, peripheral blood mononuclear cell; tSNE, t-distributed stochastic neighbor embedding.
Single-cell analysis of tumor mix cells. (A) Workflow for identifying tumor cells, T cells, and nontumor non–T cells for single-cell analysis by 10× Genomics in 2 responders, 2 nonresponders, and 1 postblinatumomab relapse sample. (B) tSNE plots of tumor mix cells showing 2 responders and 2 nonresponders visualized by sample, responder/nonresponder, and cell type. SJALL061890_R1 (n = 4512 cells), SJALL061888_R1 (n = 10 129 cells), SJALL061885_R1 (n = 4470 cells), and SJALL061884_R1 (n = 6275 cells). (C) GSEA of 10× Genomics 5′ gene expression of tumor mix cells showing enrichment of blinatumomab responder signature identified in bulk RNA-seq in CD19+ tumor cells from responders. BM, bone marrow; FACS, fluorescence-activated cell sorting; HSC, hematopoietic stem cell; NES, normalized enrichment score; NOM, nominal; PBMC, peripheral blood mononuclear cell; tSNE, t-distributed stochastic neighbor embedding.
Eight different clusters were identified within the T-cell sc-seq data using multiple cell markers (Figure 4A; supplemental Figure 4). We observed differences in cluster cell proportion between responders and nonresponders (Figure 4B). Cluster CD4_stem was characterized by expression of LEF1 and TCF7, suggestive of stem cell–like features,22 with a significantly higher frequency of these cells present in responders compared with nonresponders (32.1% vs 8.2%; P = 1.31 × 10−245). This cluster also exhibited moderate clonal complexity (438 unique clones for 1708 T cells). Cluster CD8_memory, which exhibited the lowest TCR clonal diversity of all clusters, was composed of central memory CD8+ T cells (IL7R, SELL), and responders similarly demonstrated a higher frequency of these cells compared with nonresponders (8.9% vs 2.8%; P = 3.45 × 10−61). Cluster CD8_exhausted showed high expression of LAG3, TIM3, and CD8, suggestive of an exhausted phenotype, with more cells of this subtype present in nonresponders than responders (4.2% vs 0.7%; P = 4.12 × 10−43). The frequency of CD4 regulatory T cells was similar between responders and nonresponders (5% vs 3.7%; P = 1.34 × 10⁻⁴). Almost no evidence of clonal expansion was observed in these 2 clusters. Together, these data suggest that a superior response to blinatumomab is associated with an increase in naïve and central memory T cells that are more capable of mounting an effective immune response, whereas an inferior response is characterized by an increase in exhausted T cells.
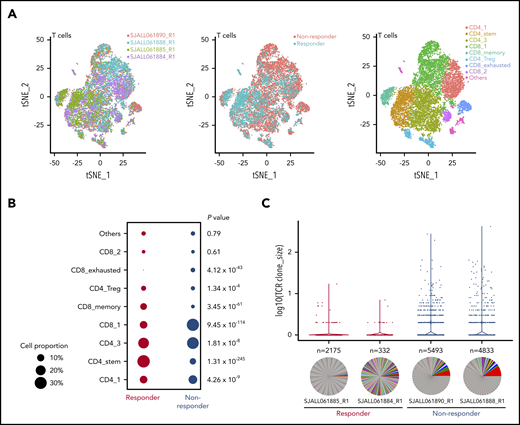
Single-cell analysis of T cells. (A) t-distributed stochastic neighbor embedding (tSNE) plots of CD3+ T cells showing 2 responders and 2 nonresponders visualized by sample, responder/nonresponder, and T-cell type. SJALL061890_R1 (n = 7814 cells), SJALL061888_R1 (n = 10 807 cells), SJALL061885_R1 (n = 3557 cells), and SJALL061884_R1 (n = 1979 cells). (B) Proportion of different T-cell subsets present in responders compared with nonresponders. P value determined using Fisher’s exact test. (C) T-cell receptor (TCR) clonal expansion in responders and nonresponders. Clone size is shown on the y-axis. The number of different clones identified in each case is indicated above the pie chart. Pie charts demonstrate clonal diversity. Responders had restricted clonal expansion and increased diversity. Treg, regulatory T cell.
Single-cell analysis of T cells. (A) t-distributed stochastic neighbor embedding (tSNE) plots of CD3+ T cells showing 2 responders and 2 nonresponders visualized by sample, responder/nonresponder, and T-cell type. SJALL061890_R1 (n = 7814 cells), SJALL061888_R1 (n = 10 807 cells), SJALL061885_R1 (n = 3557 cells), and SJALL061884_R1 (n = 1979 cells). (B) Proportion of different T-cell subsets present in responders compared with nonresponders. P value determined using Fisher’s exact test. (C) T-cell receptor (TCR) clonal expansion in responders and nonresponders. Clone size is shown on the y-axis. The number of different clones identified in each case is indicated above the pie chart. Pie charts demonstrate clonal diversity. Responders had restricted clonal expansion and increased diversity. Treg, regulatory T cell.
We next examined the TCR repertoire among the 4 pretreatment samples and found a striking enrichment of clonal expansions among the nonresponder T-cell populations. Conversely, the responder populations had a higher diversity of clonotypes, with fewer cells per clone (Figure 4C). Furthermore, nonresponders exhibited a significant enrichment of TRAV1-2/TRAJ33 junctions (1.24% to 1.74% vs 0% to 0.71%), which are generally indicative of mucosal-associated invariant T (MAIT) cells.23 Overall, these data indicate that response to blinatumomab is associated with a restricted TCR clonal expansion and increased diversity. Thus, the presence of clonally expanded T cells may abrogate an effective immune response.
Multiple mechanisms of CD19 loss contribute to blinatumomab relapse
Of the 11 postblinatumomab relapse samples in this cohort, 7 were CD19− and 4 remained CD19+ by flow cytometric analysis. Of the 7 CD19− samples, we identified 8 CD19 mutations in 5 patients, including frame-shift indels (n = 4), a nonsense mutation (n = 1), splice-site SNVs (n = 2), and an in-frame deletion (n = 1; Table 3). All mutations were located within the extracellular domain of CD19 (Figure 5A) and were unique to CD19− relapse patients, because none were identified in pretreatment or CD19+ relapse cases by either bulk RNA- or DNA-seq (Figure 5B). The frame-shift indels and nonsense mutations were predicted to result in truncated CD19 proteins lacking the transmembrane and cytoplasmic domain and thus not expressed on the cell surface. One of the splice-site SNVs was expressed at the RNA level and resulted in intron retention, whereas expression of the other SNV was not observed by low-input RNA-seq. Notably, the mutant allele fractions (MAFs; or sum of MAFs for tumors with >1 mutation) were proportional to the percentage of CD19− blast cells observed in each patient, suggesting all or nearly all tumor cells contained a CD19 mutation (Table 2; Figure 5C). Expression of 2 different CD19 p.Tyr259fs mutations (mutant 1, c.775 T>TGT; mutant 2, c.776 A>ATTGGAGATCCC) in NIH-3T3 cells confirmed the loss of CD19 cell surface expression by flow cytometry and immunofluorescence staining compared with wild-type CD19 (Figure 5D).
Mechanisms of CD19 loss during blinatumomab treatment
| Sample ID | CD19 LOH or CNA | CD19 mutations | Sum AF of CD19 mutations | CD19 RNA expression (log CPM) | Summary of CD19 loss |
|---|---|---|---|---|---|
| SJBALL042232_R2 | Loss of chromosome 16 | p.Y259fs (c.775 T>TGT) | 0.79 | Normal (5.3) | CD19 mutation |
| p.Y259fs (c.776 A>ATTGGAGATCCC) | Loss of chromosome 16 | ||||
| SJALL061897_R1 | Loss of chromosome 16 | p.K258fs (c.773 AGTATTAT>AAAAAAA) | 0.79 | Normal (5.2) | CD19 mutation |
| Loss of chromosome 16 | |||||
| SJALL061895_R1 | Loss of chromosome 16 | p.109fs (c.326 C>CA) | 0.65 | Normal (5.4) | CD19 mutation |
| p.Q186sp | Loss of chromosome 16 | ||||
| p.P278sp | |||||
| SJALL061893_R1 | No | p.P60del (c.179 CCTT>C) | 0.73 | Normal (6.1) | CD19 mutation |
| Allele-specific expression | |||||
| SJALL061894_R1 | No | p.S269* (c.806 C>A) | 0.15 | Low (0.4) | CD19 mutation |
| Allele-specific expression (low) | |||||
| SJBALL042246_R2 | No | None | 0 | Low (0.8) | Low level of CD19 expression |
| SJALL061896_R1 | No | None | 0 | Normal (6.2) | CD19 wild type |
| CD81 mutation |
CNA, copy-number abnormality; CPM, count per million; LOH, loss of heterozygosity.

Mechanisms of CD19 loss during blinatumomab treatment. (A) Protein domain plot of CD19 mutations identified in posttreatment CD19− relapse samples. (B) Analysis of CD19 locus and CD81 mutations in pre- and posttreatment samples. (C) MAF of CD19 mutations by blast percentage in CD19− relapse samples. (D) Cell surface expression of CD19 (x-axis) in NIH-3T3 cells with MSCV-IRES-RFP (MIR) empty vector (EV), wild-type (WT) CD19, Tyr259fs-1 (c.775 T→TGT), and Tyr259fs-2 CD19 mutations (c.776 A→ATTGGAGATCCC) by flow cytometry (top) and immunofluorescence (bottom). Images were taken at 40× magnification using Nikon C2 confocal on TE2000 ET microscope. Scale bars, 25 μm. CD19, green; RFP, red; DAPI, blue. (E) Protein domain plots for 4 CD19− relapse samples subject to targeted sequencing. Enlarged font represents mutations identified by WES (100× coverage); smaller font represents mutations identified by targeted sequencing of CD19 (20 000× coverage). CPM, count per million; DAPI, 4′,6-diamidino-2-phenylindole; hypo, hypodiploid; RFP, red fluorescent protein.
Mechanisms of CD19 loss during blinatumomab treatment. (A) Protein domain plot of CD19 mutations identified in posttreatment CD19− relapse samples. (B) Analysis of CD19 locus and CD81 mutations in pre- and posttreatment samples. (C) MAF of CD19 mutations by blast percentage in CD19− relapse samples. (D) Cell surface expression of CD19 (x-axis) in NIH-3T3 cells with MSCV-IRES-RFP (MIR) empty vector (EV), wild-type (WT) CD19, Tyr259fs-1 (c.775 T→TGT), and Tyr259fs-2 CD19 mutations (c.776 A→ATTGGAGATCCC) by flow cytometry (top) and immunofluorescence (bottom). Images were taken at 40× magnification using Nikon C2 confocal on TE2000 ET microscope. Scale bars, 25 μm. CD19, green; RFP, red; DAPI, blue. (E) Protein domain plots for 4 CD19− relapse samples subject to targeted sequencing. Enlarged font represents mutations identified by WES (100× coverage); smaller font represents mutations identified by targeted sequencing of CD19 (20 000× coverage). CPM, count per million; DAPI, 4′,6-diamidino-2-phenylindole; hypo, hypodiploid; RFP, red fluorescent protein.
To further confirm that CD19 mutations were acquired during blinatumomab treatment, we performed targeted deep sequencing (20 000× coverage) of CD19 exons 2 to 4, which encode the epitope recognized by blinatumomab, on all available pretreatment, posttreatment, and remission samples. This deep sequencing enabled us to detect CD19 mutations with a mutant AF (MAF) as low as 0.1%. No CD19 mutations were identified in pretreatment or remission cases. Of the 4 CD19− relapse cases with available DNA, targeted sequencing confirmed the CD19 mutations detected by WES. Interestingly, 2 of these cases harbored low MAF CD19 mutations not identified by WES, whereas 2 cases harbored no additional CD19 mutations (Figure 5E; supplemental Table 8). SJALL061895_R1 harbored 19 additional CD19 mutations (MAF, 0.1% to 5.9%), 15 of which presented at <1% frequency. SJALL061897_R1 harbored 6 additional CD19 mutations (MAF, 0.2% to 3.4%). These results demonstrate the selective pressure of CD19-directed blinatumomab therapy in driving CD19 mutations.
We also examined the CD19 extracellular domain structure in complex with blinatumomab antibody Fab B43 (Protein Data Bank: 6AL5)24 to evaluate the impact of the mutations found in this study. The crystal structure of CD19 is an elongated β-sandwich composed of a 6-stranded β-sheet and a 10-stranded β-sheet based on the swapped arrangement of 2 immunoglobulin domain folds. Three disulfide bonds, Cys134-Cys173, Cys38-Cys261, and Cys97-Cys200, help maintain the integrity of the tertiary structure. The conformational epitope for Fab B43 is composed of 3 loops spanning residues 97 to 107, 155 to 166, and 216 to 224.24 We mapped the mutational sites onto the complex structure and found all of them to be important for stabilizing protein structure (supplemental Figure 5). For example, the geometric mean of the Pro60 side chain is within 10 Å of side chains of Glu229 (8.7 Å), Lys231 (7.3 Å), and Asp233 (9.4 Å). Therefore, loss of protein stability may contribute to loss of CD19 expression.
In contrast to CAR19 relapse,25 we did not identify copy-neutral loss of heterozygosity at the CD19 locus. Three cases (SJBALL042232_R2, SJALL061897_R1, and SJALL061895_R1) with low-hypodiploid ALL lacked the second allele of CD19 because of loss of chromosome 16, suggesting that the remaining allele may be vulnerable to mutation in patients with this subtype. Two cases (SJALL061893_R1 and SJALL061894_R1) harbored CD19 mutations in 1 allele, with no evidence of alteration of the other allele. Interestingly, RNA-seq data from both cases showed only the mutant allele was expressed. SJBALL042246_R2 harbored no CD19 mutations by bulk or targeted sequencing but had very low CD19 RNA expression (supplemental Figure 6). SJALL061896_R1 had normal levels of CD19 RNA expression but harbored a frame-shift mutation in CD81 (p.Met73fs). CD81 is a chaperone protein that forms a signal transduction complex with CD19 to stabilize its expression.26 Thus, loss-of-function mutations in CD81 likely contribute to loss of CD19 cell surface expression.
Increased use of alternative CD19 splicing junction associated with blinatumomab refractoriness and relapse
Because skipping of CD19 exon 2 (ex2skip) has been reported as a mechanism of resistance to CD19 CAR T-cell therapy, we performed a detailed analysis of CD19 splicing in this cohort. Analysis of RNA-seq data demonstrated that the dominant isoform of CD19 messenger RNA in this cohort was transcript variant 2 (NM_001770). We also observed usage of a noncanonical isoform with partial intraexonic deletion of exon 2 (ex2part)25,27 with abundant supporting reads (AceView ID D19.cAug10; Figure 6A; supplemental Table 9). The splice junction for ex2part was the same in all cases, and we did not observe any evidence for a mutational basis. Analysis of our previously published cohort of ALL transcriptomic data showed that ex2part is a preexisting minor splicing isoform present at varying levels in B-ALL patients at diagnosis15 (supplemental Figure 7A). The presence of 3 CD19 isoforms (wild type, ex2part, and ex2skip) was confirmed in the KOPN75 PAX5-ETV6 B-ALL cell line by reverse transcription polymerase chain reaction, fragment size analysis, and Sanger sequencing (Figure 6B; supplemental Figure 7B).
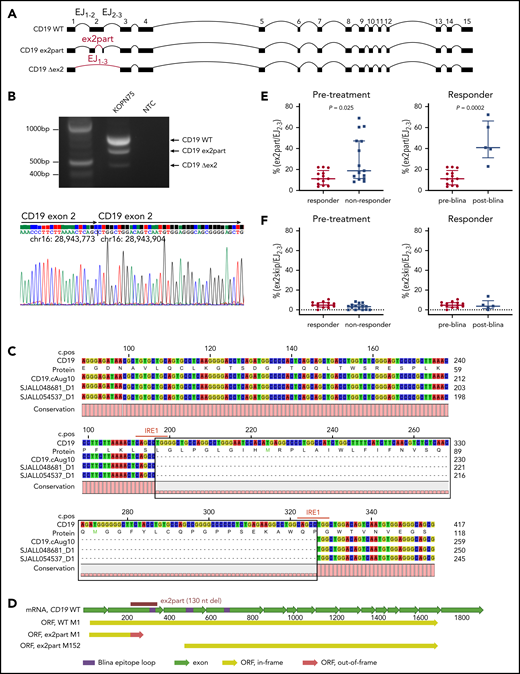
Identification of an alternative CD19 splicing isoform (ex2part) associated with blinatumomab response. (A) Visualization of 3 CD19 isoforms: wild type (WT), ex2part, and ex2skip (Δex2). (B) Reverse transcription polymerase chain reaction of CD19 in KOPN75 cells showing 3 bands corresponding to CD19 WT, ex2part, and ex2skip (top). Sanger sequencing of CD19 ex2part in KOPN75 cells, confirming deletion of 130 nucleotides in exon 2 (bottom). (C) Consensus sequence assembled from Nanopore long-read RNA-seq identified the AceView isoform CD19 cAug10 with ex2part in 2 B-ALL patients. Numbers on top indicate coding sequence position; numbers on the right indicate RNA/protein position. IRE1-mediated splicing sequence CAGCCTGG indicated in red. (D) Full-length structure of CD19 WT and ex2part. Frame-shift partial deletion of exon 2 coding for amino acids Leu66 to Pro109 (ex2part) leads to a new start codon at Met152 of the canonical CD19. Translation of ex2part from the canonical start M1 results in a premature stop codon. (E) Levels of ex2part (E) and ex2skip (F) in pretreatment samples comparing responders (n = 13) and nonresponders (n = 15; left) and preblinatumomab (n = 13) compared with postblinatumomab relapse (n = 5; right). Median and interquartile range are displayed. P value determined using Mann-Whitney test. mRNA, messenger RNA; ORF, open reading frame.
Identification of an alternative CD19 splicing isoform (ex2part) associated with blinatumomab response. (A) Visualization of 3 CD19 isoforms: wild type (WT), ex2part, and ex2skip (Δex2). (B) Reverse transcription polymerase chain reaction of CD19 in KOPN75 cells showing 3 bands corresponding to CD19 WT, ex2part, and ex2skip (top). Sanger sequencing of CD19 ex2part in KOPN75 cells, confirming deletion of 130 nucleotides in exon 2 (bottom). (C) Consensus sequence assembled from Nanopore long-read RNA-seq identified the AceView isoform CD19 cAug10 with ex2part in 2 B-ALL patients. Numbers on top indicate coding sequence position; numbers on the right indicate RNA/protein position. IRE1-mediated splicing sequence CAGCCTGG indicated in red. (D) Full-length structure of CD19 WT and ex2part. Frame-shift partial deletion of exon 2 coding for amino acids Leu66 to Pro109 (ex2part) leads to a new start codon at Met152 of the canonical CD19. Translation of ex2part from the canonical start M1 results in a premature stop codon. (E) Levels of ex2part (E) and ex2skip (F) in pretreatment samples comparing responders (n = 13) and nonresponders (n = 15; left) and preblinatumomab (n = 13) compared with postblinatumomab relapse (n = 5; right). Median and interquartile range are displayed. P value determined using Mann-Whitney test. mRNA, messenger RNA; ORF, open reading frame.
The full-length transcript of CD19 ex2part was confirmed in patient samples by long-read RNA-seq using the Oxford Nanopore platform and by cloning and Sanger sequencing of CD19 from KOPN75 cells (Figure 6B-C). Usage of ex2part junction resulted in an alternate start codon Met152 and loss of residues Met1-Leu151, which is part of the conformational epitope recognized by the blinatumomab CD19 antibody (Figure 6D).24 The relative usage of ex2part was estimated as the percentage of ex2part junction compared with exon junction EJ2-3 and was observed in both CD19+ and CD19− tumors. In pretreatment samples, the levels of ex2part were significantly higher in nonresponders compared with responders (median, 18.8% vs 11.2% [ex2part/EJ2-3]; P = .025). Blinatumomab therapy was likely to fail in cases with levels exceeding 25%. In responders, ex2part was higher in posttreatment relapse samples compared with pretreatment samples, suggesting that this isoform was selected for during blinatumomab therapy (median, 40.9% vs 11.2% [ex2part/EJ2-3]; P = .0002; Figure 6E). In contrast to previous reports of CAR19 therapy,25 we did not observe a role for CD19 ex2skip by read count or transcript usage between responders and nonresponders or between pretreatment and relapse samples (Figure 6F).
Integrative genomic analysis of mechanisms of treatment resistance
Of the 7 cases of CD19− relapse, 1 had material available for DNA-seq of both pre- and posttreatment samples (SJBALL042246). This case harbored a preexisting mutation of TRRAP (p.R2906C) and an acquired mutation of FLT3 (p.N676T) in relapse, which was a mutation previously reported in acute myeloid leukemia (COSV54047682). Of the 4 CD19+ relapse patients, 1 had material available for DNA-seq of both pre- and posttreatment samples (SJBALL042238). This case harbored 3 mutations that were present in both samples at similar MAFs: NRAS p.Gln61His, NR3C1 p.Arg478His, and NT5C2 p.Leu321Pro (supplemental Figure 8A). No additional mutations were identified in the relapse sample for this case. Using single-cell RNA-seq, we observed an acquired TP53 mutation (p.Ser260sp) in the postblinatumomab relapse sample for case SJBALL042245 that was not identified in the preblinatumomab tumor or matched normal sample (supplemental Figure 8B). We also observed moderately high usage of ex2part junction and mutation of the splicing factor SRSF2 (p.Pro193Leu) in both pre- and postblinatumomab tumors. Because this relapse sample was collected at a later time point after subsequent relapse, we could not comment on the timing of TP53 mutation acquisition. Instead, this case is illustrative of how integrated genomic and single-cell approaches can identify multiple mechanisms leading to treatment resistance, including genetic alterations that drive resistance to conventional chemotherapy as well as aberrant CD19 splicing that results in blinatumomab resistance despite CD19 expression.
Discussion
Through comprehensive genomic analysis of both tumor and immune cells, we have demonstrated that both tumor-intrinsic and -extrinsic factors influence response to blinatumomab. Importantly, we report that patients harboring CRLF2 rearrangement have a favorable response to blinatumomab treatment, suggesting this is a treatment option for these high-risk patients. We observed a heightened immune signature in preblinatumomab samples of responders, suggesting responders harbored upregulated immune response genes before treatment, which might condition a favorable tumor microenvironment for receiving blinatumomab therapy. In this study, we assessed whether the enriched JAK-STAT pathway was driven by CRLF2 rearrangement, because CRLF2-rearranged ALL is known to be characterized by JAK-STAT activation. GSEA supported the role of JAK-STAT signaling in responders. The observed correlation between CRLF2 rearrangement, heighted immune signatures, and favorable response suggests a paracrine effect by which activated signaling pathways downstream of CRLF2 in the leukemic cell may directly modulate the nontumor milieu, thus influencing T-cell responsiveness. This is consistent with emerging evidence suggesting that cancer cell–intrinsic mechanisms dictate the immune cell composition within the tumor microenvironment.28
The enrichment of presumptive MAIT cells among nonresponders included in the sc-seq experiment is particularly interesting, given the recently explored role of MAIT cells in lung tumor growth and metastasis.29 Further exploration of this pattern in the context of blinatumomab treatment, with larger sample sizes in experiments specifically assaying TCRs, will be necessary to test the generality of this finding. Likewise, additional characterizations of general TCR repertoire variation will help us further dissect the role that distinct T-cell subsets play in response to blinatumomab treatment. For instance, we identified a cluster of T cells enriched in responders that exhibits stem-like properties; in this case, repertoire comparisons from the same patient before and after treatment may help us to better understand the development of this niche in the blinatumomab treatment environment and furthermore identify specific T-cell characteristics that predict treatment outcome.
We show that CD19 mutations are commonly detected in CD19− relapse during blinatumomab treatment. In addition to truncating mutations similar to those previously reported in CAR19 relapse,10 we observed other mechanisms that contribute to CD19 loss, including mutant allele–specific expression, low level of CD19 RNA expression, and mutation of the CD19 chaperone protein CD81. CD19 mutations were enriched in patients with low-hypodiploid ALL, and 3 such cases lacked the second allele of CD19 because of loss of chromosome 16, suggesting that the remaining allele may be vulnerable to mutation in hypodiploid patients. In addition, all 8 mutations detected by bulk sequencing and a vast majority (24 of 25) of low MAF mutations detected by targeted sequencing were located on exons 2 and 4 of CD19, suggesting a potential hotspot for the CD19-directed selective pressure. Despite the presence of TP53 mutations, particularly in hypodiploid ALL samples, we did not observe evidence of genomic instability or hypermutability, with the exception of 1 case with an MSH6 mutation (SJBALL042249), that was a hypermutator but nonresponder. Therefore, CD19 mutations did not reflect genome-wide hypermutability. In contrast to a previous study of CAR19 relapse,10 we did not observe copy-number neutral loss of heterozygosity of CD19 in this blinatumomab-treated cohort.
There are conflicting reports on the role of CD19 ex2skip as a mechanism for CD19 loss during CAR19 treatment.10,25 We investigated alternative splicing of CD19 messenger RNA in this blinatumomab cohort and did not observe differences in usage of ex2skip isoform in CD19− relapse, nor an association with blinatumomab resistance. We did, however, identify increased usage of an alternate splicing junction minor isoform, ex2part, in both nonresponders and relapsed patients. Although we did not identify conventional splice sites associated with ex2part, we did observe a flanking repeat sequence, CAGCCTGG, associated with IRE1-mediated unconventional splicing that occurred within the cytoplasm and did not require the spliceosome (Figure 6C).30,31 Future studies are required to determine whether IRE1-mediated splicing is responsible for generating the ex2part isoform. Functionally, partial deletion of exon 2 removes a region encoding part of the conformational epitope of the CD19 blinatumomab antibody and therefore might disrupt binding rather than reduce CD19 expression. In support of this hypothesis, both CD19+ and CD19− relapse tumors exhibited relatively high usage of this isoform. Clinically, CD19 expression is measured by flow cytometry using 1 anti-CD19 antibody, clone SJ25C1, the epitope of which is not characterized. It is possible that the loss of binding to anti-CD19 antibody, instead of loss of CD19 expression per se, is occurring in patients with blinatumomab failure. In 1 CD19− postblinatumomab relapse sample (SJALL061893_R1), we observed increased usage of ex2part junction in addition to a CD19 in-frame deletion (P60del, AF 0.73). It will be of interest to investigate the combinational effect of mutations and selection for the alternatively spliced RNA isoform. Future studies are required to assess the usage of ex2part as a biomarker of response to CD19-directed immunotherapies, including blinatumomab and CAR19.
Data sharing: genomic data are publicly available and have been deposited in the European Genome Phenome Archive, accession EGAS00001004027.
The online version of this article contains a data supplement.
The publication costs of this article were defrayed in part by page charge payment. Therefore, and solely to indicate this fact, this article is hereby marked “advertisement” in accordance with 18 USC section 1734.
Acknowledgments
The authors thank the staff of the Hartwell Center for Bioinformatics and Biotechnology, the Flow Cytometry and Cell Sorting Shared Resource, and the Cell and Tissue Imaging Center at St Jude Children’s Research Hospital. The authors also thank Terrence Geiger at St Jude Children’s Research Hospital for providing the MSCV-CD19-IRES-RFP construct, Ilaria Iacobucci for assisting with CD19 in vitro expression, and Taylor Wilson for assisting with single-cell data generation.
This work was supported by American Lebanese Syrian Associated Charities (ALSAC) and the St Baldricks Foundation Robert J. Arceci Award (C.G.M.) and, in part, by National Institutes of Health (NIH)/National Cancer Institute awards P30 CA021765 and R35 CA197695 (C.G.M.), NIH/National Institute of Allergy and Infectious Diseases, grant AI136514 (P.G.T.), and the Key for a Cure Foundation (P.G.T.). C.G.M. is the William E. Evans Endowed Chair at St Jude Children’s Research Hospital.
Authorship
Contribution: Y.Z., C.G.M., and K.G.R. prepared the manuscript; Y.Z., E.K.A., A.E.Z., and K.G.R. performed experiments; Y.Z., C.Q., J.C.C., Z.G., T.B.A., and J.W. analyzed data; H.G., T.I., and K.A. provided key reagents; I.A., G.M., A.S.S., R.B., and S.J.F. provided patient samples; P.G.T., C.G.M., and K.G.R. supervised the design and execution of experiments and analysis; and all authors approved the manuscript.
Conflict-of-interest disclosure: C.G.M. has received consulting and speaking fees from Illumina and Amgen and research support from Loxo Oncology, Pfizer, and Abbvie and holds stock in Amgen. P.G.T. has received consulting and/or speaking fees from 10X, Illumina, PACT Pharma, and Aduro Bioetch. The remaining authors declare no competing financial interests.
Correspondence: Charles G. Mullighan, Department of Pathology, 262 Danny Thomas Pl, MS342, St Jude Children’s Research Hospital, Memphis, TN 38105; e-mail: charles.mullighan@stjude.org; or Kathryn G. Roberts, Department of Pathology, 262 Danny Thomas Pl, MS342, St Jude Children’s Research Hospital, Memphis, TN 38105; e-mail: kathryn.roberts@stjude.org.

This feature is available to Subscribers Only
Sign In or Create an Account Close Modal