

Key Points
Increased T-cell infiltration, activation, and peripheral chemokine expression mark ipilimumab response to relapsed leukemia after HSCT.
Similar to the nontransplant setting, ipilimumab alters peripheral memory T-cell populations and leads to global T-cell activation.

Abstract
Relapsed myeloid disease after allogeneic stem cell transplantation (HSCT) remains largely incurable. We previously demonstrated the potent activity of immune checkpoint blockade in this clinical setting with ipilimumab or nivolumab. To define the molecular and cellular pathways by which CTLA-4 blockade with ipilimumab can reinvigorate an effective graft-versus-leukemia (GVL) response, we integrated transcriptomic analysis of leukemic biopsies with immunophenotypic profiling of matched peripheral blood samples collected from patients treated with ipilimumab following HSCT on the Experimental Therapeutics Clinical Trials Network 9204 trial. Response to ipilimumab was associated with transcriptomic evidence of increased local CD8+ T-cell infiltration and activation. Systemically, ipilimumab decreased naïve and increased memory T-cell populations and increased expression of markers of T-cell activation and costimulation such as PD-1, HLA-DR, and ICOS, irrespective of response. However, responding patients were characterized by higher turnover of T-cell receptor sequences in peripheral blood and showed increased expression of proinflammatory chemokines in plasma that was further amplified by ipilimumab. Altogether, these data highlight the compositional T-cell shifts and inflammatory pathways induced by ipilimumab both locally and systemically that associate with successful GVL outcomes. This trial was registered at www.clinicaltrials.gov as #NCT01822509.
Introduction
Relapsed acute myeloid leukemia (AML) following allogeneic hematopoietic stem cell transplantation (HSCT) is associated with poor prognosis, and therapeutic options remain limited.1 Immune escape mechanisms contribute to relapse post-HSCT2 and suggest a reinvigorated graft-versus-leukemia (GVL) effect could improve outcomes.3 Indeed, the Experimental Therapeutics Clinical Trials Network 9204 trial demonstrated that immune checkpoint blockade (ICB) can induce regression of relapsed AML after HSCT through CD8+ T-cell recruitment to leukemic sites.4,5 Through unbiased molecular profiling of the leukemic microenvironment and peripheral blood immunophenotyping of samples from study subjects on this trial, we sought to elucidate the molecular and cellular features of immunologic responses to ICB. These fresh insights may inform new strategies to control relapsed myeloid malignancies after HSCT and broaden our understanding of leukemia-specific immune responses.6,7
Study design
Additional information is provided in the supplemental Appendix, available on the Blood Web site.
Bulk RNA sequencing
RNA was extracted from formalin-fixed paraffin-embedded (FFPE) tissue scrolls and sequenced as previously described (supplemental Figure 1A-D).4
Flow cytometry and mass cytometry
Flow cytometry data were acquired using antibody panels (supplemental Tables 1 and 2) on a BD Fortessa flow cytometer. Cytometry by time-of-flight (CyTOF) data were acquired using a 35-antibody panel (supplemental Table 3) on a Fluidigm Helios Mass Cytometer.8 Data analysis was performed using CATALYST9 and manual gating (FlowJo 10.7.1).
Bulk T-cell receptor sequencing
RNA was extracted from T cells enriched with CD3 MicroBeads and MACS columns (Miltenyi) using the RNeasy Midi Kit (Qiagen). Complementarity-determining region 3 (CDR3) sequences were obtained using rhTCRseq.10
Plasma analyte analysis
Results and discussion
Transcriptomic evidence of T-cell activation in long-term responders to ipilimumab
We focused on patients enrolled on Experimental Therapeutics Clinical Trials Network 9204 with relapsed myeloid disease, which constituted the majority of subjects (38/71 [54%]; Figure 1A). To define transcriptomic characteristics underlying successful GVL responses with ipilimumab, we performed bulk RNA-sequencing (RNA-seq) on 33 high-quality disease-site biopsies from 13 patients (3 complete responders [CR; response > 12 months], 3 transient responders (TR; response < 12 months], and 7 nonresponders [NR]) before (pre-ipi) and after (post-ipi) ipilimumab treatment (supplemental Tables 4-7). Disease sites included bone marrow, skin, and extramedullary manifestations. In addition, we generated RNA-seq data from 9 biopsies from sites of graft-versus-host disease (GVHD) or ICB-associated toxicity (supplemental Figure 1E).
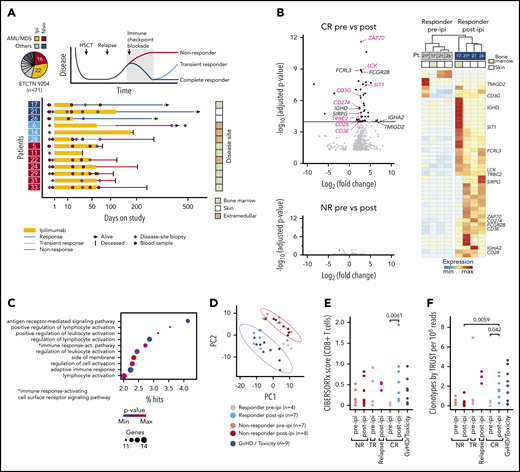
Response to ipilimumab is characterized by transcriptional evidence of T-cell infiltration and activation. (A) RNA sequencing on FFPE disease-site biopsies (♦, n = 33) from 3 patients with CR (17, 21, 26; dark blue), 3 patients with TR (6, 14, 28; light blue) and 7 patients with NR (5, 11, 22, 24, 29, 31, 33; red) pre-ipi or post-ipi ipilimumab treatment. Disease sites: bone marrow (light), extramedullary (dark), or isolated skin (white). Peripheral blood samples (●, n = 28) used for TCR repertoire sequencing. (B) DGEA between 4 site-matched biopsies from CR patients (top) and between unmatched biopsies from NR patients pre- (n = 7) vs post-ipi (n = 8) (bottom). Genes that are part of the Gene Ontology term “leukocyte activation” are labeled and those associated with T-cell activation are highlighted. (C) Gene ontology enrichment analysis of the differentially expressed genes. (D) PCA based on expression of the differentially expressed genes. Biopsies from all CR pre-ipi (n = 4, gray) and post-ipi (n = 7, blue), NR pre-ipi (n = 7, salmon), and post-ipi (n = 8, red) samples, and biopsies from sites of GVHD or immune-related toxicities (n = 9, black). (E,F) Cell type abundance estimation of CD8+ T cells with (E) CIBERSORTx and (F) clonotypes per million reads assembled using TRUST. Relapse biopsies post-ipi were sampled at time of relapse.
Response to ipilimumab is characterized by transcriptional evidence of T-cell infiltration and activation. (A) RNA sequencing on FFPE disease-site biopsies (♦, n = 33) from 3 patients with CR (17, 21, 26; dark blue), 3 patients with TR (6, 14, 28; light blue) and 7 patients with NR (5, 11, 22, 24, 29, 31, 33; red) pre-ipi or post-ipi ipilimumab treatment. Disease sites: bone marrow (light), extramedullary (dark), or isolated skin (white). Peripheral blood samples (●, n = 28) used for TCR repertoire sequencing. (B) DGEA between 4 site-matched biopsies from CR patients (top) and between unmatched biopsies from NR patients pre- (n = 7) vs post-ipi (n = 8) (bottom). Genes that are part of the Gene Ontology term “leukocyte activation” are labeled and those associated with T-cell activation are highlighted. (C) Gene ontology enrichment analysis of the differentially expressed genes. (D) PCA based on expression of the differentially expressed genes. Biopsies from all CR pre-ipi (n = 4, gray) and post-ipi (n = 7, blue), NR pre-ipi (n = 7, salmon), and post-ipi (n = 8, red) samples, and biopsies from sites of GVHD or immune-related toxicities (n = 9, black). (E,F) Cell type abundance estimation of CD8+ T cells with (E) CIBERSORTx and (F) clonotypes per million reads assembled using TRUST. Relapse biopsies post-ipi were sampled at time of relapse.
Differential gene expression analysis (DGEA) between all pre- and post-ipi CR samples demonstrated enrichment of T cell–specific genes post-ipi but revealed no consistent change in NR samples post-ipi (Figure 1B; supplemental Figure 1F). DGEA on 4 site-matched paired pre-post samples from 3 CR patients revealed a signature of 47 up- and 3 downregulated genes (adjusted P value < 10−4; absolute log2 [fold change] >2) enriched for the Gene Ontology terms “lymphocyte activation” and “antigen receptor-mediated signaling” (Figure 1B-C; supplemental Table 8). By principal component analysis (PCA), this signature showed similarity between samples collected from GVHD or toxicity sites with post-ipi CR samples (Figure 1D), suggesting expression of related gene programs. TR and CR biopsies were similar post-ipi on PCA (supplemental Figure 1G). However, DGEA between TR and CR biopsies pre-ipi, although limited by available samples, revealed upregulation of interferon-response genes and checkpoint molecules in TRs that may contribute to ICB resistance (supplemental Figure 1H).13,14 Cell type abundance estimation (CIBERSORTx) detected evidence of increased CD8+ T-cell infiltration in CR biopsies post-ipi compared with pre-ipi (median score 0.56 vs 0.04, P < .01) (Figure 1E). Quantification of de novo assembled T-cell receptor (TCR) clonotypes per million reads (TRUST4) similarly indicated increased T-cell infiltration post-ipi in CR samples (0.33 vs 1.65; P < .05) (Figure 1F). In sum, response to CTLA-4 blockade is characterized by transcriptional evidence of T-cell infiltration and activation within the tumor microenvironment, similar to the signatures linked with GVHD/ICB-associated toxicity.
Systemic effects of ipilimumab
Ipilimumab alters peripheral T-cell differentiation and broadens the TCR repertoire in solid malignancies.15-17 We hypothesized that these effects may also mark clinical responses in the post-HSCT setting and thus evaluated serial peripheral blood samples prospectively collected from 20 study subjects by flow cytometry. We observed an increase in effector memory (CD45RO+ CD62L−) and a decrease in naïve (CD45RO− CD62L+) CD4+ and CD8+ T cells post-ipi (P values < 0.05) independent of response, disease type, or dosing (Figure 2A; supplemental Figure 2A-C).18
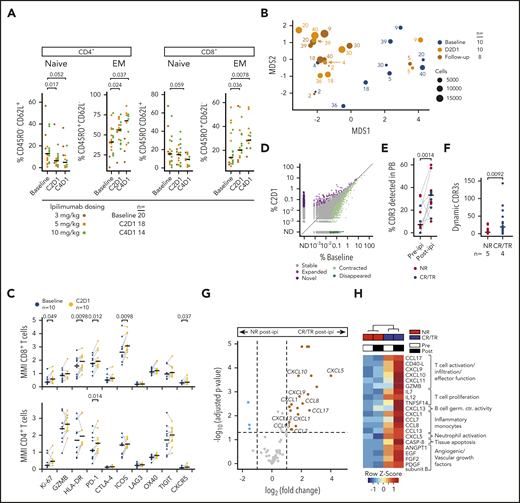
Systemic effects of ipilimumab. (A) Peripheral blood T-cell subsets in patients with myeloid (n = 14) and nonmyeloid (n = 6) disease pre-ipi and after 1 (C2D1) or 3 (C4D1) cycles of ipilimumab (post-ipi) quantified using flow cytometry as percentage of CD4+ or CD8+ T cells. (B) MDS plot calculated from CyTOF data of peripheral blood T cells of 10 NR patients pre-ipi (baseline, n = 10), 1 cycle post-ipi (C2D1, n = 10), or a later timepoint (follow-up, n = 8). Numbers next to dots refer to the patient identifiers used throughout the study (supplemental Tables 4-7). (C) Mean metal intensity (CyTOF) on CD4+ and CD8+ T cells pre-ipi (blue) or 1 cycle post-ipi (yellow) from samples shown in panel B. (D) Frequency of CDR3α and CDR3β sequences in peripheral blood pre-ipi (baseline) and post-ipi (C2D1) (n = 572 017; TCR repertoire sequencing). Dynamic CDR3 sequences with significant changes in abundance (adjusted P value < .01) in purple (expanded, novel = not detectable pre-ipi) or green (contracted, disappeared = not detectable post-ipi). (E) Percentage of CDR3 sequences from disease biopsies detectable in peripheral blood pre-ipi and post-ipi. (F) Absolute number of dynamic CDR3 sequences in patients with response to ipilimumab (CR/TR) (blue, n = 4) and NR (red, n = 5). (G) Differential protein expression post-ipi in patients with response (n = 4) vs patients without response (n = 8) to ipilimumab measured with proximity extension assay (PEA, Olink). (H) Heatmap of protein expression measured with PEA in NR pre-ipi (n = 8), NR post-ipi (n = 16), CR/TR pre-ipi (n = 4), CR/TR post-ipi (n = 8). C2D1/C4D1, second/fourth cycle of ipilimumab; EM, effector memory T cell; MDS, multidimensional scaling; MMI, mean metal intensity; naive, naive T cell; PB, peripheral blood.
Systemic effects of ipilimumab. (A) Peripheral blood T-cell subsets in patients with myeloid (n = 14) and nonmyeloid (n = 6) disease pre-ipi and after 1 (C2D1) or 3 (C4D1) cycles of ipilimumab (post-ipi) quantified using flow cytometry as percentage of CD4+ or CD8+ T cells. (B) MDS plot calculated from CyTOF data of peripheral blood T cells of 10 NR patients pre-ipi (baseline, n = 10), 1 cycle post-ipi (C2D1, n = 10), or a later timepoint (follow-up, n = 8). Numbers next to dots refer to the patient identifiers used throughout the study (supplemental Tables 4-7). (C) Mean metal intensity (CyTOF) on CD4+ and CD8+ T cells pre-ipi (blue) or 1 cycle post-ipi (yellow) from samples shown in panel B. (D) Frequency of CDR3α and CDR3β sequences in peripheral blood pre-ipi (baseline) and post-ipi (C2D1) (n = 572 017; TCR repertoire sequencing). Dynamic CDR3 sequences with significant changes in abundance (adjusted P value < .01) in purple (expanded, novel = not detectable pre-ipi) or green (contracted, disappeared = not detectable post-ipi). (E) Percentage of CDR3 sequences from disease biopsies detectable in peripheral blood pre-ipi and post-ipi. (F) Absolute number of dynamic CDR3 sequences in patients with response to ipilimumab (CR/TR) (blue, n = 4) and NR (red, n = 5). (G) Differential protein expression post-ipi in patients with response (n = 4) vs patients without response (n = 8) to ipilimumab measured with proximity extension assay (PEA, Olink). (H) Heatmap of protein expression measured with PEA in NR pre-ipi (n = 8), NR post-ipi (n = 16), CR/TR pre-ipi (n = 4), CR/TR post-ipi (n = 8). C2D1/C4D1, second/fourth cycle of ipilimumab; EM, effector memory T cell; MDS, multidimensional scaling; MMI, mean metal intensity; naive, naive T cell; PB, peripheral blood.
Additionally, we characterized the longitudinal changes in activation states as defined by co-inhibitory or costimulatory molecule expression in 10 patients using CyTOF.8 Even though these analyses were all performed on NR, we observed that pre-ipi and post-ipi samples clustered separately (Figure 2B). Consistent with T-cell activation, we detected increased expression of PD-1 on both CD4+ and CD8+, and HLA-DR and ICOS on CD8+ T cells post-ipi (all P < .05; Figure 2C). The proliferation marker Ki-67 was higher on CD8+ T cells post-ipi (P < .05), but no changes in absolute lymphocyte counts were detected (supplemental Figure 2D). CD69 was upregulated on regulatory T cells post-ipi (false discovery rate < 0.05), which may reflect a compensatory mechanism to ipilimumab-induced T-cell activation (supplemental Figure 2E-F). Altogether, ipilimumab thus alters differentiation and activation states of circulating T cells independent of clinical response.
Hypothesizing increased TCR diversity post-ipi,17 we performed TCR sequencing on longitudinally collected peripheral blood samples of 9 AML/myelodysplastic syndrome patients (3 CR, 1 TR, 5 NR). However, TCR repertoires remained relatively stable without consistent changes in TCR diversity (supplemental Figure 2G). Of 572 017 total CDR3α/β sequences, only 776 dynamic CDR3s (0.13%) changed in abundance after 1 cycle of ipilimumab (adjusted P value < .01; Figure 2D). Increased T-cell infiltration of disease biopsies post-ipi suggested ipilimumab may mobilize T cells from systemic sites into the leukemic microenvironment. Indeed, we observed an increase in CDR3 sequences shared between tissue sites and blood post-ipi regardless of clinical outcome (Figure 2E; supplemental Figure 2H). We also observed differences in the systemic effects of ipilimumab between CR/TRs and NRs. Dynamic CDR3s were more frequent in CR/TR (613 of 776 vs 163 of 776, P < .01; Figure 2F). Moreover, ipilimumab induced higher plasma expression of pro-inflammatory factors modulating a broad range of cell types in CR/TR (n = 4) compared with NR (n = 8; adjusted P value < .05, log2 fold change > 1) (Figure 2G-H; supplemental Figure 3; supplemental Table 9). Thus, peripheral TCR repertoires largely remain stable, and increased T-cell mobilization into tissue sites occurs independent of outcome. In addition, responders show more dynamic changes in a subset of the peripheral TCR repertoire and greater systemic expression of chemokines associated with leukocyte activation and trafficking.19
In summary, T-cell reinvigoration accompanies clinical response to ipilimumab. Similar observations following response to donor lymphocyte infusion suggest common mechanistic pathways for effective GVL reinstatement.20 Moreover, the convergence both locally and peripherally of gene and chemokine response signatures that invoke GVL and GVHD processes speak to the involvement of CD28-CTLA-4 signaling to each pathway. Future studies that compare tissue sites of GVL and GVHD will be critical to divorce these processes to ensure improved HSCT outcomes. Because of the limitations imposed by small cohort size and tissue heterogeneity, longitudinal high-resolution studies on larger cohorts are urgently needed to deconvolute the heterogeneous cellular populations driving clinical outcomes to ICB.21,22
Data from bulk RNA are deposited in NCBI’s Database of Genotypes and Phenotypes (dbGaP; https://www.ncbi.nlm.nih.gov/gap) under accession number phs002377.
The online version of this article contains a data supplement.
The publication costs of this article were defrayed in part by page charge payment. Therefore, and solely to indicate this fact, this article is hereby marked “advertisement” in accordance with 18 USC section 1734.
There is a Blood Commentary on this article in this issue.
Acknowledgments
The authors thank the Cancer Moonshot CIMAC-CIDC Network for their tremendous support of the work and particularly appreciate the support and feedback from Holden Maecker, Ignacio Wistuba, Ethan Cerami, James Lindsay, Radim Moravec, and many others. The authors are grateful for support from Carol Reynolds and the members of the DFCI Flow Cytometry Core, the Longwood Medical Area CyTOF Core, DFCI Center for Immuno-Oncology, Doreen Hersey and the members of the Ted and Eileen Pasquarello Tissue Bank in Hematologic Malignancies for provision of samples; the patients who generously consented for the research use of these samples; the research coordinators, research nurses, advanced practice providers, and site staff for their support of the trial; Irene Ghobrial and Lee Greenberger and Michael Yaffe for support of the trial through the LLS BCRP; Edwin P. Alyea, David Avigan, and Yi-Bin Chen for clinical data; the Center for Advanced Molecular Diagnostics (CAMD) at the Brigham and Women’s Hospital for isolation of FFPE samples; Sam Pollock and Candace Patterson for excellent project management support; and members of the Wu laboratory for their valuable feedback.
This work was supported by National Institutes of Health, National Cancer Institute grant P01CA229092 (C.J.W.) and grants 5R01CA183559, 5R01CA183560, and 5UM1CA186709 (principal investigator: Geoffrey Shapiro), National Cancer Institute Cancer Therapy Evaluation Program, Bristol-Myers Squibb, and LLS Therapy Accelerator Program. L.P. is supported by a research fellowship from the German Research Foundation (DFG, PE 3127/1-1). S.L. is supported by the National Institutes of Health, National Cancer Institute Research Specialist Award (R50CA251956-01). P.B. is supported by National Institutes of Health, National Cancer Institute grant K08CA248458 and the Amy Strelzer Manasevit Research Program, which is funded through Be The Match Foundation. P.B. is a Scholar of the American Society of Hematology. M.S.D. and P.A. are both Scholars in Clinical Research from the Leukemia & Lymphoma Society. S. Gnjatic is supported by National Institutes of Health, National Institute of Diabetes and Digestive and Kidney Diseases grant U01DK124165 and National Cancer Institute grant P01CA190174. N.C. is supported by an AACR-Incyte Immuno-oncology Research Fellowship (20-40-46-CEIR). The Human Immune Monitoring Center at ISMMS received support from the Cancer Center Support Grant CA196521. Scientific and financial support for the CIMAC-CIDC Network is provided through National Institutes of Health, National Cancer Institute Cooperative Agreements U24CA224319 (to the Icahn School of Medicine at Mount Sinai CIMAC), U24CA224331 (to the Dana-Farber Cancer Institute CIMAC), and U24CA224316 (to the CIDC at Dana-Farber Cancer Institute). Additional support is made possible through the National Institutes of Health, National Cancer Institute CTIMS contract HHSN261201600002C. Scientific and financial support for the PACT project are made possible through funding support provided to the FNIH by: AbbVie Inc., Amgen Inc., Boehringer-Ingelheim Pharma GmbH & Co. KG, Bristol-Myers Squibb, Celgene Corporation, Genentech Inc, Gilead, GlaxoSmithKline plc, Janssen Pharmaceutical Companies of Johnson & Johnson, Novartis Institutes for Biomedical Research, Pfizer Inc., and Sanofi. The CIMAC-CIDC website is found at https://cimac-network.org/.
Authorship
Contribution: L.P. performed experiments, analyzed data, designed figures, and wrote the manuscript; Y.Z., A.J., and J.F. analyzed bulk transcriptomic data; A.S., S.R., H.C., M.T., and H.S. provided organizational framework to the study; T.H. and S.L. performed bulk T-cell receptor sequencing; N.C. performed flow cytometry analyses; W.Z. performed experiments; E.S.H., M.N., and E.M.T. performed CyTOF experiments; S.K.-S. and S. Gnjatic provided proximity extension assay data; M.S., F.S.H., H.T.K., and D.N. contributed to the interpretation of results; X.S.L. provided analytical pipelines for bulk transcriptomic data; K.J.L. analyzed T-cell receptor sequencing data; C.C. and S. Gabriel provided support with bulk transcriptome sequencing; J.R. provided flow cytometry data; C.C., J.H.A., S.N., J.K., V.T.H., P.A., S.J.R., and R.J.S. provided clinical data and study samples; M.S.D., P.B., and C.J.W. designed and supervised the study; and P.B. and C.J.W. interpreted results and wrote the manuscript.
Conflict-of-interest disclosure: C.J.W. holds equity in BioNTech, Inc, and receives research support from Pharmacyclics. D.N. holds stock in Madrigal Pharmaceuticals and received research funding from Pharmacyclics. E.M.T. reports travel fees and honoraria from Fluidigm Corporation and is a current Fluidigm employee. F.S.H. reports grants, personal fees and other from Bristol-Myers Squibb; personal fees from Merck; personal fees from EMD Serono; grants, personal fees, and other from Novartis; personal fees from Surface, Compass Therapeutics, Apricity, Aduro, Sanofi, Pionyr, Torque, Rheos, Bicara, and Psioxus Therapeutics; other from Pieris Pharmacutical; personal fees from Eisai, Checkpoint Therapeutics, Idera, Takeda, Genentech/Roche, Bioentre, Gossamer, and Iovance, outside the submitted work; in addition, F.S.H. has a patent Methods for Treating MICA-Related Disorders (#20100111973) with royalties paid, a patent Tumor antigens and uses thereof (#7250291) issued, a patent Angiopoiten-2 Biomarkers Predictive of Anti-immune checkpoint response (#20170248603) pending, a patent Compositions and Methods for Identification, Assessment, Prevention, and Treatment of Melanoma using PD-L1 Isoforms (#20160340407) pending, a patent Therapeutic peptides (#20160046716) pending, a patent Therapeutic Peptides (#20140004112) pending, a patent Therapeutic Peptides (#20170022275) pending, a patent Therapeutic Peptides (#20170008962) pending, a patent Therapeutic Peptides patent number: 9402905 issued, a patent Methods of using pembrolizumab and trebananib pending, a patent Vaccine compositions and methods for restoring NKG2D pathway function against cancers patent number: 10279021 issued, a patent Antibodies that bind to major histocompatibility complex class I polypeptide-related sequence A patent number: 10106611 issued, and a patent Anti-galectin antibody biomarkers predictive of anti-immune checkpoint and anti-angiogenesis responses publication number: 20170343552 pending. J.K. reports research funding from Amgen, Clinigen, Novartis, Regeneron, BMS, Miltenyi Biotec, and Equillium; consulting activities for Moderna, Cugene, Biolojic Design, Gentibio, Equillium, and Amgen; and serves on the advisory boards of Therakos, Cugene, Merck, and EMD Serono. J.R. receives research funding from Amgen, Equillium, and Kite/Gilead; serves on Data Safety Monitoring Committees for AvroBio; and serves on Scientific Advisory Boards for Garuda Therapeutics, Infinity Pharmaceuticals, LifeVault Bio, Rheos Medicines, Talaris Therapeutics, and TScan Therapeutics. K.J.L. reports equity in Fluidigm. M.S.D. received an institutional research grant from Bristol-Myers Squibb during the conduct of this study; personal fees from AbbVie, Adaptive Biotechnologies, Ascentage Pharma, AstraZeneca, Beigene, Celgene, Genentech, Eli Lilly, Janssen, Merck, Novartis, Pharmacyclics, Research to Practice, TG Therapeutics, and Verastem; and institutional research funding from Ascentage Pharma, Astra-Zeneca, Genentech, MEI Pharma, Novartis, Pharmacyclics, Surface Oncology, TG Therapeutics, and Verastem, outside the submitted work. P.A. reports consultancy for Merck, BMS, Pfizer, Affimed, Adaptive, Infinity, ADC Therapeutics, Celgene, Morphosys, Daiichi Sankyo, Miltenyi, Tessa, GenMab, C4, Enterome, Regeneron, Epizyme, Astra Zeneca, and Genentech; research funding (institutional) from Merck, BMS, Affimed, Adaptive, Roche, Tensha, Otsuka, Sigma τ, Genentech, IGM, and Kite; and honoraria from Merck and BMS. P.B. reports equity in Agenus, Amgen, Breakbio Corp., Johnson & Johnson, Exelixis, and BioNTech. R.J.S. serves on the Board of Directors for Kiadis and Be The Match/National Marrow Donor Program; provided consulting for Gilead, Rheos Therapeutics, VOR Biopharma, and Novartis; and serves on the Data Safety Monitoring Board for Juno/Celgene/BMS. S. Gnjatic reports consultancy and/or advisory roles for Merck, Neon Therapeutics, and OncoMed and research funding from Bristol-Myers Squibb, Genentech, Immune Design, Agenus, Janssen R&D, Pfizer, Takeda, and Regeneron. S.J.R. receives research support from Merck, Bristol Myers Squibb, Affimed, and KITE/Gilead and is on the Scientific Advisory Boards for Immunitas and RareCyte. S.N. has served on advisory boards for Kite/Gilead, Novartis, Iovance, and Nkarta. V.T.H. has received travel funding for Alexion, and served as consultant for Alexion, Jannsen, Jazz, Omeros, and CareDx. X.S.L. is a cofounder, board member, on the scientific advisory board, and is a consultant of GV20 Oncotherapy and its subsidiaries; on the scientific advisory board of 3DMedCare; is a consultant for Genentech; stockholder of AMGN, JNJ, MRK, PFE; and receives sponsored research funding from Takeda and Sanofi. The remaining authors declare no competing financial interests.
The current affiliation for P.B. is Department of Hematopoietic Biology and Malignancy, University of Texas MD Anderson Cancer Center, Houston, TX.
Correspondence: Pavan Bachireddy, The University of Texas, MD Anderson Cancer Center, 1515 Holcombe Blvd, Houston, TX 77030; e-mail: pbachireddy@mdanderson.org.

This feature is available to Subscribers Only
Sign In or Create an Account Close Modal