

Key Points
Patients with SCD have elevated cf-mtDNA that can be traced to abnormal retention of mitochondria in red blood cells.
cf-mtDNA is disproportionately hypomethylated and triggers formation of NETs, thereby acting as an erythrocytic DAMP.

Abstract
The pathophysiology of sickle cell disease (SCD) is driven by chronic inflammation fueled by damage associated molecular patterns (DAMPs). We show that elevated cell-free DNA (cfDNA) in patients with SCD is not just a prognostic biomarker, it also contributes to the pathological inflammation. Within the elevated cfDNA, patients with SCD had a significantly higher ratio of cell-free mitochondrial DNA (cf-mtDNA)/cell-free nuclear DNA compared with healthy controls. Additionally, mitochondrial DNA in patient samples showed significantly disproportionately increased hypomethylation compared with healthy controls, and it was increased further in crises compared with steady-state. Using flow cytometry, structured illumination microscopy, and electron microscopy, we showed that circulating SCD red blood cells abnormally retained their mitochondria and, thus, are likely to be the source of the elevated cf-mtDNA in patients with SCD. Patient plasma containing high levels of cf-mtDNA triggered the formation of neutrophil extracellular traps (NETs) that was substantially reduced by inhibition of TANK-binding kinase 1, implicating activation of the cGAS-STING pathway. cf-mtDNA is an erythrocytic DAMP, highlighting an underappreciated role for mitochondria in sickle pathology. These trials were registered at www.clinicaltrials.gov as #NCT00081523, #NCT03049475, and #NCT00047996.
Introduction
Sickle cell disease (SCD) is an inherited hemoglobin (Hb) disorder with diverse clinical manifestations and multisystemic organ damage,1,2 all contributing to the significant morbidity and premature mortality.3-6 Although the sickle pathology is initiated by polymerization of HbS (βGlu6Val), the multiple end-organ damage is inflicted by years of on-going inflammation and vasculopathy,7,8 as evidenced by the elevation of inflammatory markers that include activated neutrophils that are prone to forming neutrophil extracellular traps (NETs), cytokines (interleukin-6 [IL-6], tumor necrosis factor–α, and IL-1β), and heme and numerous other red blood cell (RBC)-associated molecules with inflammatory potential, referred to as damage associated molecular patterns (DAMPs).7,9-11 It is difficult to identify the exact sequence of events that leads to the chronic inflammatory state in SCD, but suggested sources include RBC alterations, hemolysis and Hb products, the vaso-occlusion process itself, and ischemia-reperfusion injury.7,12 During vaso-occlusive episodes (VOEs), apoptotic and necrotic cells, including those of erythroid origin, release proinflammatory molecules that include heme, microparticles, histones, nucleosomes, mitochondrial DNA (mtDNA), and extracellular DNA; these DAMPs can potentially generate high levels of intravascular reactive oxygen species (ROS), contributing to the oxidative microenvironment.13-15 Plasma from patients with SCD, particularly during VOEs, activates neutrophils, including formation of NETs with cell-free heme implicated as the trigger.9,11,16-18 NETs constitute a meshwork of extracellular DNA, nucleosomes, histones, and neutrophil proteases with various immunostimulatory effects, and they have a central role in propagating recurring inflammation in conditions such as systemic lupus erythematosus, multiple organ failure, cancer, and SCD.19
Given its accessibility and ease of measurement, cell-free DNA (cfDNA) has emerged as a critical noninvasive diagnostic and prognostic biomarker in diverse diseases.20 cfDNA in healthy humans originates from white blood cells (55%), erythrocyte progenitors (30%), vascular endothelial cells (10%), and hepatocytes (1%).21 Increased levels of cfDNA and nucleosomes have previously been noted in plasmas of patients with SCD, with levels further increasing during VOEs.16,22,23 Hydroxyurea (HU) therapy, which is associated with reducing the frequency of acute pain, as well as inflammatory markers, in patients with SCD,24,25 was also associated with a concomitant reduction in cfDNA levels.26 We hypothesize that cfDNA is not just a prognostic biomarker in SCD and set out to investigate how elevated cfDNA levels could contribute to the sickle pathology. Using a combination of whole-genome sequencing (WGS) and targeted quantitative polymerase chain reaction (qPCR), we show a disproportionate increase in cell-free mitochondrial DNA (cf-mtDNA) over cell-free nuclear DNA (cf-nDNA) in plasma from patients with SCD compared with healthy volunteers. Furthermore, WGS of bisulfite-converted cfDNA on paired steady-state and crises samples from the same patient showed significantly higher hypomethylation of cf-mtDNA in VOEs compared with the steady-state. We used a combination of flow cytometry, structured illumination microscopy (SIM), and electron microscopy to show that circulating RBCs from patients with SCD abnormally retain their mitochondria and, thus, are likely to be the source of the disproportionately elevated cf-mtDNA fraction in patients with SCD. Coincubation of SCD plasma with healthy neutrophils triggered NET formation, which was significantly reduced by a TANK-binding kinase 1 (TBK1) inhibitor, suggesting that NETs form via the cGAS-STING-TBK1 pathway.
Our findings provide a mechanistic role for cf-mtDNA as erythrocytic DAMPs (e-DAMPs) in SCD; the increased hypomethylation of mtDNA during acute vaso-occlusive pain episodes further exacerbates this inflammatory state.
Methods
Details on the study cohort, protocols (including antibodies), and analytical methodology are provided in supplemental Materials and methods, available on the Blood Web site.
Human subjects and cfDNA extraction
Blood samples were collected from patients with SCD in the steady-state (SCD-baseline), patients with SCD in VOEs (SCD-Crisis), healthy controls (HCs), and individuals with sickle cell trait (AS), in accordance with the Declaration of Helsinki27 and protocols approved by the National Heart, Lung, and Blood Institute Institutional Review Board. HCs and AS were enrolled under Protocols 03H015 (#NCT00047996) and 04H0161 (#NCT00081523). All patients with SCD had HbSS genotype. Patients were excluded if they were younger than 18 years of age or older than 80 years of age, were pregnant, or had a history of blood transfusion in the previous 8 weeks. Peripheral whole blood was collected in EDTA tubes, and samples were processed for cfDNA extraction within 30 minutes of blood draw.
DNA analyses
WGS
cfDNA libraries were prepared using an Ovation Ultralow Library System V2 (NuGEN) and a ThruPLEX Plasma-seq Kit (Rubicon Genomics) and sequenced on an Illumina HiSeq 3000 System. Sequenced reads were trimmed and filtered to remove polymerase chain reaction duplicates and low-quality reads. The remaining reads were aligned to the human genome build hg19 (www.ucsc.edu). For whole-genome bisulfite sequencing, cfDNA was treated with bisulfite using an EZ DNA Methylation-Gold Kit (Zymo Research). Libraries were prepared from the bisulfite-treated cfDNA with an Accel-NGS Methyl-Seq DNA Library Kit (Swift Biosciences), following the manufacturer’s protocol. Whole-genome bisulfite sequencing was performed on an Illumina HiSeq 3000 System.
Quantitation of nuclear (cf-nDNA) and mitochondrial (cf-mtDNA) DNA in plasma and in RBCs
Reference genes were telomerase reverse transcriptase (TERT) and glyceraldehyde-3-phosphate dehydrogenase (GAPDH) for human nuclear genomic targets and mitochondrially encoded NADH dehydrogenase 1 (MT-ND1) and mitochondrially encoded NADH dehydrogenase 6 (MT-ND6) for human mitochondrial genomic targets. Real-time qPCR assays were designed for these gene targets using Primer3 software28 (supplemental Table 1). We used humanized SCD mice to recapitulate the cf-mtDNA findings observed in humans; the detailed methodology can be found in supplemental Materials and methods.
Flow cytometry and cell sorting
Whole blood cells were used for flow cytometry–related assays. For quantification assays, cells were stained with erythroid-specific markers (CD71, 563671; CD235a, 563666; BD Pharmingen) and pan-leukocyte markers (CD45, 563716; BD Pharmingen) and used for fluorescence-activated cell sorting (FACS) analysis. For mitochondrial assays, cells were stained with mitochondrial markers (0.5 μM MitoTracker Green [MTG; M7514], 0.5 μM MitoTracker Deep Red [MTDR; M22426], and 2.5 μM MitoSOX [M36008]; all from Thermo Fisher Scientific), followed by staining with erythroid-specific markers (CD71 and CD235a) and FACS analysis. Flow cytometry data were analyzed using FlowJo software version 8.7.3 (TreeStar, Ashland, OR). For flow-sorted microscopy assays, cells were sorted with erythroid-specific and pan-leukocyte markers (CD71, CD235a, CD45), followed by staining with mitochondrial markers (MTG and MTDR).
Fluorescence imaging of mitochondria
Fluorescence imaging was performed on whole blood, as well as on FACS-sorted RBCs. For whole blood, 1 × 10⁶ cells were costained with 0.5 μM MTG and 1 μM tetramethylrhodamine (TMRM; Invitrogen) as previously described.29 Cell nuclei were stained with Hoechst 33342 (ThermoFisher) following the mitochondrial staining and before plating. The stained cells were plated onto 35-mm no. 1.5 poly-d-lysine–coated glass-bottom Petri dishes for imaging. Superresolution SIM images were collected using an iSIM scanner (VT-iSIM; VisiTech International, Sunderland, United Kingdom), an Olympus IX81 microscope, an Olympus 100× (1.45 NA) objective, and dual Hamamatsu Flash 4 cameras. Florescence imaging was repeated on FACS-sorted mature RBCs (CD71− CD235ahi) that were stained with mitochondrial (MTDR, 0.5 µM) and nuclear (Hoechst, 1:2000 dilution) markers and fixed with 4% paraformaldehyde before plating on the microslides for confocal imaging.
Ultrastructural analysis of RBCs using electron microscopy
A blood sample from a patient in the steady-state was immersed in a fixative solution (4% formaldehyde, 0.2% glutaraldehyde in 1× PHEM Buffer, pH 6.9) for 90 minutes.30 After initial fixation, the blood sample was cut into 1-mm3 cubes and placed into standard fixative solution (2.5% glutaraldehyde, 1% formaldehyde, 0.12 M sodium cacodylate, pH 7.2-7.4) for 1 hour. Further sample processing and focused ion beam-scanning electron microscopy (FIB-SEM) imaging were performed as described.31 In brief, blood sample was postfixed and stained en bloc using established protocols with minor modifications.32,33
NET assays
For consistency and to reduce variability, neutrophils from 1 healthy ethnic-matched donor were used throughout all of the NET assays. Purified neutrophils were resuspended in RPMI 1640 supplemented with 2 mM l-glutamine, plated in poly-l-lysine–coated 8-well glass chambers (ThermoFisher), and allowed to rest at 37°C for 30 minutes. Rested neutrophils were treated with various stimuli: Hemin 5 and 20 μM, genomic DNA (gDNA; 500 ng/mL), mtDNA purified from platelets (500 ng/mL), or high cf-mtDNA–containing plasma from patients with SCD or HCs (plasma was diluted to 10% in the supplemented RPMI 1640). For the inhibition experiments, neutrophils were treated with 10 μM Toll-like receptor 9 (TLR9) antagonist ODN TTAGGG (A151) or 10 μM chloroquine, 10 μM BX-795, or 160 nM CLI 095, followed by stimulation for 5 hours. The stimulation step was terminated by adding freshly made 4% paraformaldehyde for 20 minutes at room temperature. NETs, defined as overlaid 4′,6-diamidino-2-phenylindole and elastase–positive strands, were counted in all acquired fields and shown as the average number of NETs ± standard deviation (SD).
Statistical analyses
GraphPad Prism 7.0 software was used to evaluate statistical significance using an unpaired, 2-tailed Student t test, a nonparametric Kruskal-Wallis test with Dunn’s multiple comparison, or 1-way analysis of variance with Tukey’s multiple-comparisons test. Differences were considered significant at P < .05. Results are shown as mean ± SD and error bars in figures.
Results
Patient clinical characteristics and hematological parameters
The general clinical characteristics and hematological parameters of subjects in this study are presented in supplemental Figure 1. In general, patients with SCD demonstrated the expected trends in clinical laboratory parameters compared with healthy individuals. Of note, there is no significant difference between the steady-state and crises state, exemplifying that normal hematological parameters may not be robust indicators of sickle VOEs owing to the complex pathophysiology and the underlying inflammatory condition of SCD. To examine any potential effects of HU therapy on the hematological parameters, as well as on cfDNA, we stratified our cohort into on-HU (n = 45) and off-HU (n = 29) categories (supplemental Figure 2). In general, patients with SCD on HU therapy showed relatively lower levels of reticulocytes, RBCs, red cell distribution width, leukocytes, bilirubin, and lactate dehydrogenase, and relative increase in red cell indices mean corpuscular hemoglobin and mean corpuscular volume compared with patients off HU. cf-nDNA in patients with SCD on HU was about half that in patients with SCD off HU (supplemental Figure 3A), but there was no difference in the levels of cf-mtDNA between the 2 groups (supplemental Figure 3B).
cf-nDNA and cf-mtDNA are increased in patients with SCD
WGS was performed on cfDNA isolated from 34 patients with SCD (SCD-Baseline, n = 18; SCD-crises, n = 16), and 8 HCs; all 3 groups showed similar size distribution (supplemental Figure 4). The majority of the cfDNA fragments were ∼167 bp in size, as would be expected from the nucleosome-bound cfDNA that is apoptotic in origin.34 Mapping of these sequenced cfDNA fragments from the same set of samples across the mitochondrial genome showed significantly higher proportions of cf-mtDNA compared with cf-nDNA in patients with SCD compared with HCs: 14-fold higher in the steady-state and 11-fold higher in crisis (supplemental Figure 5).
To increase the sample size, we used targeted qPCR and 2 nuclear reference gene markers: TERT and GAPDH. SCD-Baseline (n = 72) and SCD-Crisis (n = 20) had a consistent increase in plasma cf-nDNA compared with HCs (n = 13) (Figure 1A). Using GAPDH as reference, the levels were 6.85 ng/mL in HCs, 9.65 ng/mL in SCD-Baseline (1.4-fold that of HCs), and 22.01 ng/mL in SCD-Crisis (more than threefold that of HCs). Using TERT as reference, the levels were 11.05 ng/mL in HCs, 16.20 ng/mL in SCD-Baseline (1.4 fold that of HCs), and 38.38 ng/mL in SCD-Crisis (more than threefold that of HCs). In the cohort of paired samples (n = 18), cf-nDNA was significantly higher in crisis compared with steady-state in the same patient. Using GAPDH as reference, the levels were 6.14 ng/mL in SCD-Baseline and 23.90 ng/mL in SCD-Crisis (more than threefold increase); using TERT as reference, the levels were 13.56 ng/mL in SCD-Baseline and 41.65 ng/mL in SCD-Crisis (more than threefold increase).
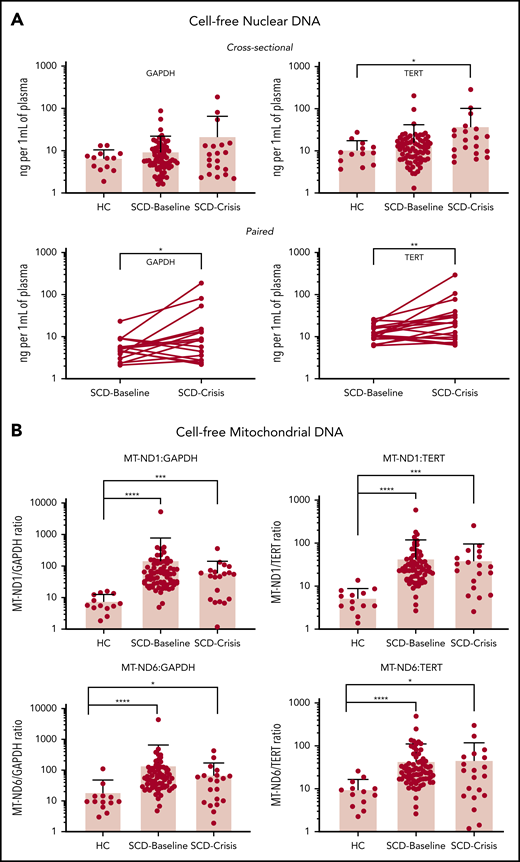
cfDNA is increased in patients with SCD. (A) Quantification of cf-nDNA in the cross-sectional cohort (upper panel) and paired samples (lower panel) by real-time qPCR assays of human genomic targets GAPDH and TERT. Upper panels: HCs, n = 13; SCD-Baseline, n = 72, and SCD-Crisis, n = 20. Data are sample mean ± SD. *P < .05, nonparametric Kruskal-Wallis test with Dunn’s multiple-comparison test. Lower panels: SCD-Baseline and SCD-Crisis pairs, n = 18. Circles represent the mean of each sample. *P < .05, **P < .01, nonparametric Wilcoxon matched-pairs signed-rank test. (B) qPCR assays were performed for human mitochondrial targets (MT-ND1 and MT-ND6), as well as for nuclear targets (GAPDH and TERT), and the cf-mtDNA/cf-nDNA ratio was calculated by normalizing the cycle threshold (ct) values with the mean ct value of GAPDH from HCs. Quantitation of cf-mtDNA/cf-nDNA ratio using the following mitochondrial and nuclear targets: MT-ND1/GAPDH, MT-ND1/TERT, MT-ND6/GAPDH, and MT-ND6/TERT. Error bars represent the sample mean ± SD. *P < .05, ***P < .0005, ****P < .0001, nonparametric Kruskal-Wallis test with Dunn’s multiple comparison test.
cfDNA is increased in patients with SCD. (A) Quantification of cf-nDNA in the cross-sectional cohort (upper panel) and paired samples (lower panel) by real-time qPCR assays of human genomic targets GAPDH and TERT. Upper panels: HCs, n = 13; SCD-Baseline, n = 72, and SCD-Crisis, n = 20. Data are sample mean ± SD. *P < .05, nonparametric Kruskal-Wallis test with Dunn’s multiple-comparison test. Lower panels: SCD-Baseline and SCD-Crisis pairs, n = 18. Circles represent the mean of each sample. *P < .05, **P < .01, nonparametric Wilcoxon matched-pairs signed-rank test. (B) qPCR assays were performed for human mitochondrial targets (MT-ND1 and MT-ND6), as well as for nuclear targets (GAPDH and TERT), and the cf-mtDNA/cf-nDNA ratio was calculated by normalizing the cycle threshold (ct) values with the mean ct value of GAPDH from HCs. Quantitation of cf-mtDNA/cf-nDNA ratio using the following mitochondrial and nuclear targets: MT-ND1/GAPDH, MT-ND1/TERT, MT-ND6/GAPDH, and MT-ND6/TERT. Error bars represent the sample mean ± SD. *P < .05, ***P < .0005, ****P < .0001, nonparametric Kruskal-Wallis test with Dunn’s multiple comparison test.
To confirm and validate the differential increase in cf-mtDNA over cf-nDNA in a larger sample, we performed targeted qPCR analyses using 2 mitochondrial reference genes (MT-ND1 and MT-ND6) and the 2 nuclear reference genes (GAPDH and TERT) in the entire cohort of samples from patients with SCD (see supplemental Table 1 for primer sequences). The results are reported as fold change of mitochondrial gene fragments (MT-ND1 and MT-ND6) over nuclear gene fragments (GAPDH and TERT) (Figure 1B). The mean cf-mtDNA/cf-nDNA ratios for MT-ND1/GAPDH were 7.8 for HCs, 153.3 for SCD-Baseline, and 63.4 for SCD-Crisis; the mean ratios for MT-ND1/TERT ratios were 5.4, 44.1, and 40.0, respectively; the mean ratios for MT-ND6/GAPDH were 19.1, 142.3, and 70.5, respectively (Figure 1B); and the mean ratios for MT-ND6/TERT were 9.7, 44.4, and 46.4, respectively. The targeted polymerase chain reaction analyses confirmed the results of WGS (ie, cf-mtDNA was significantly differentially increased over cf-nDNA in patients with SCD compared with HCs). The increase in cf-mtDNA/cf-nDNA ratios in SCD patients compared with HCs were significant for all 4 sets of reference genes (MT-ND1/GAPDH: SCD-Baseline >19-fold, SCD-Crisis more than eightfold; MT-ND1/TERT: SCD-Baseline more than eightfold, SCD-Crisis more than sevenfold; MT-ND6/GAPDH: SCD-Baseline more than sevenfold, SCD-Crisis more than threefold; and MT-ND6/TERT: SCD-Baseline more than fourfold and SCD-Crisis more than fourfold).
Although there was no significant difference in the proportion of cf-mtDNA over cf-nDNA in steady-state compared with crises within the same patient with SCD (supplemental Figure 6), the cf-mtDNA/cf-nDNA ratios remained significantly elevated for SCD-Baseline and SCD-Crisis compared with HCs: both approximately ninefold for MT-ND1/GAPDH, both more than eightfold for MT-ND1/TERT and MT-ND6/GAPDH, and more than eightfold and more than sevenfold, respectively, for MT-ND6/TERT (supplemental Figure 7). The data are summarized in Table 1. The qPCR data with fold changes and cfDNA amount for the cross-sectional and paired-sample studies are summarized in supplemental Table 2.
Summary of qPCR results in cross-sectional and longitudinal cohorts for cf-nDNA and cf-mtDNA
| Cohort | Gene marker | cf-nDNA (ng/mL) | Gene marker | cf-mtDNA (fold change) | ||||
|---|---|---|---|---|---|---|---|---|
| HC | SCD-Baseline | SCD-Crisis | HC | SCD-Baseline | SCD-Crisis | |||
| Cross-sectional* | GAPDH | 6.85 | 9.65 | 22.01 | MT-ND1/GAPDH | 7.8 | 153.3 | 63.4 |
| MT-ND1/TERT | 5.4 | 44.1 | 40 | |||||
| TERT | 11.05 | 16.2 | 38.38 | MT-ND6/GAPDH | 19.1 | 142.3 | 70.5 | |
| MT-ND6/TERT | 9.7 | 44.4 | 46.4 | |||||
| Paired (n = 18) | GAPDH | 6.14 | 23.9 | MT-ND1/GAPDH | 65.7 | 63 | ||
| MT-ND1/TERT | 44.5 | 41.6 | ||||||
| TERT | 13.56 | 41.65 | MT-ND6/GAPDH | 81.5 | 76.8 | |||
| MT-ND6/TERT | 54.8 | 50.9 | ||||||
HC, n = 13; SCD-Baseline, n = 72; SCD-Crisis, n = 20.
cf-mtDNA fragments are smaller than mtDNA fragments within the cellular compartment
We compared the size distribution of cf-mtDNA and cf-nDNA in plasma with that of mtDNA and nuclear DNA in the cellular compartment, referred to as cell mtDNA (cmtDNA) and cell nuclear DNA (cnDNA), respectively, which are bound to mitochondrial nucleoids and nucleosomes, respectively. After excluding the shared sequences of 100% homology between mitochondrial and nuclear genomes, cf-mtDNA showed a distinct peak size (median) ∼131 bp, whereas cmtDNA showed a peak size ∼442 bp (supplemental Figure 8A). As expected, cf-nDNA fragments showed a median peak size ∼168 bp, whereas cnDNA showed a peak size ∼437 bp (supplemental Figure 8B). These observations confirm the smaller fragment size of cf-mtDNA (∼131 bp) compared with the usual ∼168-bp fragment size of cf-nDNA documented here and in other studies. In contrast, cmtDNA (median size, ∼442 bp) and cnDNA (median size, ∼437 bp) from intact cells showed similar fragment size distribution that was consistent with size selectivity of the library-preparation methods. We mapped the genomic regions of cf-mtDNA and found that the sequences corresponding to a region within the D-loop in the mitochondrial genome were overrepresented in SCD patients compared with HCs (supplemental Figure 9).
cf-mtDNA in patients with SCD is differentially hypomethylated during acute pain episodes
We compared the epigenetic profiles of the cfDNA in SCD samples through genome-wide methylation of paired SCD-Baseline and SCD-Crisis samples in 7 patients. A total of 524 175 differentially methylated regions (DMRs) was identified across the genome, of which 275 170 were hypermethylated and 249 005 were hypomethylated in SCD-Baseline and SCD-Crisis samples, respectively (supplemental Table 3), suggesting overall loss of methylation during crisis episodes. Among all of the DMRs annotated for mitochondria, robust hypomethylation of cf-mtDNA was observed in patients with SCD during crises compared with their respective steady-states (Figure 2; supplemental Table 4).

Global mitochondrial hypomethylation in cfDNA samples. Bisulfite sequencing (BS-Seq) graphical output of mitochondrial DMRs in the cfDNA of patients with SCD. cfDNA from 7 longitudinal pairs (7 SCD-Baseline and 7 SCD-Crisis) of patients with SCD and an HC was extracted and treated with bisulfite, and the whole genome was sequenced for the BS-Seq analysis to analyze the levels of cytosine guanine dinucleotide (CpG) across the samples. DMRs with ≥3 CpGs and a mean methylation difference between groups of samples ≥10% are considered significant. Blue and red lines indicate mean percentage of methylation of SCD-Baseline and SCD-Crisis, respectively, across 7 pairs. The green line represents the percentage of mitochondrial methylation in the HC.
Global mitochondrial hypomethylation in cfDNA samples. Bisulfite sequencing (BS-Seq) graphical output of mitochondrial DMRs in the cfDNA of patients with SCD. cfDNA from 7 longitudinal pairs (7 SCD-Baseline and 7 SCD-Crisis) of patients with SCD and an HC was extracted and treated with bisulfite, and the whole genome was sequenced for the BS-Seq analysis to analyze the levels of cytosine guanine dinucleotide (CpG) across the samples. DMRs with ≥3 CpGs and a mean methylation difference between groups of samples ≥10% are considered significant. Blue and red lines indicate mean percentage of methylation of SCD-Baseline and SCD-Crisis, respectively, across 7 pairs. The green line represents the percentage of mitochondrial methylation in the HC.
Abnormal retention of mitochondria in RBCs of patients with SCD
Using targeted qPCR analyses of the RBC fraction
Given the disproportionate increase in cf-mtDNA over cf-nDNA in patients with SCD, we posited that the likely source would be erythrocytic from the high turnover of the anuclear RBCs. Patients with SCD have significantly higher absolute reticulocyte counts compared with HCs (supplemental Figure 10A). Using targeted qPCR of mitochondria and nuclear encoded genes in DNA isolated from the total red cell fraction, we showed that the absolute amount of mtDNA was increased in steady-state and crises samples compared with HCs (supplemental Figure 10B-C) as was the ratio of mtDNA/nuclear DNA (supplemental Figure 10D-E).
To further confirm these findings, we repeated the assays on DNA extracted from FACS-sorted leukodepleted (CD45−) RBC fractions: immature reticulocytes (CD45− CD71+ CD235alo), reticulocytes (CD45− CD71+ CD235ahi), and mature RBCs (CD45− CD71− CD235ahi). We also studied AS to explore whether mitochondria were similarly retained in mature RBCs from AS as in SCD RBCs. Patients with SCD exhibited higher percentages of immature reticulocyte, reticulocyte, and leukocyte populations (supplemental Figure 11A-C) and a lower percentage of mature RBCs (supplemental Figure 11D) compared with AS and HCs. Using targeted qPCR on DNA isolated from these individual red cell fractions, we show that mtDNA in the mature RBC fraction (CD45− CD71− CD235ahi) of patients with SCD (SCD-Baseline) is ∼70-fold higher compared with that in HCs and is ∼10-fold higher than in AS (Figure 3).
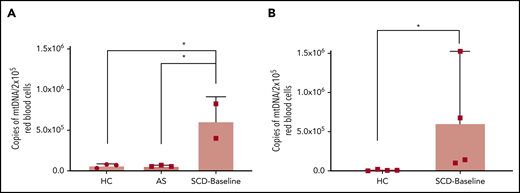
Quantitation of mtDNA in RBCs of HCs, AS, and patients with SCD. (A) Graph shows a significantly higher copy number of mtDNA in freshly acquired RBCs from patients who were SCD-Baseline (n = 2) compared with HCs and AS (n = 3 each). (B) Confirmation of the findings from panel A with a separate set of HCs (n = 4) and SCD-Baseline subjects (n = 4). Whole blood from HCs, AS, and SCD-Baseline subjects were stained with pan-leukocyte (CD45) and erythroid (CD71, CD235a) markers, followed by FACS. Errors bars represent the sample mean ± SD. *P < .05, 1-way analysis of variance with Tukey’s multiple-comparisons test (A), nonparametric Student t test (B).
Quantitation of mtDNA in RBCs of HCs, AS, and patients with SCD. (A) Graph shows a significantly higher copy number of mtDNA in freshly acquired RBCs from patients who were SCD-Baseline (n = 2) compared with HCs and AS (n = 3 each). (B) Confirmation of the findings from panel A with a separate set of HCs (n = 4) and SCD-Baseline subjects (n = 4). Whole blood from HCs, AS, and SCD-Baseline subjects were stained with pan-leukocyte (CD45) and erythroid (CD71, CD235a) markers, followed by FACS. Errors bars represent the sample mean ± SD. *P < .05, 1-way analysis of variance with Tukey’s multiple-comparisons test (A), nonparametric Student t test (B).
Using flow cytometry and mitochondrial-specific dyes
Mature RBCs and immature reticulocytes were identified using erythroid-specific surface markers (CD71: transferrin receptor; CD235a: glycophorin A), and their total mitochondrial mass and membrane potential were evaluated using MTG and MTDR, respectively. We used MitoSOX to estimate the mitochondrial ROS (mROS), an indicator of cellular oxidative stress. Although there was no significant difference in the proportion of mature RBCs between patients with SCD and HCs (Figure 4A), the proportion of immature RBCs was significantly higher in patients with SCD (Figure 4B). Compared with HCs, the mature RBC fraction from SCD patients showed significantly higher mitochondrial mass, mROS, and membrane potential (Figure 4C,E,G); in contrast, we did not observe any significant differences between the reticulocytes from patients with SCD and HCs (Figure 4D,F,H).

Differential mitochondrial mass, membrane potential, and superoxide production in RBCs from HCs and patients who were SCD-Baseline (n = 4 each). (A) HCs display a slight increase in the percentage of mature RBCs compared with patients with SCD, but the difference is not significant. (B) Immature RBCs (reticulocytes) were significantly higher in SCD patients. Mature RBCs from SCD patients showed a significant increase in mitochondrial mass (quantified as the fluorescent intensity of MTG) (C), the amount of mitochondrial superoxide (estimated with MitoSOX Red) (E), and mitochondrial membrane potential (quantified with MTDR) (G) compared with mature RBCs from HCs but there was no significant difference in mitochondrial mass (D), superoxide levels (F), or mitochondrial membrane potential (H) between SCD and HC reticulocytes. Errors bars represent the sample mean ± SD. *P < .05, Student t test.
Differential mitochondrial mass, membrane potential, and superoxide production in RBCs from HCs and patients who were SCD-Baseline (n = 4 each). (A) HCs display a slight increase in the percentage of mature RBCs compared with patients with SCD, but the difference is not significant. (B) Immature RBCs (reticulocytes) were significantly higher in SCD patients. Mature RBCs from SCD patients showed a significant increase in mitochondrial mass (quantified as the fluorescent intensity of MTG) (C), the amount of mitochondrial superoxide (estimated with MitoSOX Red) (E), and mitochondrial membrane potential (quantified with MTDR) (G) compared with mature RBCs from HCs but there was no significant difference in mitochondrial mass (D), superoxide levels (F), or mitochondrial membrane potential (H) between SCD and HC reticulocytes. Errors bars represent the sample mean ± SD. *P < .05, Student t test.
Mitochondrial retention in SCD RBCs by SIM
The SIM microscope is capable of relatively fast superresolution imaging35 to better define mitochondrial structure while imaging at frame rates that are capable of decreasing motion artifacts. We observed relatively higher amounts of inactive mitochondria (depolarized; MTG stained) compared with active mitochondria (polarized; TMRM stained) in the Hoechst-negative RBCs (Figure 5; supplemental Video 1). Flow cytometric–sorted RBCs from SCD patients were labeled with mitochondrial (MTDR; red), nuclear (Hoechst; blue), and mature RBC (CD235a; green) markers. We observed mitochondria retention in the RBCs from SCD patients, in contrast to the absence of mitochondria in RBCs from HCs (supplemental Video 2). Similar observations were noted in reticulocytes from patients with SCD compared with HCs (supplemental Figure Video 3).
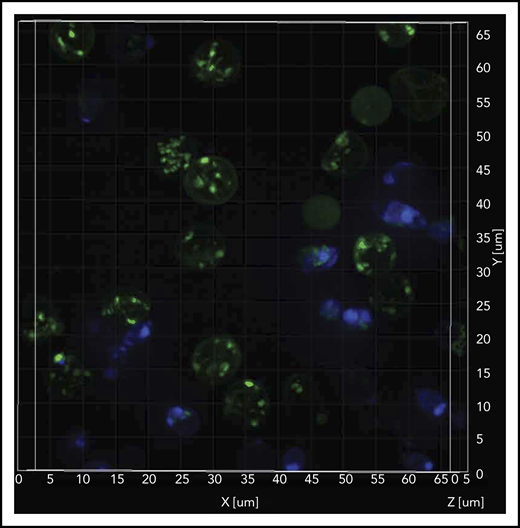
Sickle cell RBCs retain mitochondria. Confocal imaging of blood cells from a patient who was SCD-Baseline stained with mitochondrial (MTG; green), and nuclear (Hoechst; blue) markers. The stained live cells were plated onto 35-mm No. 1.5 poly-d-lysine–coated glass-bottom Petri dishes, and superresolution imaging was performed on the instant SIM. Note that the majority of cells that stained with MTG are anucleate (Hoechst negative). A 3-dimensional superresolution imaging of this figure showing mitochondrial retention in red cells is shown in supplemental Video 1 containing cells that are stained with mitochondrial markers MTG (green), and TMRM (red), markers that stain inactive (depolorized) and active (polarized) mitochondria respectively, and nuclear marker Hoechst (blue).
Sickle cell RBCs retain mitochondria. Confocal imaging of blood cells from a patient who was SCD-Baseline stained with mitochondrial (MTG; green), and nuclear (Hoechst; blue) markers. The stained live cells were plated onto 35-mm No. 1.5 poly-d-lysine–coated glass-bottom Petri dishes, and superresolution imaging was performed on the instant SIM. Note that the majority of cells that stained with MTG are anucleate (Hoechst negative). A 3-dimensional superresolution imaging of this figure showing mitochondrial retention in red cells is shown in supplemental Video 1 containing cells that are stained with mitochondrial markers MTG (green), and TMRM (red), markers that stain inactive (depolorized) and active (polarized) mitochondria respectively, and nuclear marker Hoechst (blue).
Mitochondrial retention in SCD by 3-dimensional FIB-SEM
The presence of mitochondria in mature SCD RBCs was confirmed by 3-dimensional FIB-SEM. We observed mitochondrial bundles in several sickle cell erythrocytes in the imaged sample volume (8.33 × 7.77 × 7.46 μm, xyz; isotropic pixel size of 9 nm) (Figure 6), providing additional evidence that circulating erythrocytes in patients with SCD abnormally retain mitochondria.
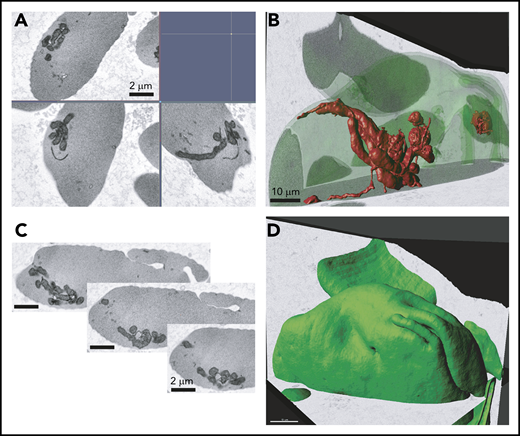
Electron microscopy analysis of SCD RBCs. Ultrastructural analysis of RBCs using electron microscopy. RBCs from patient who was SCD-Baseline were processed using FIB-SEM. (A) Electron micrograph of peripheral blood erythrocytes from a patient with SCD showing mitochondria. Scale bars, 2 μM. (B) Three-dimensional rendering of mitochondria inside the sickle erythrocyte. Image segmented mitochondria are red. Scale bars, 10 μM. (C) Series of image frames from the FIB-SEM image stack. Slice thickness, 9 nm. Isotropic voxel size, 9 nm. (D) Outward morphology of sickle erythrocyte. Cell periphery, green. Scale bars, 10 μm.
Electron microscopy analysis of SCD RBCs. Ultrastructural analysis of RBCs using electron microscopy. RBCs from patient who was SCD-Baseline were processed using FIB-SEM. (A) Electron micrograph of peripheral blood erythrocytes from a patient with SCD showing mitochondria. Scale bars, 2 μM. (B) Three-dimensional rendering of mitochondria inside the sickle erythrocyte. Image segmented mitochondria are red. Scale bars, 10 μM. (C) Series of image frames from the FIB-SEM image stack. Slice thickness, 9 nm. Isotropic voxel size, 9 nm. (D) Outward morphology of sickle erythrocyte. Cell periphery, green. Scale bars, 10 μm.
NET induction by cf-mtDNA through a cytosolic TBK1-mediated pathway
Because mtDNA is known to be a powerful DAMP, we explored whether SCD plasma containing elevated cf-mtDNA could activate neutrophils specifically by inducing NETs (Figure 7). Neutrophils from HCs were treated with similar amounts of freshly extracted gDNA and mtDNA (extracted from platelets) and SCD plasma containing elevated cf-mtDNA levels. NET production remained at baseline with isolated gDNA (0.8 ± 1.60). However, mtDNA and patient plasma induced strong comparable NET responses (average number of NETs ± SD: 14 ± 9.70 and 18.90 ± 8.80, respectively) (Figure 7A-B). We next sought to identify the intracellular pathway by which cf-mtDNA triggers the NET response (supplemental Figure 12A,C). Inhibitors of TLR9, both nonspecific and specific (ie, chloroquine and ODN TTAGGG [A151]), did not decrease the NET response induced by mtDNA or SCD plasma (supplemental Figure 12B,D). However, chloroquine and ODN TTAGGG efficiently reduced NET production caused by high concentrations of hemin (20 μM) (supplemental Figure 12B,E). TBK1 is known as a mediator in intracellular DNA sensing with proinflammatory and antiviral responses.36,37 Addition of the TBK1 inhibitor BX-795 significantly reduced NET formation induced by mtDNA and SCD plasma but not healthy plasma (Figure 7C-D), suggesting that a cytosolic pathway is responsible for mtDNA-induced NET formation and that serine/threonine TBK1 is involved in the process. In a parallel observation to address whether the cell-free heme in SCD plasma could contribute to the observed NETosis response, pretreatment with the TLR4-specific inhibitor CLI 095 did not affect NET production caused by mtDNA or SCD plasma; however, again, it significantly inhibited the hemin-induced response. This suggests that, in SCD, the cf-mtDNA in the plasma is the major NET trigger, whereas the heme/hemin content might be less important (supplemental Figure 13) and that the mechanism of neutrophil activation is likely to be TLR4 independent.

Induction of NET formation by gDNA and mtDNA and SCD plasma, with and without BX795. (A) Fluorescence microscopy images from a representative experiment showing NET formation following 7 hours of treatment with a similar concentration of gDNA purified from whole blood or mtDNA purified from platelets or 10% plasma with high cf-mtDNA from a patient with SCD. As a control, neutrophils were left untreated in RPMI 1640 or in RPMI 1640 containing AE Buffer (the buffer in which gDNA and mtDNA were eluted following purification with a QIAGEN kit). Original magnification ×20. (B) NET production (average number of NETs ± SD) induced with AE Buffer (n = 2; 1.67 ± 2.92), gDNA (n = 2; 0.80 ± 1.60), purified mtDNA (n = 5; 14.00 ± 9.70), or cf-mtDNA SCD plasma (n = 5; 18.90 ± 8.80). Representative fluorescence microscopy images (C; original magnification ×20) and NET counts (D) showing that a 4-hour pretreatment with 10 mM BX-795 decreased NET production after a 5 hour-induction with 500 mM purified mtDNA (n = 3; ***P = .0004) or cf-mtDNA in SCD plasma (n = 5; ****P = .0001), but it did not affect the basal NETosis with healthy plasma (H-Plasma; n = 3; P = .1170). n.s., not significant.
Induction of NET formation by gDNA and mtDNA and SCD plasma, with and without BX795. (A) Fluorescence microscopy images from a representative experiment showing NET formation following 7 hours of treatment with a similar concentration of gDNA purified from whole blood or mtDNA purified from platelets or 10% plasma with high cf-mtDNA from a patient with SCD. As a control, neutrophils were left untreated in RPMI 1640 or in RPMI 1640 containing AE Buffer (the buffer in which gDNA and mtDNA were eluted following purification with a QIAGEN kit). Original magnification ×20. (B) NET production (average number of NETs ± SD) induced with AE Buffer (n = 2; 1.67 ± 2.92), gDNA (n = 2; 0.80 ± 1.60), purified mtDNA (n = 5; 14.00 ± 9.70), or cf-mtDNA SCD plasma (n = 5; 18.90 ± 8.80). Representative fluorescence microscopy images (C; original magnification ×20) and NET counts (D) showing that a 4-hour pretreatment with 10 mM BX-795 decreased NET production after a 5 hour-induction with 500 mM purified mtDNA (n = 3; ***P = .0004) or cf-mtDNA in SCD plasma (n = 5; ****P = .0001), but it did not affect the basal NETosis with healthy plasma (H-Plasma; n = 3; P = .1170). n.s., not significant.
cf-mtDNA is also disproportionately increased in sickle mice
We replicated our findings of a disproportionate increase in cf-mtDNA in a humanized sickle mouse model (Townes). cf-mtDNA was increased by more than twofold, and the proportion of cf-mtDNA over cf-nDNA was ∼13-fold higher in Townes homozygous HbSS mice compared with Townes HbAA control mice (supplemental Figure 14).
Discussion
In the present study, we provide evidence that cfDNA has a distinctive contribution to sickle pathology. We show for the first time that, within the cfDNA fraction, DNA of mitochondrial origin is disproportionately increased over nuclear DNA and that the majority of the cf-mtDNA were short and fragmented, with a peak size ∼131 bp. Although the cf-mtDNA/cf-nDNA ratios are similar during crises compared with the steady-state, hypomethylation of the cf-mtDNA fraction is disproportionately increased in VOEs. Emerging evidence implicates a role for cfDNA in a range of pathophysiologies, including inflammation, aging, and cognitive impairment.38-40 More recent studies have shown that hypomethylated cfDNA, in particular hypomethylated cf-mtDNA, acts as a powerful proinflammatory DAMP.41-45 In this regard, we could demonstrate that SCD plasma containing high levels of cf-mtDNA triggered the formation of NETs. NET formation is a crucial component of the innate immune response; although it is protective in bacterial infections, it is detrimental as a major contributor to the sterile inflammation in a diverse group of chronic inflammatory conditions,46 and mtDNA has been documented to play a crucial role in NETosis.47 Here, using specific pathway inhibitors (CLI 095, chloroquine, ODN A151 and BX-795), we show that mtDNA-induced NETosis in SCD plasma is primarily dependent on the TBK1-mediated pathway.
Organelle clearance is 1 of the fundamental characteristics of differentiating erythroid cells, and mitochondrial clearance occurs when reticulocytes mature to erythrocytes. This process, however, appears to be impaired in patients with SCD, because the abnormal mitochondria retention occurs predominantly in enucleated mature RBCs. Further, the mitochondria that are retained in the sickle RBCs are depolarized, in a state that is associated with increased mROS, as demonstrated in a previous study.48 These conditions of oxidative stress can cause mtDNA damage and degradation. The degraded and hypomethylated mtDNA fragments serve as DAMPs and stimuli for activation of the cGAS-STING-TBK1 pathway, as exemplified in a recent study that documented the role of cf-mtDNA in a systemic lupus erythematosus disease mouse model.49,50 We show here that cf-mtDNA from RBCs of patients with SCD serves as endogenous ligands for DNA-sensing pattern recognition receptors and, more specifically, as a proinflammatory DAMP via the cGAS-STING-TBK1 pathway in neutrophils, which may contribute to the underlying chronic inflammatory state of SCD. We also showed that induction of NETs by SCD cf-mtDNA is independent of the other e-DAMPs (heme, HMGB1, cfDNA) that induce NETs via TLR4 and TLR9.
Retention of mitochondria in red cells has also been shown to occur in Pearson’s syndrome, a sporadic infant-onset mitochondrial disorder that is caused by a heteroplasmic mtDNA deletion, resulting in the impairment of mitochondrial clearance from reticulocytes, with excessive oxidative stress leading to premature destruction of the erythrocytes.51 Abnormal retention of mitochondria and the accelerated breakdown of erythrocytes in SCD lead to an increase in the levels of cf-mtDNA, exacerbating the increase in mitochondrial oxidative stress and more cf-mtDNA DAMPs in a feed-forward cycle manner.52 Another example of red cell mitochondrial retention has been shown in patients with HbE/β-thalassemia,53 an anemia that is characterized by defects in reticulocyte maturation and oxidative stress.54 It had been noted that splenectomized patients with β-thalassemia tend to have higher levels of cfDNA.55 In this regard, the functional asplenia in SCD may contribute to higher cf-nDNA and impaired clearance of the RBCs retaining mitochondria, adding to a differential increase in cf-mtDNA.
Iterative episodes of vascular occlusion and localized ischemia result in tissue damage, increased apoptosis, and chronic low-grade inflammation that inflicts ongoing organ damage in SCD.56 Cell-free heme (oxidative product of Hb), a consequence of the ongoing hemolysis in SCD, has been implicated as a major contributor to the inflammatory pathology; heme has been shown to activate TLR4 and potentially activate the NLRP3 inflammasome, increasing IL-1β. Heme has also been shown to induce formation of NETs by increasing intracellular neutrophil ROS formation in humans and promoting acute lung injury and death in sickle cell mice.17 Our findings suggest that mtDNA is an underappreciated and important e-DAMP in the ongoing pathological inflammation of SCD. Further understanding of the cross talk among various signature components of SCD-impaired mitophagy and ineffective erythropoiesis, hemolysis, inflammation triggered by nonerythroid cells (eg, neutrophils), and the emerging immunomodulatory role of erythrocytes57 will be vital in elucidating the underlying mechanisms among these components that contribute to the pathogenesis and pathophysiology of SCD.
Presented in abstract form at the 43rd annual meeting of the American Society of Hematology, San Diego, CA, 1 December 2018.
Data are available at https://doi.org/10.6084/m9.figshare.14079896.v1.
The online version of this article contains a data supplement.
The publication costs of this article were defrayed in part by page charge payment. Therefore, and solely to indicate this fact, this article is hereby marked “advertisement” in accordance with 18 USC section 1734.
Acknowledgments
The authors thank all of the patients and donors without whom this study would not have been possible. They are thankful for the excellent support received from the clinical staff of the Sickle Cell Branch. The authors also thank the DNA Sequencing and Genomics Core (Yuesheng Li, director) and the Flow Cytometry Core (Philip McCoy, director) at the National Heart, Lung, and Blood Institute for excellent technical support, as well as members of the S.L.T. laboratory for helpful discussions.
This study was supported by the Intramural Research Program of the National Heart, Lung, and Blood Institute.
Authorship
Contribution: L.T. and S.L.T. designed the study, analyzed data, and wrote the manuscript; L.T., S.G.-C., and Simon Yang performed cell-free DNA experiments; E.A.B. and L.H.W.W. performed NETosis assays and analyzed the data; Shutong Yang and J.H.C. performed sickle mouse assays; I.S. performed red cell mitochondrial DNA assays; L.E.F.A. and Z.M.N.Q. provided sickle mouse support; M.M.A., F.T.S., I.T., and M.P. provided bioinformatics support; P.K.D. provided flow cytometry support; J.Z. provided genome sequencing support; C.A.C. performed confocal microscopy; E.L. and C.K.E.B. performed electron microscopy; J.S.N. and A.S.S. provided clinical support; and S.L.T. supervised the study.
Conflict-of-interest disclosure: The authors declare no competing financial interests.
Correspondence: Swee Lay Thein, National Heart, Lung and Blood Institute/National Institutes of Health, Building 10-CRC, Room 6S241, 10 Center Dr, Bethesda, MD 20892; e-mail: sl.thein@nih.gov.

This feature is available to Subscribers Only
Sign In or Create an Account Close Modal