

Key Points
In primary GC B cells, OBF1 bind to genes important for GCs, including the key regulators BCL6 and FOXO1.
OBF1 maintains proliferation of GC-derived lymphoma cells and is a master regulator controlling the GC program.

Abstract
OBF1 is a specific coactivator of the POU family transcription factors OCT1 and OCT2. OBF1 and OCT2 are B cell–specific and indispensable for germinal center (GC) formation, but their mechanism of action is unclear. Here, we show by chromatin immunoprecipitation-sequencing that OBF1 extensively colocalizes with OCT1 and OCT2. We found that these factors also often colocalize with transcription factors of the ETS family. Furthermore, we showed that OBF1, OCT2, and OCT1 bind widely to the promoters or enhancers of genes involved in GC formation in mouse and human GC B cells. Short hairpin RNA knockdown experiments demonstrated that OCT1, OCT2, and OBF1 regulate each other and are essential for proliferation of GC-derived lymphoma cell lines. OBF1 downregulation disrupts the GC transcriptional program: genes involved in GC maintenance, such as BCL6, are downregulated, whereas genes related to exit from the GC program, such as IRF4, are upregulated. Ectopic expression of BCL6 does not restore the proliferation of GC-derived lymphoma cells depleted of OBF1 unless IRF4 is also depleted, indicating that OBF1 controls an essential regulatory node in GC differentiation.
Introduction
OCT2 and OCT1 are transcription factors (TFs) founding members of the POU family.1 They bind to the octamer motif 5′-ATGCAAAT-3′,2 first identified as a conserved element in the regulatory regions of immunoglobulin genes.3-6 OBF1 (aka OCA-B/Bob.1) is a B-cell–specific coactivator that interacts with OCT1 and/or OCT2 on cognate sites.7,8 It enhances transcriptional activity of OCT1 and OCT2 on target genes.7,9-12 Based on their B-cell specificity, OCT2 and OBF1 have been thought to be critical factors for immunoglobulin expression.9,13,14 However, mice lacking OCT2 or OBF1 showed largely normal immunoglobulin transcription and B-cell development but demonstrated the importance of these factors for humoral immune responses and transcription of isotype-switched immunoglobulins.15 OBF1 is essential for the formation of germinal centers (GCs),15-19 dynamic structures that form in peripheral lymphoid organs in response to T-cell–dependent antigens.20-22 The role of OCT2 in GC formation is unclear: OCT2-deficient mice lacked GCs following NP-OVA immunization,15 but showed normal GC formation after influenza virus or NP-KLH challenge.23,24 However, in the latter cases, GC B-cell function was impaired.23,24
During the GC reaction, B cells undergo rapid proliferation and immunoglobulin gene hypermutation, leading to the selection of B cells with increased affinity for specific antigens and differentiation into high-affinity antibody-secreting plasma cells (PCs) or memory B cells.20-22,25-27 BCL6 is a master regulator of GCs, maintaining the GC transcriptional program and suppressing the expression of genes essential for further differentiation to PCs.27-31 The majority of non-Hodgkin lymphomas, including Burkitt lymphoma (BL) and most diffuse large B-cell lymphoma (DLBCL),32,33 originate from GCs. BLs and GC B-subtype DLBCLs closely resemble GC cells34,35 ; therefore, they serve as a model to study the transcriptional regulation of the GC reaction.
OCT2 and OBF1 are expressed throughout B-cell development, but particularly highly in GC B cells and BL cells.36,37 DLBCLs are sensitive to the loss of OBF1, which is controlled by a superenhancer38 ; a screen identified OBF1 as an essential gene for a GC-derived BL cell line.39 Although the link between OCT/OBF1 and GCs is established, the underlying mechanism remains unclear.
Here, we generated genomic binding maps of OCT1, OCT2, and OBF1 in primary B cells and investigated the functional relevance of these factors for GCs. We found that they extensively colocalize with each other and with ETS factors, and we showed that OBF1 stabilizes the binding of OCT factors on chromatin. Moreover, they bind to the regulatory elements of multiple genes essential for the GC reaction in mouse and human GC B cells. In GC-derived lymphoma cells, OBF1 is the master regulator that controls cellular proliferation by modulating IRF4 expression. Upon OBF1 depletion, the GC transcriptional program was dramatically disrupted, as manifested by the downregulation of GC reaction master regulators, including BCL6 and FOXO1, and the derepression of genes promoting post-GC differentiation, such as IRF4 and BCL2L1. Thus, OBF1 controls the GC transcriptional program integrity and represents a promising therapeutic target for GC-derived lymphoma cells.
Methods
Mice
All strains were maintained on the C57BL/6J background. Animal experiments were carried out according to valid project licenses and approved and regularly controlled by the Swiss Cantonal Veterinary Office of Basel-Stadt. Pou2af1KO/KO mice have been described.16 Rosa26BirA/BirA mouse line40 was obtained from M. Busslinger (Research Institute of Molecular Pathology [IMP], Vienna, Austria).
Antibodies
The antibodies used in this study are provided in supplemental Table 1, available on the Blood Web site.
Cell culture
The 293T cells were cultured in Dulbecco’s modified Eagle medium, 10% fetal bovine serum (Sigma-Aldrich). Lymphoma cell lines were cultured in RPMI-1640 medium (10% fetal bovine serum, 50 μM 2-mercaptoethanol) and passaged every 2 to 3 days. Splenic B cells were stimulated with lipopolysaccharide (LPS) or anti-CD40/interleukin-4 (IL4). See supplemental Methods for detailed stimulation methods.
Generation of transgenic mice
See supplemental Methods for details.
Magnetic-activated cell sorting of CD19+ mature B cells
Splenic mature B cells were purified by magnetic-activated cell sorting using anti-mouse CD19 Microbeads (Miltenyi Biotec). See supplemental Methods for details.
Gene knockdown experiment by shRNA
pLKO.1 lentiviral vectors with specific short hairpin RNAs (shRNAs) for human Pou2f1, human Pou2f2, and human Pou2af1 were purchased from Sigma-Aldrich. shRNA sequences used in this paper are listed in supplemental Table 5. See supplemental Methods for details.
Immunoblotting
Cell lysates for immunoblotting were generated with RIPA buffer (50 mM Tris-HCl, pH7.4, 150 mM NaCl, 1 mM EDTA, 1% Triton X-100, 0.1% sodium dodecyl sulfate). Lysates were separated on 4% to 12% sodium dodecyl sulfate-polyacrylamide gels and transferred to polyvinylidene fluoride membranes. Antibodies are listed in supplemental Table 1.
RNA extraction and qPCR
Total cellular RNA from 5 × 10⁵ cells was extracted using RNeasy Micro Kit (QIAGEN), complementary DNA was generated using ImProm-II Reverse Transcription System (Promega), and quantitative polymerase chain reaction (qPCR) performed using FastStart Universal SYBR Green Master (Roche) with gene-specific primers; human Actb was used as a reference gene. The StepOne Real-Time PCR System (Applied Biosystems) was used to read qPCR signals. Oligonucleotide sequences are specified in supplemental Table 6.
ChIP, Bio-ChIP-seq
A total of 5 × 10⁷ in vitro cultured CD19+ splenic B cells stimulated with LPS or anti-CD40/IL4 were used for chromatin immunoprecipitation (ChIP) as described41 with modifications, or for Bio-ChIP-sequencing (seq). See supplemental Methods for detailed experimental procedures.
ChIP-seq data processing
See supplemental Methods for details.
RNA-seq and data processing
See supplemental Methods for details.
Human GC B-cell isolation
Human GC B-cell populations were purified by fluorescence-activated cell sorting (FACS) from human tonsillectomy specimens with chronic tonsillitis. Tonsils were collected and anonymized during standard surgical pathology workup. All patients had given informed consent, in accordance with the Swiss Federal Act on Research involving Human Beings, article 38, and in accordance with the Declaration of Helsinki. GC B cells were sorted by flow cytometry based on surface expression of CD19, CD38, and immunoglobulin D.
Results
OCT1, OCT2, and OBF1 show genome-wide colocalization
To elucidate the chromatin occupancy of OCT1 (Pou2f1), OCT2 (Pou2f2), and OBF1 (Pou2af1) in B cells, we generated transgenic mice in which these TFs are endogenously tagged with an AviTag-FLAG42,43 (Pou2f1AviF and Pou2af1AviF) or an AviTag (Pou2f2Avi; supplemental Figure 1A shows the targeting strategy). Intercrossing these mice with mice ubiquitously expressing the Escherichia coli biotin ligase BirA from the Rosa26 locus40 led to robust biotinylation of the tagged factors in B cells, which allowed their efficient streptavidin-mediated precipitation.
To determine the genome-wide binding patterns of OCT1, OCT2, and OBF1 (hereafter OCT1/OCT2/OBF1), we collected mouse CD19+ splenic B cells from the different strains, cultured them in presence of bacterial LPS, and then performed Bio-ChIP-seq.44 We identified 7822, 13 482, and 32 596 Bio-ChIP-seq peaks for OBF1/OCT1/OCT2, respectively, with strong enrichment of the signal over input (supplemental Figure 1B). Notably, the expression level of OCT2 was much higher than that of OCT1 (supplemental Figure 1F), which likely explains why more OCT2 than OCT1 peaks were identified. For OBF1, conventional ChIP with antibodies identified much fewer peaks with lower overall enrichment; however, all antibody-derived peaks were contained within the Bio-ChIP-seq peaks (supplemental Figure 1C-D).
We observed considerable overlap among the 3 factors: 95.7% of OCT1 peaks overlapped with OCT2 peaks, 89.4% of OBF1 peaks overlapped with OCT1 peaks, and 95.6% of OBF1 peaks overlapped with OCT2 peaks (Figure 1A-C). ChIP-seq read counts were highly correlated among all 3 factors (Figure 1D-F). Furthermore, the ChIP signals of all 3 factors were strongly concentrated in the center of a 5-kb window around OCT1 peak summits (Figure 1G-H).
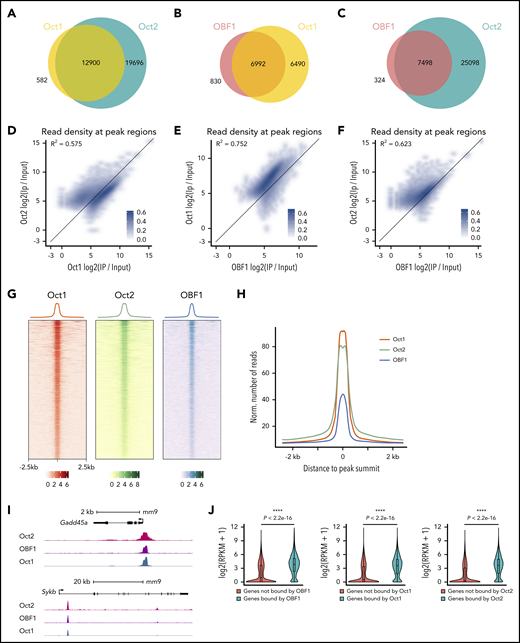
OCT1, OCT2, and OBF1 show genome-wide colocalization. (A-C) Venn diagrams showing the overlaps among OCT1, OCT2, and OBF1 peaks in LPS-stimulated splenic B cells. (D-F) Correlation of enrichment between OCT1 and OCT2 (D), OBF1 and OCT1 (E), and OBF1 and OCT2 (F) ChIP-seq samples under LPS stimulation. (G) Heatmap showing OCT1, OCT2, and OBF1 ChIP enrichment under LPS stimulation in 5-kb windows centered on OCT1 peak summits. (H) Mean of alignments of OCT1, OCT2, and OBF1 ChIP-seq signals centered on OCT1 peak summits within 5-kb genomic window under LPS stimulation. (I) OBF1/OCT1/OCT2 ChIP-seq read densities in LPS-stimulated mouse splenic B cells at 2 known OBF1 target gene loci. (J) Violin plots showing distributions of expression levels of genes grouped by their association with OBF1 (left), OCT1 (middle), or OCT2 (right) in splenic B cells stimulated with LPS. Mean ± standard deviation; *P < .05; **P < .01; ***P < .001; ****P < .0001 (Mann-Whitney U test).
OCT1, OCT2, and OBF1 show genome-wide colocalization. (A-C) Venn diagrams showing the overlaps among OCT1, OCT2, and OBF1 peaks in LPS-stimulated splenic B cells. (D-F) Correlation of enrichment between OCT1 and OCT2 (D), OBF1 and OCT1 (E), and OBF1 and OCT2 (F) ChIP-seq samples under LPS stimulation. (G) Heatmap showing OCT1, OCT2, and OBF1 ChIP enrichment under LPS stimulation in 5-kb windows centered on OCT1 peak summits. (H) Mean of alignments of OCT1, OCT2, and OBF1 ChIP-seq signals centered on OCT1 peak summits within 5-kb genomic window under LPS stimulation. (I) OBF1/OCT1/OCT2 ChIP-seq read densities in LPS-stimulated mouse splenic B cells at 2 known OBF1 target gene loci. (J) Violin plots showing distributions of expression levels of genes grouped by their association with OBF1 (left), OCT1 (middle), or OCT2 (right) in splenic B cells stimulated with LPS. Mean ± standard deviation; *P < .05; **P < .01; ***P < .001; ****P < .0001 (Mann-Whitney U test).
OCT1/OCT2/OBF1 occupy the promoters of known target genes, such as Cd36,45,46 Gadd45a,47 Id3,48 Spib,12 and Syk49 (Figure 1I; supplemental Figure 1E). RNA-seq analysis with LPS-stimulated splenic B cells showed that genes bound by at least 1 factor had significant higher expression than those not bound (Figure 1J). Thus, OCT1/OCT2/OBF1 colocalize at genome-wide level and their binding generally correlates with higher gene expression levels.
OCT1/OCT2/OBF1 occupy active functional genomic elements
Previous studies have shown the association of OCT1/OCT2/OBF1 with individual gene promoters and enhancers.11,47,50,51 Here, we found that most OBF1 and OCT1 peaks were located at promoter regions (±1 kb of the transcription start site [TSS]; Figure 2A-B). By contrast, most OCT2 peaks were located at regions distal to TSSs (>1 kb away), and only 30.4% of OCT2 peaks mapped to promoters (Figure 2A-B).
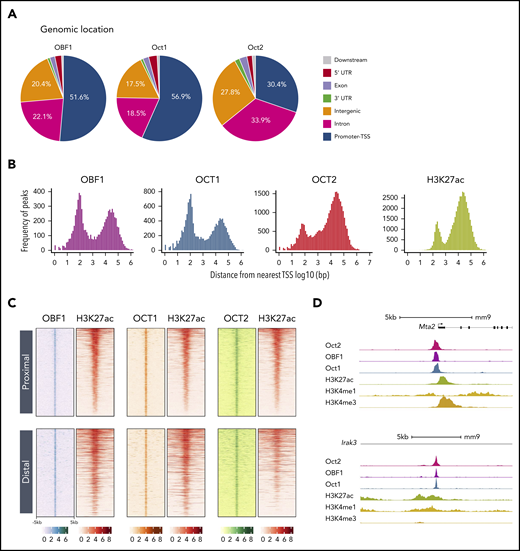
OCT1, OCT2, and OBF1 occupy active functional genomic elements. (A) Genomic distribution of OBF1/OCT1/OCT2 peaks under LPS stimulation. “Promoters” are defined as TSS ± 1 kb. “Downstream” is defined as within 3 kb downstream of 3′ untranslated region. (B) Distributions of distances among OBF1, OCT1, OCT2, and H3K27ac peaks and the nearest TSS (log10 scale). (C) OBF1, OCT1, OCT2, and H3K27ac ChIP-seq enrichments in 10-kb genomic windows centered on the middle of overlapping peaks among OBF1, OCT1, and OCT2. ChIP-seq was performed with CD19+ splenic B cells treated with LPS for 72 hours. (D) OCT1, OBF1, OCT2, H3K27ac, H3K4me1, and H3K4me3 ChIP-seq read densities at 2 individual gene loci, illustrating the colocalization of measured signals.
OCT1, OCT2, and OBF1 occupy active functional genomic elements. (A) Genomic distribution of OBF1/OCT1/OCT2 peaks under LPS stimulation. “Promoters” are defined as TSS ± 1 kb. “Downstream” is defined as within 3 kb downstream of 3′ untranslated region. (B) Distributions of distances among OBF1, OCT1, OCT2, and H3K27ac peaks and the nearest TSS (log10 scale). (C) OBF1, OCT1, OCT2, and H3K27ac ChIP-seq enrichments in 10-kb genomic windows centered on the middle of overlapping peaks among OBF1, OCT1, and OCT2. ChIP-seq was performed with CD19+ splenic B cells treated with LPS for 72 hours. (D) OCT1, OBF1, OCT2, H3K27ac, H3K4me1, and H3K4me3 ChIP-seq read densities at 2 individual gene loci, illustrating the colocalization of measured signals.
To evaluate whether the proximal and distal binding sites are indeed active promoters or enhancers, we examined the level of histone H3 lysine 27 acetylation (H3K27ac), a histone modification representative of active regulatory elements.52,53 H3K27ac ChIP-seq identified 46 732 H3K27ac-enriched regions both proximal and distal to TSSs (Figure 2B). H3K27ac-enriched loci highly overlapped with OCT1/OCT2/OBF1 binding sites, the vast majority of which were enriched for H3K27ac marks (Figure 2C). The colocalization of OCT1/OCT2/OBF1 on active promoters (marked by high H3K4me3, low H3K4me1, and high H3K27ac signal) and active enhancers (marked by high H3K4me1 and H3K27ac signal54 ) is illustrated in Figure 2D. Furthermore, the H3K27ac level is significantly higher on the promoters of genes bound by OCT1, OCT2, or OBF1 (supplemental Figure 1G); these factors are mainly bound to active genes (supplemental Figure 1H). In summary, OCT1/OCT2/OBF1 binding mainly occurs within active regulatory elements, indicating a functional role in transcriptional activation.
OCT1/OCT2/OBF1 colocalize with TFs of the ETS family
OBF1 lacks a DNA-binding domain, and its only established recruiting partners are OCT1 and OCT2.7,55-59 De novo motif discovery of OCT1/OCT2/OBF1 peak regions identified among the top enriched motifs the sequence 5′-ATGCAAAT-3′60,61 that matches the octamer consensus motif (Figure 3A). The second most frequent motif identified corresponded to DNA sequences bound by ETS factors, with the core sequence 5′-GGAA-3′ (Figure 3A). PU.1, encoded by the Spi1 gene, is a key ETS factor involved in cell fate decisions between myeloid and lymphoid lineages.62-65 To understand the relative distribution of these factors, we determined the location of PU.1 and octamer motifs in the OCT1/OCT2/OBF1 peak regions: both types of motifs were most frequently found around peak summits (Figure 3B-C). The occurrences of PU.1 motifs at different distances around octamer sites within peak regions were determined (Figure 3D) and showed that PU.1 binding sites were preferentially found close to the octamer motifs, with the frequency peaking at a distance of about 50 bp (Figure 3D, black lines); shuffled PU.1 motifs showed significantly lower enrichments (Figure 3D, gray lines, P = .001996).
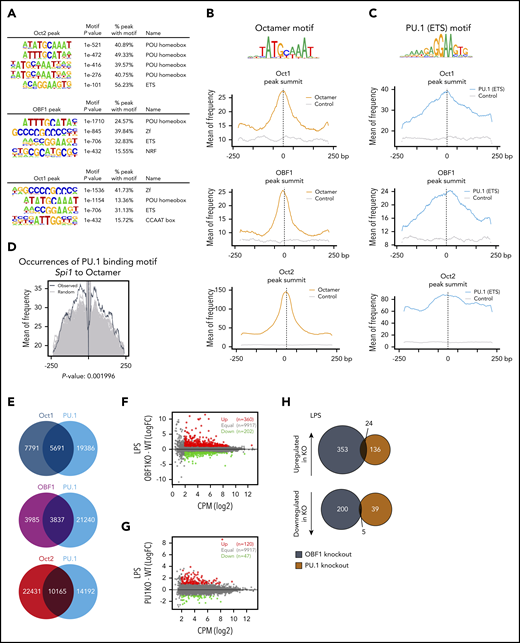
OCT1, OCT2, and OBF1 colocalize with TFs of the ETS family. (A) De novo motif analysis for Bio-ChIP-seq peak regions of OCT2 (top), OBF1 (middle), and OCT1 (bottom) in LPS-stimulated CD19+ mouse splenic B cells. Sequence logos and P values are shown for the most highly enriched sequence motifs. (B) Enrichment of Octamer motifs in OCT1, OBF1, and OCT2 in 500-bp windows centered on peak summits. Controls are randomly shuffled peak sequences that retain dinucleotide frequency. (C) Enrichment of PU.1 binding motifs (MA0080.3 in JASPAR database) in 500-bp windows centered on OCT1, OBF1, and OCT2 peak summits. Controls are randomly shuffled peak sequences that retain dinucleotide frequency. (D) Occurrence of PU.1 binding motif in a 500-bp window surrounding Octamer motifs in OBF1 overlapping peak regions. The black line shows the occurrences of original motifs within 500 bp around octamer motifs found in OBF1 peaks. Gray lines show the occurrences of randomly shuffled ETS motifs as backgrounds. Each of the original ETS motifs were randomized 500 times. After randomization, P value was calculated by comparing the 95th percentile of the occurrences of original motifs with the 95th percentiles of all randomly shuffled ETS motifs (500 times for each motif). (E) Venn diagrams showing overlaps between OCT1/OCT2/OBF1 peaks and PU.1 ChIP-seq peaks. (F) Average expression (log2 counts per million, x-axis) and change of expression (log2-fold change, y-axis) for genes in WT and OBF1 knockout CD19+ splenic B cells stimulated with LPS. Differentially expressed genes are color-coded (DEGs fold change ≥1, FDR <0.01, logCPM >2): red data points represent genes with higher expression level in OBF1 knockout cells; green data points represent genes with higher expression in wild type cells. (G) Average expression (log2 counts per million, x-axis) and change of expression (log2-fold change, y-axis) for genes in WT and PU.1 knockout CD19+ splenic B cells stimulated with LPS. Differentially expressed genes are color-coded (DEGs fold change ≥1, FDR <0.01, logCPM >2): red data points represent genes with higher expression level in PU.1 knockout cells; green data points represent genes with higher expression in WT cells. (H) Venn diagrams showing the overlaps between significantly upregulated (top) and downregulated (bottom) genes identified in OBF1 and PU.1 knockout B cells under LPS treatment. All samples in this figure were LPS-stimulated CD19+ mouse splenic B cells.
OCT1, OCT2, and OBF1 colocalize with TFs of the ETS family. (A) De novo motif analysis for Bio-ChIP-seq peak regions of OCT2 (top), OBF1 (middle), and OCT1 (bottom) in LPS-stimulated CD19+ mouse splenic B cells. Sequence logos and P values are shown for the most highly enriched sequence motifs. (B) Enrichment of Octamer motifs in OCT1, OBF1, and OCT2 in 500-bp windows centered on peak summits. Controls are randomly shuffled peak sequences that retain dinucleotide frequency. (C) Enrichment of PU.1 binding motifs (MA0080.3 in JASPAR database) in 500-bp windows centered on OCT1, OBF1, and OCT2 peak summits. Controls are randomly shuffled peak sequences that retain dinucleotide frequency. (D) Occurrence of PU.1 binding motif in a 500-bp window surrounding Octamer motifs in OBF1 overlapping peak regions. The black line shows the occurrences of original motifs within 500 bp around octamer motifs found in OBF1 peaks. Gray lines show the occurrences of randomly shuffled ETS motifs as backgrounds. Each of the original ETS motifs were randomized 500 times. After randomization, P value was calculated by comparing the 95th percentile of the occurrences of original motifs with the 95th percentiles of all randomly shuffled ETS motifs (500 times for each motif). (E) Venn diagrams showing overlaps between OCT1/OCT2/OBF1 peaks and PU.1 ChIP-seq peaks. (F) Average expression (log2 counts per million, x-axis) and change of expression (log2-fold change, y-axis) for genes in WT and OBF1 knockout CD19+ splenic B cells stimulated with LPS. Differentially expressed genes are color-coded (DEGs fold change ≥1, FDR <0.01, logCPM >2): red data points represent genes with higher expression level in OBF1 knockout cells; green data points represent genes with higher expression in wild type cells. (G) Average expression (log2 counts per million, x-axis) and change of expression (log2-fold change, y-axis) for genes in WT and PU.1 knockout CD19+ splenic B cells stimulated with LPS. Differentially expressed genes are color-coded (DEGs fold change ≥1, FDR <0.01, logCPM >2): red data points represent genes with higher expression level in PU.1 knockout cells; green data points represent genes with higher expression in WT cells. (H) Venn diagrams showing the overlaps between significantly upregulated (top) and downregulated (bottom) genes identified in OBF1 and PU.1 knockout B cells under LPS treatment. All samples in this figure were LPS-stimulated CD19+ mouse splenic B cells.
We next performed PU.1 ChIP-seq and found that OCT1/OCT2/OBF1 extensively colocalized with PU.1 (Figure 3E; supplemental Figure 2A); ETS1 also colocalized with OCT1/OCT2/OBF1 in public ETS1 ChIP-seq data66 (supplemental Figure 2B-C). We then systematically analyzed co-occurrences of binding motifs for all ETS factors which, based on our RNA-seq data, are expressed in B cells. Several of these ETS factors showed highly significant co-occurrence with octamer binding sites present in OBF1 peaks (supplemental Figure 2D), indicating that, besides PU.1 and ETS1, additional ETS factors may colocalize with OCT1/OCT2/OBF1. To test whether OBF1 and PU.1 regulate genes in common, we performed RNA-seq analysis with splenic B cells isolated from Spi1KO/KO or Pou2af1KO/KO knockout mice. However, only minor overlap was identified among the differentially expressed genes (DEGs) (Figure 3F-H). Together, our results indicate that OCT1/OCT2/OBF1 generally tend to colocalize with ETS factors in B cells, but the functional consequence is unclear.
OBF1 stabilizes the binding of OCT1 to chromatin
OBF1 has no independent DNA-binding capability and requires recruitment by Oct factors to associate with target sites.11,13,67 Thereby, it might help to stabilize Oct factors on chromatin. We observed a strong positive correlation between OCT1/2 and OBF1 binding (Figure 4A; supplemental Figure 3A): OCT1 or OCT2 peaks were significantly more enriched (signal/input) when colocalized with OBF1 (Figure 4B-C). By contrast, the enrichment of Oct factor peaks was not dependent on colocalization with PU.1 (Figure 4D; supplemental Figure 3B). To confirm that OBF1 stabilizes the binding of Oct factors on chromatin, we generated Pou2af1KO/KO mice expressing AviTag-tagged OCT1 (Pou2f1AviF/AviFRosa26BirA/BirAPou2af1KO/KO; Figure 4E) and isolated CD19+ splenic B cells. We examined by immunoblotting the expression level of OCT1 and OCT2 in these samples; whereas OCT1 level was unchanged, the OCT2 level was strongly dependent on OBF1 (supplemental Figure 3C, and see the following section). Seventy-two hours after LPS stimulation, we performed Bio-ChIP-seq for OCT1. We observed a general decrease in OCT1 peak enrichment among the regions bound by both OCT1 and OBF1 in wild-type (WT) B cells (Figure 4F), and 739 peaks (∼10.3% of total overlapping peaks) had significantly lower enrichment (WT/OBF1KO >2.5-fold; false discovery rate [FDR] <0.05) in Pou2af1KO/KO than in WT cells (Figure 4F-G). Only 73 peaks showed stronger binding signal in Pou2af1KO/KO cells (Figure 4F). We assigned the significantly differentially enriched peaks to the nearest genes and performed gene ontology analysis: the genes identified are involved in leukocyte activation/differentiation, immune system development, and immune response (Figure 4G). The H3K27ac level was significantly reduced at the 739 peak regions when OBF1 was ablated (Figure 4H-I), suggesting that reduced OCT1 binding leads to a reduction in H3K27ac level. Our results demonstrate that OBF1 stabilizes OCT1 binding, which helps to regulate the H3K27ac levels of target loci.
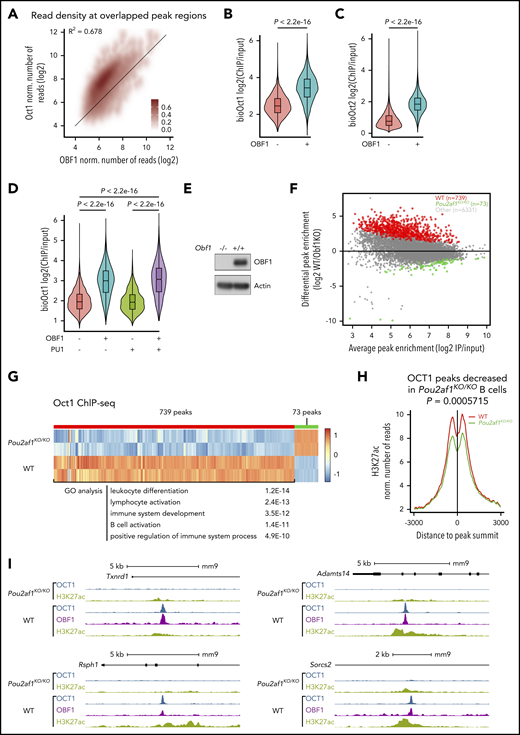
OBF1 stabilizes the binding of OCT1 to chromatin. (A) Normalized number of OBF1 and OCT1 Bio-ChIP-seq reads in overlapping peaks from LPS-stimulated CD19+ mouse splenic B cells. (B) Violin plots showing enrichment of OCT1 Bio-ChIP-seq samples according to their overlap with OBF1. (C) Violin plots showing enrichment of OCT2 Bio-ChIP-seq samples according to their overlap with OBF1. (D) Violin plots showing enrichment of OCT1 Bio-ChIP-seq samples according to their overlap with OBF1, PU.1, or both. (B-D) Mean ± standard deviation; *P < .05; **P < .01; ***P < .001; ****P < .0001 (2-tailed Student t test). (E) Immunoblot showing OBF1 levels in LPS-treated splenic B cells in WT and Pou2af1 knockout mice. The membrane was probed with an antibody against OBF1; actin is shown as loading control. (F) Differential OCT1 binding regions in WT and Pou2af1KO/KO CD19+ splenic B cells stimulated by LPS (red dots, OCT1 binding regions showing significantly weaker binding in Pou2af1 knockout samples than in WT; green dots, OCT1 binding regions showing significantly stronger binding in Pou2af1 knockout samples than in WT). (G) Heatmap showing the OCT1 Bio-ChIP-seq signal of WT and Pou2af1KO/KO CD19+ splenic B cells on differentially bound regions. A total of 739 peaks regions show significantly decreased OCT1 Bio-ChIP-seq signal in Pou2af1 knockout samples. Gene ontology analysis was performed using genes nearest to the peak’s regions. (H) Mean of alignments of H3K27ac ChIP-seq signals centered on OCT1 peak summits within 6-kb genomic window in WT and Pou2af1KO/KO CD19+ splenic B cells stimulated by LPS. (P value was calculated by Mann-Whitney U test). (I) OCT1 ChIP-seq read densities between Pou2af1KO/KO and WT CD19+ splenic B treated with LPS for 72 hours.
OBF1 stabilizes the binding of OCT1 to chromatin. (A) Normalized number of OBF1 and OCT1 Bio-ChIP-seq reads in overlapping peaks from LPS-stimulated CD19+ mouse splenic B cells. (B) Violin plots showing enrichment of OCT1 Bio-ChIP-seq samples according to their overlap with OBF1. (C) Violin plots showing enrichment of OCT2 Bio-ChIP-seq samples according to their overlap with OBF1. (D) Violin plots showing enrichment of OCT1 Bio-ChIP-seq samples according to their overlap with OBF1, PU.1, or both. (B-D) Mean ± standard deviation; *P < .05; **P < .01; ***P < .001; ****P < .0001 (2-tailed Student t test). (E) Immunoblot showing OBF1 levels in LPS-treated splenic B cells in WT and Pou2af1 knockout mice. The membrane was probed with an antibody against OBF1; actin is shown as loading control. (F) Differential OCT1 binding regions in WT and Pou2af1KO/KO CD19+ splenic B cells stimulated by LPS (red dots, OCT1 binding regions showing significantly weaker binding in Pou2af1 knockout samples than in WT; green dots, OCT1 binding regions showing significantly stronger binding in Pou2af1 knockout samples than in WT). (G) Heatmap showing the OCT1 Bio-ChIP-seq signal of WT and Pou2af1KO/KO CD19+ splenic B cells on differentially bound regions. A total of 739 peaks regions show significantly decreased OCT1 Bio-ChIP-seq signal in Pou2af1 knockout samples. Gene ontology analysis was performed using genes nearest to the peak’s regions. (H) Mean of alignments of H3K27ac ChIP-seq signals centered on OCT1 peak summits within 6-kb genomic window in WT and Pou2af1KO/KO CD19+ splenic B cells stimulated by LPS. (P value was calculated by Mann-Whitney U test). (I) OCT1 ChIP-seq read densities between Pou2af1KO/KO and WT CD19+ splenic B treated with LPS for 72 hours.
OBF1 regulates the GC transcriptional program
To understand the roles of OCT1/OCT2/OBF1 in GC formation, we stimulated B cells with anti-CD40/IL4, a T-cell–dependent stimulation mimicking the GC reaction, and performed RNA-seq and Bio-ChIP-seq. LPS, a T-cell–independent signal, was used as a comparison. As expected, GC reaction-related genes were upregulated after anti-CD40/IL4 stimulation (Figure 5A). OBF1 showed enhanced binding to the promoters of multiple GC-associated genes (Figure 5B), suggesting that it regulates GCs by activating the expression of genes associated with this pathway.
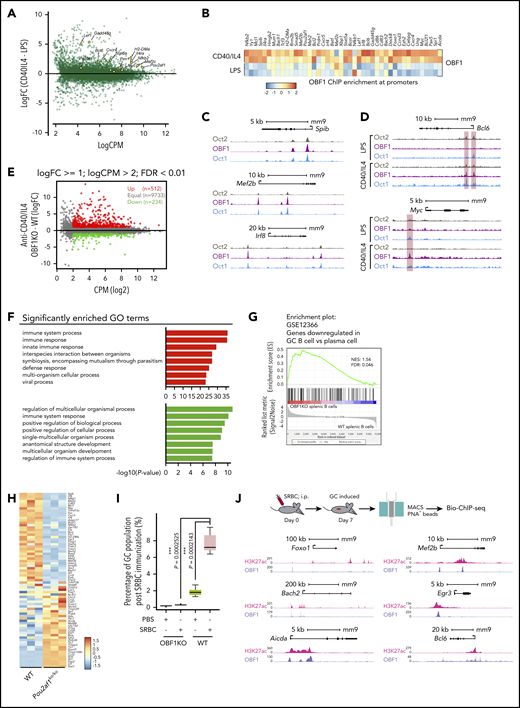
OBF1 regulates the GC transcriptional program. (A) Differentially expressed genes between anti-CD40/IL4 and LPS-stimulated CD19+ mouse splenic B cells. GC-related genes with significantly higher expression under anti-CD40/IL4 stimulation are indicated (yellow dots). (B) Heatmap showing OBF1 ChIP enrichment at promoter regions (TSS ± 1 kb) of selected GC-related genes under LPS or anti-CD40/IL4 stimulations (red dots, OCT1-binding regions showing significantly higher binding in B cells treated with anti-CD40/IL4; green dots, OCT1-binding regions showing significantly higher binding in B cells treated with LPS). (C) OCT2, OBF1, and OCT1 read densities at 3 individual gene loci, as indicated. (D) Anti-CD40/IL4-induced OBF1 binding to the Bcl6 and Myc gene promoters. (E) Average expression (log2 counts per million, x-axis) and change of expression (log2-fold change, y-axis) for genes in WT and OBF1 knockout CD19+ splenic B cells stimulated with anti-CD40/IL4. Differentially expressed genes are color-coded (DEGs fold change ≥1, FDR <0.01, logCPM >2): red data points represent genes with higher expression level in OBF1 knockout cells, green data points represent genes with higher expression in WT cells. (F) Gene ontology analysis was performed with the genes up- and downregulated in OBF1 knockout vs WT splenic B cells stimulated with anti-CD40/IL4. (G) GSEA of relative gene expression in OBF1 knockout vs WT anti-CD40/IL4 stimulated splenic B cells against the genes downregulated in GC B cells vs plasma cells. NES, normalized enrichment score. (H) Heatmaps showing differentially expressed genes between OBF1 knockout vs WT B cells. Differentially expressed genes involved in GC reaction are selected. (I) Boxplot showing the percentages of germinal center B cells in WT and Pou2af1KO/KO mice by FACS at day 7 post-SRBC challenge. n = 5; mean ± standard deviation; *P < .05; **P < .01; ***P < .001; ****P < .0001 (2-sided Student t test). (J) Top, workflow of germinal center induction by intraperitoneal injection of 10% SRBC solution and the isolation of GC B cells for Bio-ChIP-seq. Bottom, OBF1 and H3K27ac reads densities at six individual gene loci, as indicated, in purified mouse germinal center B cells induced by SRBCs.
OBF1 regulates the GC transcriptional program. (A) Differentially expressed genes between anti-CD40/IL4 and LPS-stimulated CD19+ mouse splenic B cells. GC-related genes with significantly higher expression under anti-CD40/IL4 stimulation are indicated (yellow dots). (B) Heatmap showing OBF1 ChIP enrichment at promoter regions (TSS ± 1 kb) of selected GC-related genes under LPS or anti-CD40/IL4 stimulations (red dots, OCT1-binding regions showing significantly higher binding in B cells treated with anti-CD40/IL4; green dots, OCT1-binding regions showing significantly higher binding in B cells treated with LPS). (C) OCT2, OBF1, and OCT1 read densities at 3 individual gene loci, as indicated. (D) Anti-CD40/IL4-induced OBF1 binding to the Bcl6 and Myc gene promoters. (E) Average expression (log2 counts per million, x-axis) and change of expression (log2-fold change, y-axis) for genes in WT and OBF1 knockout CD19+ splenic B cells stimulated with anti-CD40/IL4. Differentially expressed genes are color-coded (DEGs fold change ≥1, FDR <0.01, logCPM >2): red data points represent genes with higher expression level in OBF1 knockout cells, green data points represent genes with higher expression in WT cells. (F) Gene ontology analysis was performed with the genes up- and downregulated in OBF1 knockout vs WT splenic B cells stimulated with anti-CD40/IL4. (G) GSEA of relative gene expression in OBF1 knockout vs WT anti-CD40/IL4 stimulated splenic B cells against the genes downregulated in GC B cells vs plasma cells. NES, normalized enrichment score. (H) Heatmaps showing differentially expressed genes between OBF1 knockout vs WT B cells. Differentially expressed genes involved in GC reaction are selected. (I) Boxplot showing the percentages of germinal center B cells in WT and Pou2af1KO/KO mice by FACS at day 7 post-SRBC challenge. n = 5; mean ± standard deviation; *P < .05; **P < .01; ***P < .001; ****P < .0001 (2-sided Student t test). (J) Top, workflow of germinal center induction by intraperitoneal injection of 10% SRBC solution and the isolation of GC B cells for Bio-ChIP-seq. Bottom, OBF1 and H3K27ac reads densities at six individual gene loci, as indicated, in purified mouse germinal center B cells induced by SRBCs.
De novo motif analysis of regions differentially bound by OBF1 under anti-CD40/IL4 showed that motifs for GC-related TFs were highly enriched (supplemental Figure 4A). We observed similar patterns for OCT1 and OCT2 (supplemental Figure 4B-C). OBF1, OCT1, and OCT2 bound to multiple genes encoding TFs important for the initiation phase of GCs (Figure 5C; supplemental Figure 4D). After anti-CD40/IL4 stimulation, OBF1 showed enhanced binding to several key GC-related genes (eg, Bcl6,68 Myc, Foxo1, Mef2b and Spi127,69 ) (Figure 5D; supplemental Figure 4E).
RNA-seq analysis of anti-CD40/IL4-stimulated WT and Pou2af1KO/KO B cells identified 746 DEGs (Figure 5E), which are mainly involved in immune responses (Figure 5F). Gene set enrichment analysis (GSEA) showed that GC signatures are dramatically disrupted when OBF1 is deleted, whereas a number of genes associated with PC differentiation (eg, Slamf7, Tlr7, Cd38, Stat1, and Ccr2) are upregulated (Figure 5G-H). Seven days after sheep red blood cell (SRBC) immunization of mice, GCs formed robustly in WT spleens, and GC B cells (B220+CD43−CD38−CD95+) could be detected by FACS. In contrast, GC B cells were absent from Pou2af1KO/KO spleens (Figure S4F,I). Bio-ChIP-seq of OBF1 in primary murine GC B cells identified OBF1 binding to the regulatory regions of hallmark genes for GCs, such as Bcl6, Foxo1, Aicda, Mef2b, Bach2, and Egr3 (Figure 5J). These results indicate that OBF1 directly regulates the GC transcriptional program and is a master regulator of GCs.
OBF1 controls the proliferation of GC-derived B lymphoma cell by modulating the level of IRF4
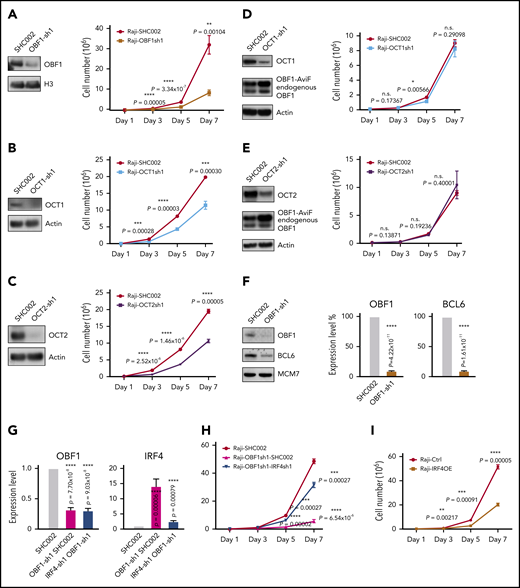
To test the roles of OBF1/OCT1/OCT2 in the context of GCs, these factors were knocked down in Raji, a GC-derived human BL cell line, using shRNAs. The proliferation of Raji cells was strongly reduced upon knockdown of any of these factors, but OBF1 depletion elicited the strongest effect (Figure 6A-6C). Impaired proliferation upon OBF1 knockdown was also observed in other BL and DLBCL lines, such as Ramos, Daudi, HT, and SUDHL4 (supplemental Figure 5A-C,I). Interestingly, OBF1 expression was downregulated when OCT1 or OCT2 was depleted (supplemental Figure 5D-F). Ectopic expression of the nuclear OBF1 isoform in these cells fully rescued proliferation, demonstrating that the defect observed upon OCT1 or OCT2 depletion is due to simultaneous downregulation of OBF1 (Figure 6D-E).
OBF1 is required for the proliferation of GC-derived lymphoma cell lines. (A) Left, immunoblot showing OBF1 knockdown efficiency using shRNA specific for OBF1 (OBF1-sh1) or control (SHC002); histone 3 (H3) is shown as loading control. Right, assessment of proliferation of Raji cell line following shRNA-mediated depletion of OBF1. Cells were seeded at day 1 and counted every second day until day 7 (n = 3). (B) Left, immunoblot of OCT1 demonstrating knockdown efficiency using shRNA specific for OCT1; actin is shown as loading control. Right, assessment of proliferation of Raji cell line following shRNA-mediated depletion of OCT1 (n = 3). (C) Left, immunoblot of OCT2 demonstrating knockdown efficiency using shRNA specific for OCT2; actin is shown as loading control. Right, assessment of proliferation of Raji cell line following shRNA-mediated depletion of OCT2 (n = 3). (D) Left, immunoblot demonstrating knockdown efficiency using shRNA specific for OCT1 and ectopic expression of OBF1 tagged with AviTag and FLAG; actin is shown as loading control. Right, assessment of proliferation of Raji cell line ectopically expressing AviTag-FLAG tagged OBF1 following shRNA-mediated depletion of OCT1 (n = 3). (E) Left, immunoblot demonstrating knockdown efficiency using shRNA specific for OCT2 and ectopic expression of OBF1 tagged with AviTag and FLAG; actin is shown as loading control. Right, assessment of proliferation of Raji cell line ectopically expressing AviTag-FLAG tagged OBF1 following shRNA-mediated depletion of OCT1 (n = 3). (F) Left, immunoblot showing the downregulation of BCL6 upon shRNA-mediated knockdown of OBF1; MCM7 is shown as loading control. Right, qPCR measurements of BCL6 expression upon OBF1 knockdown (same data as shown in supplemental Figure 5E). (G) Left, confirmation of downregulation of OBF1 by shRNA specific for OBF1 by qPCR (n = 4); right, confirmation of downregulation of IRF4 by shRNA specific for IRF4 by qPCR (n = 4). (H) Assessment of Raji cells proliferation following shRNA-mediated depletion of OBF1 and depletion of both OBF1 and IRF4 (n = 3). (I) Assessment of proliferation of Raji cell line following ectopic expression of IRF4. Cells were seeded at day 1 and counted every second day until day 7 (n = 3). Mean ± standard deviation; *P < .05; **P < .01; ***P < .001; ****P < .0001 (2-tailed Student t test).
OBF1 is required for the proliferation of GC-derived lymphoma cell lines. (A) Left, immunoblot showing OBF1 knockdown efficiency using shRNA specific for OBF1 (OBF1-sh1) or control (SHC002); histone 3 (H3) is shown as loading control. Right, assessment of proliferation of Raji cell line following shRNA-mediated depletion of OBF1. Cells were seeded at day 1 and counted every second day until day 7 (n = 3). (B) Left, immunoblot of OCT1 demonstrating knockdown efficiency using shRNA specific for OCT1; actin is shown as loading control. Right, assessment of proliferation of Raji cell line following shRNA-mediated depletion of OCT1 (n = 3). (C) Left, immunoblot of OCT2 demonstrating knockdown efficiency using shRNA specific for OCT2; actin is shown as loading control. Right, assessment of proliferation of Raji cell line following shRNA-mediated depletion of OCT2 (n = 3). (D) Left, immunoblot demonstrating knockdown efficiency using shRNA specific for OCT1 and ectopic expression of OBF1 tagged with AviTag and FLAG; actin is shown as loading control. Right, assessment of proliferation of Raji cell line ectopically expressing AviTag-FLAG tagged OBF1 following shRNA-mediated depletion of OCT1 (n = 3). (E) Left, immunoblot demonstrating knockdown efficiency using shRNA specific for OCT2 and ectopic expression of OBF1 tagged with AviTag and FLAG; actin is shown as loading control. Right, assessment of proliferation of Raji cell line ectopically expressing AviTag-FLAG tagged OBF1 following shRNA-mediated depletion of OCT1 (n = 3). (F) Left, immunoblot showing the downregulation of BCL6 upon shRNA-mediated knockdown of OBF1; MCM7 is shown as loading control. Right, qPCR measurements of BCL6 expression upon OBF1 knockdown (same data as shown in supplemental Figure 5E). (G) Left, confirmation of downregulation of OBF1 by shRNA specific for OBF1 by qPCR (n = 4); right, confirmation of downregulation of IRF4 by shRNA specific for IRF4 by qPCR (n = 4). (H) Assessment of Raji cells proliferation following shRNA-mediated depletion of OBF1 and depletion of both OBF1 and IRF4 (n = 3). (I) Assessment of proliferation of Raji cell line following ectopic expression of IRF4. Cells were seeded at day 1 and counted every second day until day 7 (n = 3). Mean ± standard deviation; *P < .05; **P < .01; ***P < .001; ****P < .0001 (2-tailed Student t test).
RNA-seq analysis of OBF1 knockdown Raji cells (discussed in detail later) showed that BCL6, which is essential to organize the transcriptome of GC B cells and the GC reaction,31 was strongly downregulated (Figures 6F and 7B). Ectopically expressed BCL6 in OBF1-depleted Raji cells failed to restore proliferation (supplemental Figure 5G), indicating that alternative targets of OBF1, other than BCL6, are important. We wondered whether genes governing the post-GC differentiation (ie, exit from GC program) are deregulated when OBF1 is ablated. IRF4 and BLIMP1 (encoded by the PRDM1 gene) are master regulators controlling GC B to PC differentiation.70-72 In absence of OBF1, PRDM1 fails to be upregulated, thus impeding the final stages of antibody-secreting cell development.73 Consistently, PRDM1 was downregulated upon OBF1 knockdown in our RNA-seq data (Figure 7B). IRF4 expression was barely detectable in untreated Raji cells; however, it was elevated more than 10 times upon OBF1 downregulation (Figures 6G and 7B; supplemental Figure 5H). Increased IRF4 impairs proliferation of BL cells and induces their differentiation toward PCs.74 Indeed, Raji proliferation was restored when knocking down these 2 factors simultaneously (Figure 6G-H). We observed the same outcome with SUDHL4 cells (supplemental Figure 5H-I): a DLBCL. This result therefore shows that OBF1 regulates lymphoma proliferation by controlling IRF4 expression. Moreover, ectopic IRF4 expression leads to impaired Raji cell proliferation (Figure 6I), a result that phenocopies the OBF1 knockdown. In summary, OCT1/OCT2/OBF1 are all required to maintain normal proliferation of lymphoma cells: OCT1 and OCT2 control cell proliferation by regulating the expression of OBF1, which itself is essential for controlling the expression of BCL6 and particularly IRF4.
OBF1 is required for the maintenance of the GC transcriptional program. (A) Left, average expression (log2 counts per million, x-axis) and change of expression (log2-fold change, y-axis) for genes in control (SHC002) and OBF1 knockdown (Obf1sh1) conditions. Differentially expressed genes are color-coded (DEG fold change >1.5, FDR <0.001, logCPM >2): red data points represent genes with higher expression level in Raji cells treated with OBF1-specific shRNA; green data points represent genes with higher expression in control-treated (scrambled shRNA sequence) Raji cells. Right, gene ontology analysis was performed with the genes up- and downregulated in OBF1 knockout vs WT splenic B cells stimulated with anti-CD40/IL4. (B) Heatmaps showing differentially expressed genes involved in GC reaction between Raji cells infected with lentivirus expressing control shRNA (SHC002) and OBF1-specific shRNA. (C) GSEA of relative gene expression in OBF1 depleted vs WT Raji cells against the gene set identified as genes upregulated in plasma cells. NES, normalized enrichment score. (D) Average expression (log2 counts per million, x-axis) and change of expression (log2-fold change, y-axis) for genes in WT and ectopically IRF4 expressing Raji cells. Differentially expressed genes are color-coded (DEG fold change ≥1, FDR <0.01, logCPM >2): red data points represent genes with higher expression level in ectopically IRF4-expressing Raji cells, green data points represent genes with higher expression in WT Raji cells. (E) GSEA of relative gene expression in ectopically IRF4-expressing vs WT Raji cells against the differentially expressed genes in OBF1-depleted Raji cells. NES, normalized enrichment score. (F) OBF1 CUT&RUN read densities at 2 individual loci in Raji and SUDHL4 cells. (G) H3K27ac and OBF1 CUT&RUN read densities at 2 individual loci, as indicated, in purified germinal center B cells from human tonsils. (H) GSEA of relative gene expression in OBF1-depleted vs WT Raji cells against the gene set identified as genes associated with favorable prognosis for patients with DLBCL.
OBF1 is required for the maintenance of the GC transcriptional program. (A) Left, average expression (log2 counts per million, x-axis) and change of expression (log2-fold change, y-axis) for genes in control (SHC002) and OBF1 knockdown (Obf1sh1) conditions. Differentially expressed genes are color-coded (DEG fold change >1.5, FDR <0.001, logCPM >2): red data points represent genes with higher expression level in Raji cells treated with OBF1-specific shRNA; green data points represent genes with higher expression in control-treated (scrambled shRNA sequence) Raji cells. Right, gene ontology analysis was performed with the genes up- and downregulated in OBF1 knockout vs WT splenic B cells stimulated with anti-CD40/IL4. (B) Heatmaps showing differentially expressed genes involved in GC reaction between Raji cells infected with lentivirus expressing control shRNA (SHC002) and OBF1-specific shRNA. (C) GSEA of relative gene expression in OBF1 depleted vs WT Raji cells against the gene set identified as genes upregulated in plasma cells. NES, normalized enrichment score. (D) Average expression (log2 counts per million, x-axis) and change of expression (log2-fold change, y-axis) for genes in WT and ectopically IRF4 expressing Raji cells. Differentially expressed genes are color-coded (DEG fold change ≥1, FDR <0.01, logCPM >2): red data points represent genes with higher expression level in ectopically IRF4-expressing Raji cells, green data points represent genes with higher expression in WT Raji cells. (E) GSEA of relative gene expression in ectopically IRF4-expressing vs WT Raji cells against the differentially expressed genes in OBF1-depleted Raji cells. NES, normalized enrichment score. (F) OBF1 CUT&RUN read densities at 2 individual loci in Raji and SUDHL4 cells. (G) H3K27ac and OBF1 CUT&RUN read densities at 2 individual loci, as indicated, in purified germinal center B cells from human tonsils. (H) GSEA of relative gene expression in OBF1-depleted vs WT Raji cells against the gene set identified as genes associated with favorable prognosis for patients with DLBCL.
OBF1 is essential for maintenance of the GC transcriptional program
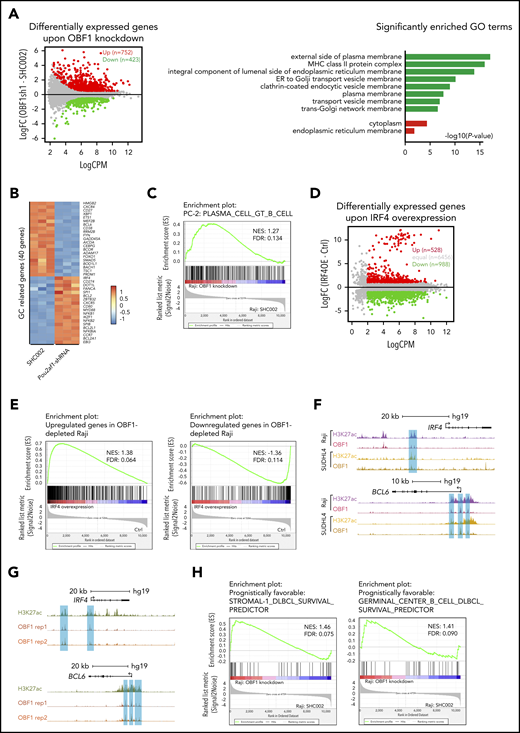
To understand the role of OBF1 in the GC reaction, we performed RNA-seq with WT and OBF1 knockdown Raji cells, identifying 1175 DEGs (Figure 7A). Multiple genes related to GC formation or maintenance were downregulated, including BCOR, BCL6, MEF2B, and FOXO1. CXCR4, which encodes a chemokine receptor important for GCs, was also downregulated. Genes important for somatic hypermutation or DNA repair were downregulated as well, including AICDA (encoding activation induced deaminase), GADD45A, BACH1, CEBPG, BOD1l1, HMGB2, and RRM2B. By contrast, genes involved in post-GC differentiation were upregulated, including IRF4, BCL2L1, NFΚB1, NFΚB2, and ZBTB32 (Figure 7B).
Gene ontology analysis showed that genes associated with protein secretion were enriched upon OBF1 depletion (Figure 7A), indicating that some aspects of PC differentiation are triggered, in agreement with what was observed in anti-CD40/IL4–stimulated Pou2af1KO/KO mouse B cells (Figure 5G). Furthermore, signatures associated with PC differentiation were upregulated in OBF1-depleted Raji cells (Figure 7C), and genes activated by IRF4 or repressed by BCL6 were upregulated (supplemental Figure 6A). These results demonstrate that, in the absence of OBF1, the GC transcriptional program collapses and the PC differentiation program partially initiates. We also found that the transcriptomes of Raji cells with depleted OBF1 and enforced IRF4 expression are highly similar; overall, genes significantly up- or downregulated upon OBF1 depletion also show stronger or weaker expression in Raji cells overexpressing IRF4, respectively (Figure 7D-E).
Next, we assessed the genomic binding of OBF1 in human lymphomas using CUT&RUN assays. OBF1 directly binds to the IRF4 and BCL6 gene loci in both BL (Raji) and DLBCL cells (SUDHL4), thus explaining its aforementioned effects on the transcription of these genes (Figure 7F; supplemental Figure 6B). To examine OBF1 binding under normal physiological conditions, we performed CUT&RUN for OBF1 in primary human GC B cells, obtained from tonsillectomy patients. As shown in Figure 7G and supplemental Figure 6C, OBF1 binds at the enhancers or promoters of genes that are critical for the GC reaction, such as BCL6 and IRF4 among others. Moreover, gene expression signatures associated with favorable prognosis outcomes for lymphoma patients75 are upregulated in OBF1-depleted Raji cells (Figure 7H). Together, these findings further confirm our conclusion that OBF1 maintains the GC transcriptome by activating BCL6 and repressing IRF4. Once OBF1 expression is abrogated, the BCL6 pathway is attenuated, IRF4 expression is elevated, and the GC program collapses while PC differentiation initiates.
Discussion
OBF1 stabilizes the binding of OCT factors
Bio-ChIP-seq revealed the genomic location of OCT1/OCT2/OBF1 to a much greater depth than possible with antibodies (supplemental Figure 1C-D). Previous antibody-based ChIP-seq studies examined the binding of OCT2 only76 or OCT2 and OBF124 in B cells, without appreciating the role of OCT1. We found extensive overlap between OCT1 and OCT2 peaks, and >90% of OBF1 peaks overlapped with either OCT1 or OCT2 peaks, consistent with the notion that this cofactor is recruited by OCT factors. Motif analysis of the different fractions (eg, bound by OBF1 and OCT1, or by OCT1 alone) did not reveal significant differences and the consensus motif for POU domains 5′-ATGCAAAT-3′ or variants thereof were identified at the top of the list. Previous studies performed on selected binding sites had concluded that OBF1 does not or only weakly stabilizes the binding of OCT factors on the DNA.11,13,77 Comparison of OCT1 Bio-ChIP-seq peaks in WT vs OBF1 KO cells conclusively established the stabilization of OCT1 by OBF1. OCT2 could not be examined in a similar manner, as its expression is OBF1-dependent; however, given the high similarity between OCT1 and OCT2, stabilization of OCT2 appears likely. By contrast, PU.1, which often colocalized with OCT1 and OCT2, does not stabilize their binding. Cells lacking OBF1 exhibited reduced H3K27ac levels over the OCT1 peaks compared with WT cells, indicating that OBF1 depletion also affects the structure of chromatin.
Extensive colocalization between Oct factors and ETS factors
De novo motif analysis of the OCT1/OCT2/OBF1 peaks identified, in addition to octamer-related motifs, a high enrichment of ETS motifs. In particular, a PU.1 ChIP-seq study in mature B cells found octamer-like motifs near the PU.1 motifs.76 We found by ChIP-seq that PU.1 colocalizes with a large fraction of the OCT1/OCT2/OBF1 peaks. Prompted by these observations, we compared the transcriptome of B cells from Spi1KO/KO78 and Pou2af1KO/KO mice. However, we found only little overlap in the deregulated genes, indicating that these 2 factors, although often colocalizing, are engaged mostly in separate regulatory pathways. Mapping the motifs of all ETS factors expressed in B cells showed an enrichment for several ETS motifs within the OBF1 peak regions; in addition to PU.1 and ETS1, other ETS factors such as ELK4 or ETV6 were also highly significant statistically (supplemental Figure 2D). Using publicly available ETS1 ChIP-seq data, we found that colocalization is even greater than with PU.1 (supplemental Figure 2B). Thus, OCT1/OCT2/OBF1 colocalize with several ETS factors in B cells and the extent of overlap between these TF networks had not been appreciated. Although the functional relevance of these observations will require further systematic analysis, given the number of different ETS factors involved in colocalization with OCT1/OCT2/OBF1, it seems likely that in some cases these factors will be coregulating their targets.
OBF1 is essential for maintenance of the GC program and post-GC differentiation
BCL6 is a master regulator of the GC reaction,31 and Bcl6KO/KO mice lack GCs.79 Similarly, GCs are missing in Pou2af1KO/KO mice.15-19 These highly similar phenotypes suggested a possible regulatory relationship between these 2 factors. OBF1 and BCL6 are highly coexpressed in dark zone GC B cells and show attenuated expression in the light zone.36,80 IRF4 expression is induced by CD40 signaling in light zone B cells and promotes PC differentiation.27,80,81 The expression of IRF4 is essential to induce OBF1 and BCL6 at pre-GC stage, and repression of IRF4 by BCL6 allows the GC reaction to start.82 Together with our data, this indicates that OBF1 and IRF4 expression are mutually exclusive, and that OBF1 is the key factor regulating the switch between GC reaction and further differentiation. More recently, OBF1 has been reported to regulate BCL6 in CD4+ TFH cells,83 and we have shown here that it directly regulates the BCL6 promoter in primary human and mouse GC B cells. Depletion of OBF1 in GC-derived lymphoma cells leads to reduced BCL6 expression and impaired proliferation. In these OBF1-depleted cells, GSEA showed that GC signatures are lost, whereas PC differentiation signatures are upregulated. Consistently, IRF4 is strongly upregulated when OBF1 is depleted.
The functional role of OBF1 on BCL6 and IRF4 expression seems to be GC-restricted. Indeed, OBF1 and IRF4 are coexpressed in PCs, where both factors are critical for PC differentiation.36,70,73,82 In PCs, IRF4 and BLIMP1 activate XBP1, which in turn induces high OBF1 expression.27,84 Therefore, the coexistence of OBF1 and IRF4 in PCs indicates that OBF1 regulates IRF4 specifically in the GC context: once GC program integrity is lost and the cells have adopted a PC signature, OBF1 is no longer able to regulate IRF4. Likewise, BCL6 is regulated by OBF1 but only in GC B cells, because BCL6 and IRF4 expression was found to be normal in Pou2af1KO/KO splenic cells stimulated in vitro85 (and our data not shown).
OBF1 as a therapeutic target for GC-derived B cell lymphoma
A CRISPR/Cas9 screen identified OBF1 as essential for BL cell lines39 and it is required for maintaining proliferation of GC-derived lymphoma cells.24,38 However, the functional roles of OCT1 and OCT2, and the functional hierarchy of OCT1/OCT2/OBF1 in B-cell lymphomas remained unclear. We found that the proliferation of B-cell lymphoma cells is also strongly impaired when OCT1 or OCT2 is downregulated (Figure 6B-C); however, this leads to a reduction in OBF1 and proliferation is fully rescued when OBF1 expression is restored in these cells. Therefore, OBF1 is the factor critical for the fast proliferation of B-cell lymphomas. Recent studies provide possible functional mechanisms for the importance of OBF1 for lymphoma proliferation. JQ1 blocks BRD4 binding to acetylated chromatin, which results in reduced activity of enhancers or promoters.86 DLBCL proliferation is impaired following JQ1 administration because it abolishes the activity of a superenhancer controlling OBF1 expression.38 Moreover, functional importance has been ascribed to the OCT2-OBF1 interaction interface,24 yet the specific downstream target(s) had not been identified. We demonstrate here that BCL6 and IRF4 are critical targets of OBF1 in BL and DLBCL. Strikingly, ectopic expression of BCL6 failed to rescue the proliferation of OBF1-depleted B lymphoma cells (supplemental Figure 5G). IRF4, a negative regulator of BL proliferation,74 was upregulated when OBF1 is abrogated. Simultaneous knockdown of IRF4 restored the proliferation of OBF1-depleted GC-derived B lymphoma cells. Moreover, OBF1 binds to the majority of GC-related genes, particularly the IRF4 and BCL6 loci (Figure 7F-G). In sum, we demonstrate that OBF1 facilitates the fast proliferation of GC-derived lymphoma cells by repressing IRF4. In addition, lymphoma cells with reduced OBF1 level adopt signatures associated with favorable prognosis, which suggests that OBF1 could serve as a valuable clinical indicator for lymphoma severity classification and prognosis. Therefore, we propose OBF1 to be a novel and potent therapeutic target for lymphoma treatment.
The publication costs of this article were defrayed in part by page charge payment. Therefore, and solely to indicate this fact, this article is hereby marked “advertisement” in accordance with 18 USC section 1734.
Further information and requests for resources and reagents should be directed to Patrick Matthias (patrick.matthias@fmi.ch).
The ChIP-seq and A-seq data reported in this article have been deposited in the Gene Expression Omnibus database (accession number GSE142040).
The online version of this article contains a data supplement.
Acknowledgments
The authors are grateful to M. Busslinger (Research Institute of Molecular Pathology [IMP], Vienna, Austria) for Rosa26BirA/BirA mice, S. Junker (Aarhus University, Aarhus, Denmark) for Ramos cell line, and J. Chao (Friedrich Miescher Institute for Biomedical Research [FMI], Basel, Switzerland) for lentiviral expression plasmids. The authors also thank S. Smallwood and the genomics facility team for help with library preparation and next-generation sequencing of RNA-seq and ChIP-seq samples, J.-F. Spetz for zygote microinjection, H.-R. Hotz for advice with A-seq analysis, J. Wilbertz for advice on lentivirus production, Y. Zhan for comments on the manuscript, D. Finke and G. Aurey (Department of Biomedicine [DBM], University of Basel, Basel, Switzerland) for help with FACS of human GC B cells. In addition, the authors also thank L. Wang, G. Matthias, D. Mayer, M. Flemr, P. Knuckles, T. Kitazawa, P. Bammer, G. Fanourgakis, and all the P.M. laboratory members for their helpful discussions and advice, and Life Science Editors for editing services.
This work was supported by the Novartis Research Foundation.
Authorship
Contribution: S.S. and P.M. designed the project; S.S. performed all experiments, bioinformatics analysis, and interpreted the data for manuscript under the supervision of M.-A.C., M.B.S., and P.M.; S.S. and C.C. maintained all the mouse strains involved in this work; F.T. and G.C. contributed to the design of knockdown experiments; S.S., C.C., and H.K. performed all FACS analyses; S.S. performed all CUT&RUN experiments and sequencing library preparation under the supervision of F.W., B.D.F., and M.F.; S.D. collected human tonsil after tonsillectomy; S.N.W., J.T.J., and S.L.N. provided cultured Spi1KO/KO B cells; S.S. and P.M. wrote the manuscript; and all authors contributed to the final version.
Conflict-of-interest disclosure: B.D.F., F.W., and M.F. are employees and shareholders of Novartis. The remaining authors declare no competing financial interests.
Correspondence: Patrick Matthias, Friedrich Miescher Institute for Biomedical Research, Maulbeerstrasse 66, 4058 Basel, Switzerland; e-mail: patrick.matthias@fmi.ch.

This feature is available to Subscribers Only
Sign In or Create an Account Close Modal