

Key Points
E3 ubiquitin ligase FBXO11 facilitates human erythropoiesis by degrading the heterochromatin-associated protein BAHD1.
FBXO11 degradation of BAHD1 relieves PRC2-mediated transcriptional repression of many erythroid genes.

Abstract
The histone mark H3K27me3 and its reader/writer polycomb repressive complex 2 (PRC2) mediate widespread transcriptional repression in stem and progenitor cells. Mechanisms that regulate this activity are critical for hematopoietic development but are poorly understood. Here we show that the E3 ubiquitin ligase F-box only protein 11 (FBXO11) relieves PRC2-mediated repression during erythroid maturation by targeting its newly identified substrate bromo adjacent homology domain–containing 1 (BAHD1), an H3K27me3 reader that recruits transcriptional corepressors. Erythroblasts lacking FBXO11 are developmentally delayed, with reduced expression of maturation-associated genes, most of which harbor bivalent histone marks at their promoters. In FBXO11−/− erythroblasts, these gene promoters bind BAHD1 and fail to recruit the erythroid transcription factor GATA1. The BAHD1 complex interacts physically with PRC2, and depletion of either component restores FBXO11-deficient erythroid gene expression. Our studies identify BAHD1 as a novel effector of PRC2-mediated repression and reveal how a single E3 ubiquitin ligase eliminates PRC2 repression at many developmentally poised bivalent genes during erythropoiesis.
Introduction
Hematopoiesis is directed by chromatin-modifying enzymes and transcription factors that activate cell type–specific genes and repress those of alternate lineages. The mechanisms that drive these activities are not fully defined. Here we focus on erythropoiesis, a process that normally produces ~100 billion new red blood cells (RBCs) daily. Erythropoiesis is initiated by the differentiation of hematopoietic stem cells into lineage-committed erythroid progenitors that subsequently undergo specialized maturation to form RBCs, which are notable for their highly restricted proteomes, with 98% of the cytosolic proteins being hemoglobin.1-3 Gene expression during erythropoiesis is controlled by several lineage-restricted master transcription factors, including GATA1, KLF1, and TAL1.4-7 Protein degradation pathways also play prominent roles in RBC development.1-3 Indeed, the E1-E2-E3 ubiquitin ligation cascade was first discovered in reticulocytes, which undergo massive protein remodeling.8
Several E3 ligases participate in early erythropoiesis by regulating cell division, iron metabolism, and p53 stability.9-13 The deubiquitinase USP7 stabilizes GATA1 protein.14 We and others have identified E3 ubiquitin ligases that regulate reticulocyte maturation by eliminating unnecessary proteins.1-3 However, hundreds of ubiquitin ligases, mostly of unknown function, are expressed across erythropoiesis. In a CRISPR single-guide RNA (sgRNA) screen that examined all ubiquitin-proteasome system (UPS) components during erythropoiesis, we discovered that F-box only protein 11 (FBXO11), a specific substrate receptor for the SKP1–CULLIN1–F-box (SCF) family of E3 ubiquitin ligase complexes,15 is a master regulator of erythroid gene transcription and development. Specifically, we show that FBXO11 activates erythroid genes by mediating proteolysis of bromo adjacent homology domain–containing 1 (BAHD1),16,17 a heterochromatin-associated protein that recruits corepressors to H3K27me3 marks. Moreover, BAHD1 interacts genetically, functionally, and physically with the polycomb repressive complex 2 (PRC2) repressor complex. Loss of BAHD1 or PRC2 core components at erythroid gene promoters is associated with the elimination of H3K27me3 marks, an open chromatin state, enhanced GATA1 occupancy, and high-level gene expression. The newly discovered FBXO11-BAHD1 axis links the UPS with regulation of the polycomb pathway and cell fate during erythropoiesis and perhaps more broadly.
Materials and methods
Routine protocols are described in detail in supplemental Methods, available on the Blood Web site.
CRISPR/Cas9 screens for ubiquitin-proteasome or epigenetic components that facilitate erythroid maturation
A pooled lentiviral vector library encoding 3143 sgRNAs targeting 776 genes that encode ubiquitin ligases, accessory proteins, and deubiquitinases was generated in the pXPR_003 vector18 by using the Broad Institute Genetic Perturbation Platform. A lentiviral vector library encoding 5080 sgRNAs targeting 496 epigenetic modifier genes was purchased from Transomic Technologies (CAHV9002). Approximately 1 × 10⁷ HUDEP-2 cells stably expressing Cas9 were transduced at a multiplicity of infection of ∼0.3 to minimize the introduction of >1 vector particles and to achieve an ∼1000-fold library coverage. After 24 hours, transduced cells were selected in puromycin (1 µg/mL) for 2 days, then maintained in expansion medium for 4 to 8 days. Half the culture was switched to differentiation medium for 5 days. Erythroid maturation was monitored by flow cytometry using fluorescein isothiocyanate–conjugated anti-CD235a (clone GA-R2; BD Biosciences) and allophycocyanin-conjugated anti-Band3 (gift from Xiuli An, New York Blood Center, New York, NY). Band3+ and Band3– cell populations from the CD235a+ cell fraction were purified by fluorescence-activated cell sorting. The representation of lentiviral vector-encoded sgRNAs in Band3+ and Band3– populations was determined by next-generation sequencing and compared. Similarly, sgRNA representation was compared in HUDEP-2 cells before and after 8 days of growth in expansion medium.
Results
Identification of ubiquitin-proteasome components that regulate erythropoiesis
Hundreds of messenger RNAs (mRNAs) encoding UPS components are expressed at specific developmental stages of human erythropoiesis (supplemental Figure 1A). We screened for functional UPS genes in HUDEP-2 cells, an immortalized human cell line that proliferates as immature erythroid precursors and can be induced to undergo terminal maturation.19 Cells stably expressing Cas9 were transduced with a pooled lentiviral vector library encoding 3143 sgRNAs targeting 776 UPS genes and control genes (Figure 1A; supplemental Figure 1B-C; supplemental Table 1). Transduced cells were induced to undergo terminal maturation and then fractionated according to expression of the late-stage erythroid marker Band3. In parallel, pooled transduced cells were expanded in an immature state for 8 days.
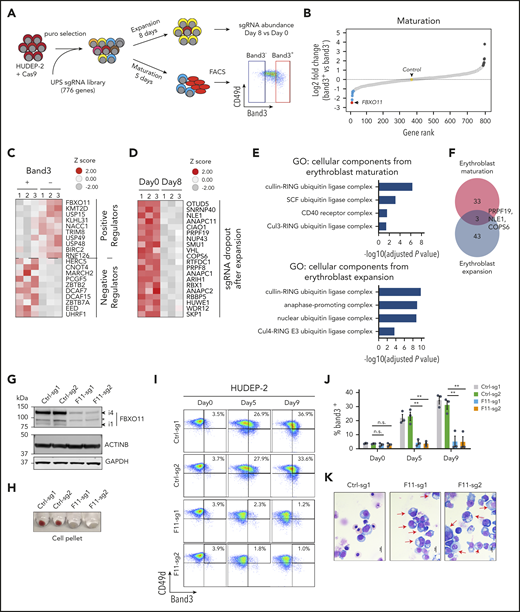
Identification of UPS genes that regulate erythropoiesis. (A) Experimental scheme. Cas9-expressing HUDEP-2 erythroblasts were transduced with a lentiviral vector library encoding sgRNAs targeting 776 UPS genes (supplemental Table 1) selected in puromycin, expanded, and cultured under conditions promoting expansion or terminal maturation. For the latter, mature (Band3+) and immature (Band3–) cells were purified by fluorescence-activated cell sorting (FACS) and analyzed by deep sequencing to compare sgRNA representation (panels B-C). Expansion-related genes were identified by comparing sgRNA representation in cells grown in culture for 0 or 8 days in expansion medium (panel D). (B) Differential representation of sgRNAs in immature vs mature erythroblasts. Each dot indicates a single gene ranked according to the relative sgRNA abundance (log2 fold change in Band3+ vs Band3– was an average of 4 sgRNAs per gene in 3 biological replicate experiments). Dots indicate the top 10 genes corresponding to underrepresented (blue) or overrepresented (black) sgRNAs in Band3+ erythroblasts. The yellow dot represents the average value of 19 control nontargeting sgRNAs (see also supplemental Table 2). (C) Heat map of the most differentially represented sgRNAs in mature (Band3+) vs immature (Band3–) erythroblasts (an average of 4 sgRNAs per gene in 3 biological replicate experiments). Genes corresponding to over- or underrepresented sgRNAs correspond to positive and negative regulators of erythroid maturation, respectively. (D) Heat map showing the differential representation of sgRNAs for genes that promote HUDEP-2 erythroblast expansion. The data represent the average of 4 different sgRNAs for each gene in 3 biological replicate experiments. Genes corresponding to the 20 most depleted sgRNA sets after 8 days of growth in expansion medium are shown. (E) Gene Ontology (GO) enrichment analysis of genes identified by CRISPR screening as positively regulating HUDEP-2 cell maturation or expansion. The enriched GO terms are listed on the left, with the corresponding −log10 adjusted P values shown in the graph. (F) Overlap between genes predicted to promote HUDEP-2 cell expansion or maturation. (G-K) Immature Cas9-expressing HUDEP-2 erythroblasts were transduced with lentiviral vectors encoding FBXO11 sgRNAs (F11-sg) or control sgRNAs (Ctrl), selected with puromycin, and expanded for 5 to 9 days. (G) Western blot showing FBXO11 protein expression. Bands labeled i1 and i4 indicate isoforms FBXO11-4 and FBXO11-1, as described previously.20 The asterisk indicates a nonspecific band. (H) Cell pellets at day 5 of induced erythroid maturation. (I) Flow cytometry plots showing Band3 and CD49d expression at the indicated time points after induced erythroid maturation. (J) Summary of Band3 expression in multiple experiments performed as in panel I. Bars indicate the mean ± standard error of the mean (SEM) from 4 biological replicate experiments. (K) May-Grünwald-Giemsa–stained cells at maturation day 7. Red arrows indicate immature erythroblasts. Scale bar, 10 μm. **P < .01 (unpaired Student t test); n.s., not significant.
Identification of UPS genes that regulate erythropoiesis. (A) Experimental scheme. Cas9-expressing HUDEP-2 erythroblasts were transduced with a lentiviral vector library encoding sgRNAs targeting 776 UPS genes (supplemental Table 1) selected in puromycin, expanded, and cultured under conditions promoting expansion or terminal maturation. For the latter, mature (Band3+) and immature (Band3–) cells were purified by fluorescence-activated cell sorting (FACS) and analyzed by deep sequencing to compare sgRNA representation (panels B-C). Expansion-related genes were identified by comparing sgRNA representation in cells grown in culture for 0 or 8 days in expansion medium (panel D). (B) Differential representation of sgRNAs in immature vs mature erythroblasts. Each dot indicates a single gene ranked according to the relative sgRNA abundance (log2 fold change in Band3+ vs Band3– was an average of 4 sgRNAs per gene in 3 biological replicate experiments). Dots indicate the top 10 genes corresponding to underrepresented (blue) or overrepresented (black) sgRNAs in Band3+ erythroblasts. The yellow dot represents the average value of 19 control nontargeting sgRNAs (see also supplemental Table 2). (C) Heat map of the most differentially represented sgRNAs in mature (Band3+) vs immature (Band3–) erythroblasts (an average of 4 sgRNAs per gene in 3 biological replicate experiments). Genes corresponding to over- or underrepresented sgRNAs correspond to positive and negative regulators of erythroid maturation, respectively. (D) Heat map showing the differential representation of sgRNAs for genes that promote HUDEP-2 erythroblast expansion. The data represent the average of 4 different sgRNAs for each gene in 3 biological replicate experiments. Genes corresponding to the 20 most depleted sgRNA sets after 8 days of growth in expansion medium are shown. (E) Gene Ontology (GO) enrichment analysis of genes identified by CRISPR screening as positively regulating HUDEP-2 cell maturation or expansion. The enriched GO terms are listed on the left, with the corresponding −log10 adjusted P values shown in the graph. (F) Overlap between genes predicted to promote HUDEP-2 cell expansion or maturation. (G-K) Immature Cas9-expressing HUDEP-2 erythroblasts were transduced with lentiviral vectors encoding FBXO11 sgRNAs (F11-sg) or control sgRNAs (Ctrl), selected with puromycin, and expanded for 5 to 9 days. (G) Western blot showing FBXO11 protein expression. Bands labeled i1 and i4 indicate isoforms FBXO11-4 and FBXO11-1, as described previously.20 The asterisk indicates a nonspecific band. (H) Cell pellets at day 5 of induced erythroid maturation. (I) Flow cytometry plots showing Band3 and CD49d expression at the indicated time points after induced erythroid maturation. (J) Summary of Band3 expression in multiple experiments performed as in panel I. Bars indicate the mean ± standard error of the mean (SEM) from 4 biological replicate experiments. (K) May-Grünwald-Giemsa–stained cells at maturation day 7. Red arrows indicate immature erythroblasts. Scale bar, 10 μm. **P < .01 (unpaired Student t test); n.s., not significant.
Next-generation sequencing of DNA from transduced cells identified sgRNA expression cassettes that were underrepresented in mature Band3+ vs immature Band3– erythroblasts, representing candidate genes that facilitate erythroid maturation (Figure 1B-C; supplemental Table 2). Conversely, sgRNA sequences overrepresented in Band3+ cells represent potential negative regulators of maturation. Sequences with reduced representation after 8 days under expansion conditions represent proteins required for the survival and/or proliferation of immature erythroblasts (Figure 1D; supplemental Figure 1D; supplemental Table 3). Gene Ontology analysis of the 36 significant positive regulators of maturation showed enrichment for SCF ubiquitin ligase complex proteins (Figure 1E). Numerous genes encoding general components of this complex (SKP1, RBX1, ARIH1, and COPS6) and anaphase-promoting complex components (ANAPC11, ANAPC1, and ANAPC2) were required for erythroblast expansion (Figure 1E). There was minimal overlap between identified regulators of maturation and expansion (Figure 1F). The FBXO11 gene, which encodes a substrate receptor for the SCF ubiquitin ligase complex, exhibited the strongest signal for erythroid maturation but was not required for cell expansion (Figure 1B; supplemental Figure 1D).
FBXO11 regulates human erythropoiesis but not myelopoiesis or megakaryopoiesis
Lentiviral vector expression of Cas9 and 2 separate FBXO11 sgRNAs in pooled HUDEP-2 cells resulted in more than 95% targeted insertion/deletion mutations (supplemental Figure 2A) with reduced FBXO11 protein expression (Figure 1G) and impaired erythroid maturation, as evidenced by diminished hemoglobinization (Figure 1H), decreased Band3 expression (Figure 1I-J), and immature cell morphology (Figure 1K). HUDEP-2 cells expressing FBXO11 sgRNAs proliferated normally under expansion conditions but failed to undergo growth arrest during induced maturation (supplemental Figure 2B). We observed similar abnormalities in 2 HUDEP-2 clones harboring biallelic FBXO11 deletions and no detectable FBXO11 protein (F11KO #1-2) (supplemental Figure 2C-E). Enforced expression of FBXO11 complementary cDNA in FBXO11 knockout (KO) lines caused cell death, indicating that supraphysiological expression is deleterious.
We used lentiviral vectors to express FBXO11 or control short hairpin RNAs (shRNAs) in normal donor peripheral blood CD34+ hematopoietic stem and progenitor cells (HSPCs), followed by culture under erythroid differentiation conditions. Compared with the control shRNA, both FBXO11 shRNAs caused reduced FBXO11 expression (Figure 2A; supplemental Figure 3A) and inhibited erythroid maturation (Figure 2B-E). Similarly, transduction of umbilical cord blood CD34+ HSPCs with lentiviral vectors encoding FBXO11 shRNA (Figure 2F; supplemental Figure 3A), or Cas9-mediated disruption of the FBXO11 gene in peripheral blood CD34+ HSPCs (supplemental Figure 3B-E), inhibited their erythroid maturation. FBXO11 depletion did not alter myeloid or megakaryocytic differentiation of peripheral blood CD34+ HSPCs (Figure 2G-H; supplemental Figure 3F-G). FBXO11 shRNA expressed in peripheral blood CD34+ cells inhibited the formation of burst-forming unit–erythroid colonies by 58% but did not affect the formation of myeloid or mixed-lineage colonies (Figure 2I). The FBXO11 gene is upregulated during erythropoiesis and is occupied by GATA1, KLF1, and TAL1 (supplemental Figure 4A-B), consistent with a developmentally regulated function in erythroid maturation. Together, these findings indicate that FBXO11 is required for normal human erythropoiesis.

FBXO11 regulates human erythropoiesis. Peripheral blood–mobilized human CD34+ cells (A-E,G-I) were expanded for 2 days and then transduced with lentiviral vectors encoding green fluorescent protein (GFP) and FBXO11 (F11-sh) or control (Ctrl) shRNAs. At day 4, FACS-purified GFP+ cells were cultured under conditions supporting erythroid (A-F), myeloid (G), megakaryocyte (H), or multilineage (I) differentiation. (A) Western blot showing FBXO11 protein expression at culture day 10. The asterisk denotes a nonspecific band. The number below shows quantification of the major isoform of FBXO11 (i4) normalized to GAPDH protein for each condition. (B) Flow cytometry plots showing the expression of the erythroid marker CD235a at culture day 7. The graph shows the mean ± SEM from 4 biological replicate experiments. (C) Flow cytometry plots showing the expression of Band3 and CD49d at culture days 10 and 14. The graph shows the mean ± SEM from 4 biological replicate experiments. (D) Cell pellets at day 10. (E) May-Grünwald-Giemsa–stained erythroblasts at day 14. Red arrows denote immature erythroblasts. Scale bar, 10 μM. (F) Umbilical cord blood (UCB) CD34+ cells expressing FBXO11 (F11-sh) or Ctrl shRNAs were cultured in erythroid cytokines. Graphs show the fraction of cells expressing CD235a or Band3 (mean ± SEM) at the indicated time points in 3 biological replicate experiments. (G) Peripheral blood CD34+ cells expressing FBXO11 (F11-sh) or Ctrl shRNAs were cultured with myeloid cytokines. Flow cytometry plots show the expression of CD11b and CD33 at culture day 14. The graph shows the mean ± SEM from 3 biological replicate experiments. (H) Peripheral blood CD34+ cells expressing FBXO11 (F11-sh) or Ctrl shRNAs were cultured with megakaryocytic cytokines. Flow cytometry plots show the expression of CD41a and CD42b at day 7. The graph shows the mean ± SEM from 3 biological replicate experiments. (I) A total of 300 peripheral blood CD34+ cells expressing Ctrl or F11-sh2 shRNA were suspended in 1 mL of methylcellulose containing multilineage cytokines. Hematopoietic colonies were enumerated after 14 days. The graph shows the mean ± SEM from 3 replicate experiments. BFU-E, burst-forming unit-erythroid; CFE-E, colony-forming unit-erythroid; GEMM, granulocyte, erythroid, macrophage, megakaryocyte; GM, granulocyte macrophage. *P < .05; **P < .01; ***P < .001; ****P < .0001 relative to shRNA luciferase (shLuc) (unpaired Student t test).
FBXO11 regulates human erythropoiesis. Peripheral blood–mobilized human CD34+ cells (A-E,G-I) were expanded for 2 days and then transduced with lentiviral vectors encoding green fluorescent protein (GFP) and FBXO11 (F11-sh) or control (Ctrl) shRNAs. At day 4, FACS-purified GFP+ cells were cultured under conditions supporting erythroid (A-F), myeloid (G), megakaryocyte (H), or multilineage (I) differentiation. (A) Western blot showing FBXO11 protein expression at culture day 10. The asterisk denotes a nonspecific band. The number below shows quantification of the major isoform of FBXO11 (i4) normalized to GAPDH protein for each condition. (B) Flow cytometry plots showing the expression of the erythroid marker CD235a at culture day 7. The graph shows the mean ± SEM from 4 biological replicate experiments. (C) Flow cytometry plots showing the expression of Band3 and CD49d at culture days 10 and 14. The graph shows the mean ± SEM from 4 biological replicate experiments. (D) Cell pellets at day 10. (E) May-Grünwald-Giemsa–stained erythroblasts at day 14. Red arrows denote immature erythroblasts. Scale bar, 10 μM. (F) Umbilical cord blood (UCB) CD34+ cells expressing FBXO11 (F11-sh) or Ctrl shRNAs were cultured in erythroid cytokines. Graphs show the fraction of cells expressing CD235a or Band3 (mean ± SEM) at the indicated time points in 3 biological replicate experiments. (G) Peripheral blood CD34+ cells expressing FBXO11 (F11-sh) or Ctrl shRNAs were cultured with myeloid cytokines. Flow cytometry plots show the expression of CD11b and CD33 at culture day 14. The graph shows the mean ± SEM from 3 biological replicate experiments. (H) Peripheral blood CD34+ cells expressing FBXO11 (F11-sh) or Ctrl shRNAs were cultured with megakaryocytic cytokines. Flow cytometry plots show the expression of CD41a and CD42b at day 7. The graph shows the mean ± SEM from 3 biological replicate experiments. (I) A total of 300 peripheral blood CD34+ cells expressing Ctrl or F11-sh2 shRNA were suspended in 1 mL of methylcellulose containing multilineage cytokines. Hematopoietic colonies were enumerated after 14 days. The graph shows the mean ± SEM from 3 replicate experiments. BFU-E, burst-forming unit-erythroid; CFE-E, colony-forming unit-erythroid; GEMM, granulocyte, erythroid, macrophage, megakaryocyte; GM, granulocyte macrophage. *P < .05; **P < .01; ***P < .001; ****P < .0001 relative to shRNA luciferase (shLuc) (unpaired Student t test).
FBXO11 mediates the degradation of BAHD1 protein
To investigate how FBXO11 regulates erythropoiesis, we compared the proteomes and transcriptomes of FBXO11 KO and wild-type (WT) HUDEP-2 cells (Figure 3A-E; supplemental Table 4). Principal component analysis of transcriptomes revealed similar developmental stage distributions of FBXO11 KO and WT cells cultured under expansion conditions (supplemental Figure 5A). However, the KO erythroblasts exhibited reduced expression of GATA-1–activated genes related to erythroid maturation (Figure 3A-B) and increased expression of T-cell and HSPC genes (Figure 3A-C). Proteomic analysis identified 9822 proteins from 8089 genes, representing 55.2% of the proteome, based on 14 642 detected RNA transcripts and the assumption that all detected RNA species are translated into proteins. We hypothesized that FBXO11 substrate proteins targeted for degradation might be increased by FBXO11 KO, with unchanged corresponding mRNAs (Figure 3D-E). Previously identified FBXO11 substrate proteins BCL6, SNAIL1, and BLIMP1 (PRDM1)15,21,22 were not detected, and their mRNAs were minimally expressed (<1 transcript per million). Expression of the FBXO11 substrate CDT220,23 increased slightly in FBXO11 KO cells (Figure 3D-E). The loss of FBXO11 did not alter the levels of erythroid transcription factors GATA1, KLF1, or TAL1 (Figure 3D-E).
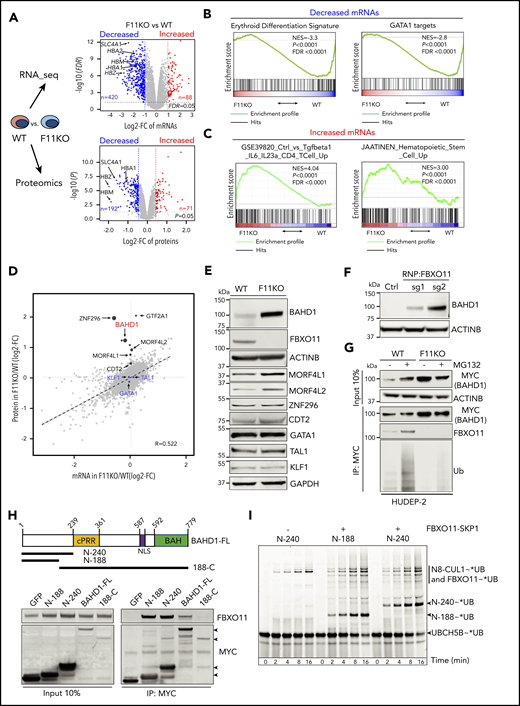
FBXO11 binds, ubiquitinates, and destabilizes BAHD1. (A) Quantitative transcriptome (top graph, 14 642 mRNAs) and proteome (bottom graph, 9822 proteins) comparisons of WT and FBXO11 KO (F11KO, panel G) HUDEP-2 cell pools. Each dot represents a single gene (average values: WT, 4 biological replicates; F11KO, 3 biological replicates each for FBXO11, sgRNA1, and sgRNA2). The x-axis shows the log2 fold change (FC) in expression. The y-axis shows the –log10P value. Selected erythroid genes are highlighted. (B) Gene set enrichment analysis (GSEA) of mRNAs that are downregulated in F11KO vs WT cells, showing enrichment for erythroid differentiation markers24 and erythroid GATA1 targets.25 (C) GSEA of mRNAs that are upregulated in F11KO vs WT cells, showing enrichment for T-cell and hematopoietic stem/progenitor cell markers. (D) Integrative analysis of quantitative proteomics (9822 proteins) and RNA-seq (14 642 mRNAs) comparisons of WT and F11KO HUDEP-2 cell pools grown in culture under expansion conditions. Each dot represents the average value for 1 gene or protein (from 4 biological replicates for WT; 6 for F11KO cells). The erythroid transcription factors GATA1, KLF1, and TAL1 are indicated in blue. Potential FBXO11 substrates were identified as those with a ≥1.6-fold increase in protein expression (log2 FC ≥0.7; P < .05) and a minimal change in the corresponding mRNA (log2 FC ≤0.5) (see supplemental Methods). The size of the black dot represents the relative P value in quantitative proteome analysis (see supplemental Table 4). (E) Western blot showing the expression of selected proteins identified in panel D. (F) Western blot showing BAHD1 expression in primary erythroblasts derived from CD34+ cells electroporated with ribonucleoprotein containing Cas9 and control (Ctrl) or FBXO11 sgRNAs. (G) WT and F11KO HUDEP-2 cells (clone F11KO #2) stably expressing BAHD1-MYC were treated with MG132 or vehicle, immunoprecipitated (IP) with anti-MYC antibody, and analyzed by western blotting. The input lanes represent 10% of the immunoprecipitated sample. (H) Primary structure of full-length (FL) BAHD1, showing the central proline-rich region (cPRR), nuclear localization signal (NLS), and bromo-adjacent homology domain (BAH). N- and C-terminal truncated mutants are shown below. Plasmids encoding MYC-tagged versions of BAHD1 or GFP were transfected into 293T cells. After 48 hours, cell lysates were immunoprecipitated with anti-MYC antibody, and western blot analysis was performed with anti-FBXO11 or anti-MYC antibodies. The input lanes represent 10% of the immunoprecipitated sample. (I) The ubiquitin-activating enzyme UBA1 was incubated with fluorescent-tagged ubiquitin and E2 ligase UBCH5B to form the intermediate UBCH5B∼UB (ubiquitin). The indicated recombinant BAHD1 N-terminal fragments were preincubated with NEDD8∼CUL1 ± SKP1-FBXO11, followed by the addition of UBCH5B∼UB. At the indicated time points, aliquots were quenched by adding sodium dodecyl sulfate-polyacrylamide gel electrophoresis (SDS-PAGE) sample buffer and fractionated on a 4% to 12% SDS-polyacrylamide gradient gel. Fluorescent UB was visualized by scanning on a Typhoon imager (GE). FDR, false discovery rate; NES, normalized enrichment score.
FBXO11 binds, ubiquitinates, and destabilizes BAHD1. (A) Quantitative transcriptome (top graph, 14 642 mRNAs) and proteome (bottom graph, 9822 proteins) comparisons of WT and FBXO11 KO (F11KO, panel G) HUDEP-2 cell pools. Each dot represents a single gene (average values: WT, 4 biological replicates; F11KO, 3 biological replicates each for FBXO11, sgRNA1, and sgRNA2). The x-axis shows the log2 fold change (FC) in expression. The y-axis shows the –log10P value. Selected erythroid genes are highlighted. (B) Gene set enrichment analysis (GSEA) of mRNAs that are downregulated in F11KO vs WT cells, showing enrichment for erythroid differentiation markers24 and erythroid GATA1 targets.25 (C) GSEA of mRNAs that are upregulated in F11KO vs WT cells, showing enrichment for T-cell and hematopoietic stem/progenitor cell markers. (D) Integrative analysis of quantitative proteomics (9822 proteins) and RNA-seq (14 642 mRNAs) comparisons of WT and F11KO HUDEP-2 cell pools grown in culture under expansion conditions. Each dot represents the average value for 1 gene or protein (from 4 biological replicates for WT; 6 for F11KO cells). The erythroid transcription factors GATA1, KLF1, and TAL1 are indicated in blue. Potential FBXO11 substrates were identified as those with a ≥1.6-fold increase in protein expression (log2 FC ≥0.7; P < .05) and a minimal change in the corresponding mRNA (log2 FC ≤0.5) (see supplemental Methods). The size of the black dot represents the relative P value in quantitative proteome analysis (see supplemental Table 4). (E) Western blot showing the expression of selected proteins identified in panel D. (F) Western blot showing BAHD1 expression in primary erythroblasts derived from CD34+ cells electroporated with ribonucleoprotein containing Cas9 and control (Ctrl) or FBXO11 sgRNAs. (G) WT and F11KO HUDEP-2 cells (clone F11KO #2) stably expressing BAHD1-MYC were treated with MG132 or vehicle, immunoprecipitated (IP) with anti-MYC antibody, and analyzed by western blotting. The input lanes represent 10% of the immunoprecipitated sample. (H) Primary structure of full-length (FL) BAHD1, showing the central proline-rich region (cPRR), nuclear localization signal (NLS), and bromo-adjacent homology domain (BAH). N- and C-terminal truncated mutants are shown below. Plasmids encoding MYC-tagged versions of BAHD1 or GFP were transfected into 293T cells. After 48 hours, cell lysates were immunoprecipitated with anti-MYC antibody, and western blot analysis was performed with anti-FBXO11 or anti-MYC antibodies. The input lanes represent 10% of the immunoprecipitated sample. (I) The ubiquitin-activating enzyme UBA1 was incubated with fluorescent-tagged ubiquitin and E2 ligase UBCH5B to form the intermediate UBCH5B∼UB (ubiquitin). The indicated recombinant BAHD1 N-terminal fragments were preincubated with NEDD8∼CUL1 ± SKP1-FBXO11, followed by the addition of UBCH5B∼UB. At the indicated time points, aliquots were quenched by adding sodium dodecyl sulfate-polyacrylamide gel electrophoresis (SDS-PAGE) sample buffer and fractionated on a 4% to 12% SDS-polyacrylamide gradient gel. Fluorescent UB was visualized by scanning on a Typhoon imager (GE). FDR, false discovery rate; NES, normalized enrichment score.
The levels of BAHD1, MORF4L1, and MORF4L2 proteins were increased in FBXO11 KO HUDEP-2 cells with no alterations in the corresponding mRNAs (Figure 3D-E; supplemental Figure 5B). In 293T cells, FBXO11 coimmunoprecipitated with BAHD1, but not with MORF4L1 or MORF4L2 (supplemental Figure 5C-D). BAHD1 protein accumulated in erythroblasts derived from FBXO11-disrupted peripheral blood CD34+ cells (Figure 3F). In WT CD34+ cell-derived erythroblasts and HUDEP-2 cells, BAHD1 expression declined during terminal maturation (supplemental Figure 5E-F). The loss of FBXO11 stabilized BAHD1 in immature proliferating HUDEP-2 cells (supplemental Figure 5G). We obtained similar findings by using an anti-V5 antibody to detect endogenous BAHD1 fused to a carboxyl-terminal V5 epitope tag (supplemental Figure 5H). In WT erythroblasts, BAHD1 was detected as an ∼100-kDa nuclear-enriched protein, as reported in HEK293 cells16 (supplemental Figure 5I). After FBXO11 disruption, BAHD1 levels were increased in the cytoplasm, nucleus, and the insoluble chromatin-enriched nuclear fraction (supplemental Figure 5I).
We utilized WT HUDEP-2 cells expressing MYC-tagged BAHD1 to study its interactions with FBXO11 (Figure 3G). Endogenous FBXO11 immunoprecipitated with BAHD1-MYC, with ubiquitinated forms appearing after proteasomal inhibition. Loss of FBXO11 reduced the ubiquitination of BAHD1-MYC and increased its steady-state level. Conversely, overexpression of WT FBXO11, but not of 2 ubiquitination-defective mutants, reduced the expression of BAHD1-MYC in 293T cells (supplemental Figure 5J). Deletion mapping showed that the amino N-terminal 188 amino acids of BAHD1 are necessary and sufficient to mediate its interaction with FBXO11 (Figure 3H). We tested whether 2 purified recombinant N-terminal BAHD1 fragments could be ubiquitinated by a recombinant SCFFBXO11 complex and the E2-conjugating enzyme UBCH5B/UBE2D2 (Figure 3I; supplemental Figure 5K). Both BAHD1 fragments were robustly modified with ubiquitin when SKP1-FBXO11 was present. Further deletional mapping did not identify a single BAHD1 motif required for its in vitro ubiquitination, perhaps because multiple noncontiguous regions mediate the interaction with FBXO11. Regardless, our results provide evidence that FBXO11 binds and ubiquitinates BAHD1 to promote its proteasomal degradation during erythropoiesis.
FBXO11 activates erythroid gene expression by degrading BAHD1
The suppression of BAHD1 by gene-specific shRNAs or Cas9-sgRNAs in FBXO11 KO HUDEP-2 cells partially relieved the maturation defect (Figure 4A-C and supplemental Figure 6A-C). Similarly, erythroid maturation was rescued in an FBXO11−/− HUDEP-2 clone by introducing biallelic loss-of-function BAHD1 mutations (supplemental Figure 6D-F). In contrast, shRNA-mediated reduction of MORF4L1, MORF4L2, or CDT2 did not restore erythroid maturation in FBXO11 KO cells (supplemental Figure 6G-H). Thus, FBXO11 promotes erythroid maturation by destabilizing BAHD1. Failure of BAHD1 suppression to fully rescue the effects of FBXO11 loss may be a result of the limitations of our experimental system and/or the accumulation of additional FBXO11 target proteins that inhibit erythroid maturation.
![FBXO11 activates erythroid gene expression by degrading BAHD1. (A) WT and FBXO11 KO (clone F11KO #2; supplemental Figure 2C) HUDEP-2 cells were treated with Cas9 plus BAHD1 or control (Ctrl) sgRNAs and analyzed for erythroid markers after 5 days of induced maturation. The graph shows the mean ± SEM from 3 biological replicate experiments. (B) Cell pellets from FBXO11 KO HUDEP-2 cells that were treated with Cas9 + BAHD1 or Ctrl sgRNAs after 5 days of induced maturation. (C) WT and F11KO HUDEP-2 cells expressing BAHD1 or Ctrl shRNAs were analyzed as described for panel A. (D) Comparison of transcriptomes in F11KO HUDEP-2 cells expressing BAHD1 vs control (Ctrl) shRNA. The graph at left shows differential gene expression as described for Figure 3A. The right panels show the results of GSEA. (E) Heat map showing erythroid genes whose expression was decreased in F11KO vs WT HUDEP-2 cells (>twofold; false discovery rate [FDR], <0.05) and upregulated by the expression of BAHD1 shRNA (B1-sh1) in F11KO cells (>twofold; FDR, <0.1). *P < .05; **P < .01; ***P < .001 (unpaired Student t test).](https://ash.silverchair-cdn.com/ash/content_public/journal/blood/137/2/10.1182_blood.2020007809/4/m_bloodbld2020007809f4.png?Expires=1767703025&Signature=tHn71~MtV8nnyUf9hWfsBeGnmJ-7gvJcZztJTR4R5fiJtoIBjpL6oJnpGqk3BdnC0WaYNn5amVHkO6PWfL7oVs6xR-4xXQgpJzV4ZUVNxjddG67ivk9KYFUYCml9a0Y67B277XXKO4LWjixADyVeLrVYidL0cDocq8u1~OnZz4~eew87NmfCv2svVmWeAGGtroyCr4LxSCsG2-RYx9ZqJXnwxVhFwLDzDc0l3PAdCWXky9HTnsEWiJwkI7R6MZf7su5sLB1EdKUbempOLA9MIOV4NLDDcdHWGzeQXafPKV0SBP2pmxQZ5kf1kgQ7S2PZTP8sX8INtRN731YYS2rVsQ__&Key-Pair-Id=APKAIE5G5CRDK6RD3PGA)
FBXO11 activates erythroid gene expression by degrading BAHD1. (A) WT and FBXO11 KO (clone F11KO #2; supplemental Figure 2C) HUDEP-2 cells were treated with Cas9 plus BAHD1 or control (Ctrl) sgRNAs and analyzed for erythroid markers after 5 days of induced maturation. The graph shows the mean ± SEM from 3 biological replicate experiments. (B) Cell pellets from FBXO11 KO HUDEP-2 cells that were treated with Cas9 + BAHD1 or Ctrl sgRNAs after 5 days of induced maturation. (C) WT and F11KO HUDEP-2 cells expressing BAHD1 or Ctrl shRNAs were analyzed as described for panel A. (D) Comparison of transcriptomes in F11KO HUDEP-2 cells expressing BAHD1 vs control (Ctrl) shRNA. The graph at left shows differential gene expression as described for Figure 3A. The right panels show the results of GSEA. (E) Heat map showing erythroid genes whose expression was decreased in F11KO vs WT HUDEP-2 cells (>twofold; false discovery rate [FDR], <0.05) and upregulated by the expression of BAHD1 shRNA (B1-sh1) in F11KO cells (>twofold; FDR, <0.1). *P < .05; **P < .01; ***P < .001 (unpaired Student t test).
FBXO11 activates erythroid gene expression by degrading BAHD1. (A) WT and FBXO11 KO (clone F11KO #2; supplemental Figure 2C) HUDEP-2 cells were treated with Cas9 plus BAHD1 or control (Ctrl) sgRNAs and analyzed for erythroid markers after 5 days of induced maturation. The graph shows the mean ± SEM from 3 biological replicate experiments. (B) Cell pellets from FBXO11 KO HUDEP-2 cells that were treated with Cas9 + BAHD1 or Ctrl sgRNAs after 5 days of induced maturation. (C) WT and F11KO HUDEP-2 cells expressing BAHD1 or Ctrl shRNAs were analyzed as described for panel A. (D) Comparison of transcriptomes in F11KO HUDEP-2 cells expressing BAHD1 vs control (Ctrl) shRNA. The graph at left shows differential gene expression as described for Figure 3A. The right panels show the results of GSEA. (E) Heat map showing erythroid genes whose expression was decreased in F11KO vs WT HUDEP-2 cells (>twofold; false discovery rate [FDR], <0.05) and upregulated by the expression of BAHD1 shRNA (B1-sh1) in F11KO cells (>twofold; FDR, <0.1). *P < .05; **P < .01; ***P < .001 (unpaired Student t test).
The BAHD1 protein binds H3K27me3 marks via its BAH domain and recruits transcriptional corepressors,16,17,26,27 providing a potential mechanism by which its degradation by FBXO11 could facilitate erythroid gene activation. Suppression of BAHD1 in an FBXO11−/− HUDEP-2 clone (F11KO #2) restored the expression of many GATA1-activated erythroid transcripts (Figure 4D-E; supplemental Table 5). Rank-based gene set enrichment analysis of differentially expressed mRNAs after BAHD1 suppression in FBXO11 KO cells showed significant enrichment for transcripts that were repressed by loss of FBXO11 (normalized enrichment score, 3.6665; false discovery rate <0.0001; supplemental Figure 6I). Of 513 transcripts that were reduced after FBXO11 KO, 123 genes (24%) were detected by leading edge analysis of mRNAs that were upregulated by BAHD1 shRNA (supplemental Figure 6J). In WT (FBXO11+/+) HUDEP-2 cells, enforced expression of BAHD1-V5 inhibited erythroid maturation (supplemental Figure 7A-C). There was a significant correlation between mRNAs that were downregulated by FBXO11 deficiency and by enforced expression of BAHD1-V5 (supplemental Figure 7D-E; supplemental Tables 6 and 7). In HUDEP-2 cell lysates, BAHD1-V5 coimmunoprecipitated with the corepressor proteins HDAC1, HDAC2, EHMT1, EHMT2, MIER1, MIER3, and CDYL1 (supplemental Figure 7F), as described.16,17,26 Immunofluorescence microscopy showed partial colocalization between BAHD1-V5 and H3K27me3 (supplemental Figure 7G), which is consistent with the finding that BAHD1 binds H3K27me3.16,27 Together, these results indicate that FBXO11 activates gene expression by eliminating BAHD1.
FBXO11 targets BAHD1 at bivalent erythroid genes
The promoter regions of most FBXO11-regulated genes (ie, those showing decreased or increased expression after FBXO11 depletion) in WT HUDEP-2 cells, harbored simultaneous H3K4me3 and H3K27me3 marks, indicating bivalent chromatin, whereas those with unchanged expression tended to be monovalent (Figure 5A, first two panels). We obtained similar results in proerythroblasts generated from peripheral blood CD34+ HSPCs and by analyzing published data on primary CD36+CD71+CD235a+ (glycophorin A) erythroblasts derived from umbilical cord blood HSPCs28 (Figure 5B). The promoters of genes with decreased expression in FBXO11 KO HUDEP-2 cells exhibited increased H3K27me3 marks (P = 2.2e−16; Wilcoxon signed-rank test) and decreased H3K4me3 marks (P = 2.2e−16; Wilcoxon signed-rank test), whereas genes with increased expression in FBXO11 KO cells exhibited slightly enhanced promoter H3K4me3 (P = .0037) and no significant changes in H3K27me3 (Figure 5A [panels 3 and 4], C-D).
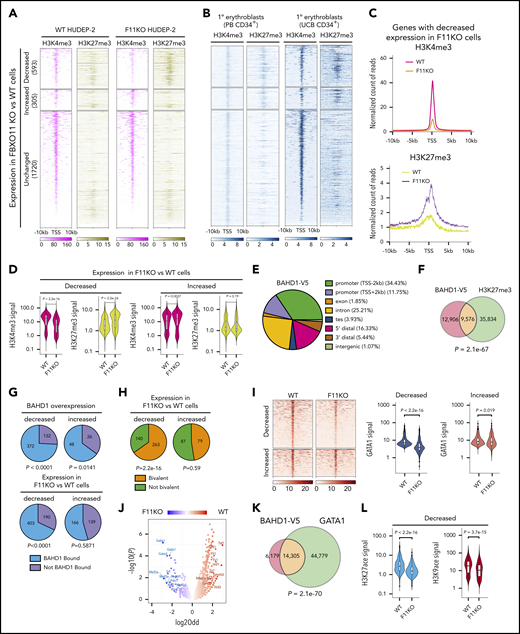
FBXO11 targets BAHD1 at bivalent erythroid genes. (A) Heat maps showing H3K27me3 and H3K4me3 histone marks near the transcription start site (TSS, ±10 kb) of genes with decreased, increased, or unchanged expression after FBXO11 KO in HUDEP-2 cells grown under expansion conditions. Results are shown for WT and F11KO (clone F11KO #2) HUDEP-2 cells with analysis from 2 biological replicates. (B) The histone marks H3K4me3 and H3K27me3 within 10 kb of the TSS of FBXO11-regulated genes in human peripheral blood (PB) CD34+ cell–derived proerythroblasts at differentiation day 7 and in CD36+CD71+CD235a+ human umbilical cord blood CD34+ cell–derived erythroblasts from the Blueprint consortium (http://www.blueprint-epigenome.eu/). (C) Metagene representation of histone marks for genes with decreased expression after FBXO11 KO, as shown in panel A. Results are from an analysis of 2 biological replicates. (D) Violin plots showing normalized densities of H3K27me3 and H3K4me3 marks in genes with decreased or increased expression after FBXO11 KO in WT or F11KO HUDEP-2 cells grown in culture under expansion conditions. The data summarize the results of 2 biological replicate experiments. (E) Genomic localization of BAHD1-V5 ChIP-seq peaks. Promoter, 2 kb on either side of the TSS; TES, 2 kb on either side of the transcription end site (TES); 5′ distal region, 50 kb upstream of the TSS to 2 kb downstream of the TSS; 3′ distal region, 2 kb downstream of the TES to 50 kb downstream of the TES; intergenic, >50 kb upstream of the TSS and >50 kb downstream of the TES. Results are shown from analysis of 3 biological replicates. (F) Overlap between BAHD1-V5 binding (ChIP-seq signals) and H3K27me3 marks in HUDEP-2 cells. The P value was determined by Fisher exact test. (G) Analysis of genes that are deregulated by ectopic expression of BAHD1-V5 in HUDEP-2 cells. Pie charts show the mRNA transcripts that are decreased (upper left) or increased (upper right) in BAHD1-V5–expressing vs WT cells, color-coded according to the BAHD1-V5 binding of the corresponding genes. The P values refer to the significance of BAHD1-V5 occupancy on genes with decreased or increased expression caused by BAHD1-V5 (as determined by Fisher exact test). BAHD1-V5 binding in genes with decreased (lower left) or increased (lower right) expression in F11KO vs WT HUDEP-2 cells. The P values refer to the significance of BAHD1-V5 occupancy in each group (Fisher exact test). (H) Promoter bivalency in genes with decreased (left) or increased (right) expression in F11KO vs WT HUDEP-2 cells. The P values refer to the significance of promoter bivalency in each group (Fisher exact test). (I) ChIP-seq analysis of WT and F11KO (clone F11KO #2) HUDEP-2 cells for GATA1 occupancy near the TSS (±5 kb) of genes with decreased or increased expression after FBXO11 KO. Heat maps of GATA1 signals are shown on the left. Violin plots on the right show normalized densities of GATA1 signals (data from 2 biological replicate experiments). P values were determined by the Wilcoxon test. (J) Motif-enrichment analysis of ATAC-seq data from WT and FBXO11-KO (F11KO #2) HUDEP-2 cells. The volcano plot shows the transcription factor binding motifs that are enriched near ATAC-seq peaks (reflecting open chromatin) and that are lost or gained in F11KO cells compared with WT cells. (K) Overlap between BAHD1-V5 binding sites and GATA1 occupancy in WT (FBXO11+/+) HUDEP-2 cells. P value was determined by Fisher exact test. (L) Violin plots showing normalized densities of H3K27ace and H3K9ace marks in genes with decreased expression after FBXO11 KO in WT vs F11KO HUDEP-2 cells. The P value was determined by the Wilcoxon test.
FBXO11 targets BAHD1 at bivalent erythroid genes. (A) Heat maps showing H3K27me3 and H3K4me3 histone marks near the transcription start site (TSS, ±10 kb) of genes with decreased, increased, or unchanged expression after FBXO11 KO in HUDEP-2 cells grown under expansion conditions. Results are shown for WT and F11KO (clone F11KO #2) HUDEP-2 cells with analysis from 2 biological replicates. (B) The histone marks H3K4me3 and H3K27me3 within 10 kb of the TSS of FBXO11-regulated genes in human peripheral blood (PB) CD34+ cell–derived proerythroblasts at differentiation day 7 and in CD36+CD71+CD235a+ human umbilical cord blood CD34+ cell–derived erythroblasts from the Blueprint consortium (http://www.blueprint-epigenome.eu/). (C) Metagene representation of histone marks for genes with decreased expression after FBXO11 KO, as shown in panel A. Results are from an analysis of 2 biological replicates. (D) Violin plots showing normalized densities of H3K27me3 and H3K4me3 marks in genes with decreased or increased expression after FBXO11 KO in WT or F11KO HUDEP-2 cells grown in culture under expansion conditions. The data summarize the results of 2 biological replicate experiments. (E) Genomic localization of BAHD1-V5 ChIP-seq peaks. Promoter, 2 kb on either side of the TSS; TES, 2 kb on either side of the transcription end site (TES); 5′ distal region, 50 kb upstream of the TSS to 2 kb downstream of the TSS; 3′ distal region, 2 kb downstream of the TES to 50 kb downstream of the TES; intergenic, >50 kb upstream of the TSS and >50 kb downstream of the TES. Results are shown from analysis of 3 biological replicates. (F) Overlap between BAHD1-V5 binding (ChIP-seq signals) and H3K27me3 marks in HUDEP-2 cells. The P value was determined by Fisher exact test. (G) Analysis of genes that are deregulated by ectopic expression of BAHD1-V5 in HUDEP-2 cells. Pie charts show the mRNA transcripts that are decreased (upper left) or increased (upper right) in BAHD1-V5–expressing vs WT cells, color-coded according to the BAHD1-V5 binding of the corresponding genes. The P values refer to the significance of BAHD1-V5 occupancy on genes with decreased or increased expression caused by BAHD1-V5 (as determined by Fisher exact test). BAHD1-V5 binding in genes with decreased (lower left) or increased (lower right) expression in F11KO vs WT HUDEP-2 cells. The P values refer to the significance of BAHD1-V5 occupancy in each group (Fisher exact test). (H) Promoter bivalency in genes with decreased (left) or increased (right) expression in F11KO vs WT HUDEP-2 cells. The P values refer to the significance of promoter bivalency in each group (Fisher exact test). (I) ChIP-seq analysis of WT and F11KO (clone F11KO #2) HUDEP-2 cells for GATA1 occupancy near the TSS (±5 kb) of genes with decreased or increased expression after FBXO11 KO. Heat maps of GATA1 signals are shown on the left. Violin plots on the right show normalized densities of GATA1 signals (data from 2 biological replicate experiments). P values were determined by the Wilcoxon test. (J) Motif-enrichment analysis of ATAC-seq data from WT and FBXO11-KO (F11KO #2) HUDEP-2 cells. The volcano plot shows the transcription factor binding motifs that are enriched near ATAC-seq peaks (reflecting open chromatin) and that are lost or gained in F11KO cells compared with WT cells. (K) Overlap between BAHD1-V5 binding sites and GATA1 occupancy in WT (FBXO11+/+) HUDEP-2 cells. P value was determined by Fisher exact test. (L) Violin plots showing normalized densities of H3K27ace and H3K9ace marks in genes with decreased expression after FBXO11 KO in WT vs F11KO HUDEP-2 cells. The P value was determined by the Wilcoxon test.
Because we were unable to obtain chromatin immunoprecipitation sequencing (ChIP-seq) signals with commercial anti-BAHD1 antibodies, we used an anti-V5 antibody to analyze the chromatin occupancy of BAHD1-V5 expressed in HUDEP-2 cells. There was strong correlation between ChIP-seq signals obtained in 3 biological replicate experiments (correlation coefficient >0.95). Overall, BAHD1-V5 occupancy was enriched near transcription start sites (TSSs; ±2 kb) (Figure 5E), at H3K27me3 marks (Figure 5F), at genes that were repressed by overexpressed BAHD1-V5 (Figure 5G), and at genes that were downregulated after FBXO11 KO (Figure 5G; supplemental Tables 8 and 9). Of 403 BAHD1-bound genes that were downregulated after FBXO11 KO in HUDEP-2 cells, 263 (65%) exhibited bivalent promoter marks (Figure 5H). Loss of FBXO11 caused repression of GATA1 target genes (Figure 3B) with reduced GATA1 occupancy near TSSs (±5 kb) (Figure 5I), despite normal levels of GATA1 protein (Figure 3D-E). Analysis by Assay for Transposase-Accessible Chromatin with high-throughput sequencing (ATAC-seq) revealed a selective loss of open chromatin near GATA-binding motifs after FBXO11 KO (Figure 5J). Moreover, BAHD1-V5 binding overlapped with 24% of the sites occupied by GATA1 in WT HUDEP-2 cells (Figure 5K). There were reduced H3K27 and H3K9 acetyl marks near the promoters of genes with decreased expression after FBXO11 KO (Figure 5L), consistent with the binding of histone deacetylases to BAHD1.16,17,26 Together, these data indicate that loss of FBXO11 leads to increased expression of BAHD1, which binds H3K27me3 marks near erythroid gene promoters to inhibit their expression, in part by establishing a closed chromatin state that inhibits GATA1 occupancy.
Analysis of 2 FBXO11-BAHD1–regulated genes ANKH and SLC22A4 is shown in supplemental Figure 8. In WT HUDEP-2 cells, both genes are occupied by GATA1. Depletion of FBXO11 in F11KO cells led to BAHD1 accumulation (Figure 3E-G), increased H3K27me3 repressive marks, reductions in activating marks (H3K27ace, H3K9ace, and H3K4me3), loss of GATA1 occupancy, and reduced mRNA expression (Figure 4E). Analysis of BAHD1-V5 expressing cells by ChIP-seq revealed occupancy near the promoters of both genes. Although the effects of FBXO11 depletion on ANKH and SLC22A4 epigenetic marks were consistent with the overall trends revealed by meta-analyses shown in Figure 5, there were some differences between the 2 genes. For example, H3K27me3 was detected at ANKH but not SLC22A4 in WT HUDEP-2 cells. These differences may be caused by unique kinetics of epigenetic changes at individual genes during normal erythroid maturation and/or asynchrony of HUDEP-2 cells.
BAHD1 interacts functionally and physically with the PRC2 complex
We transfected an sgRNA library targeting 496 epigenetic modifier genes into Cas9-expressing FBXO11 KO HUDEP-2 cells, followed by induced erythroid maturation (Figure 6A). Guide RNAs targeting core PRC2 complex subunit genes EED, EZH2, and RBBP4 were enriched in mature (Band3+) erythroblasts (Figure 6B; supplemental Table 10), consistent with the concept that PRC2 inhibits differentiation of stem and progenitor cells by forming repressive chromatin in lineage-specific genes.29,30 Disruption of EED, EZH2, or SUZ12 genes by individual sgRNAs enhanced the erythroid maturation of WT HUDEP-2 cells and partially rescued the maturation defect in FBXO11 KO cells (Figure 6C-D; supplemental Figure 9A), which was similar to the effects of BAHD1 suppression. Protein network analysis showed close functional associations between BAHD1 and PRC2, with numerous shared subunits, including CDYL1, EHMT1/2, and HDAC1/2 (supplemental Figure 9B). In 293 cell lysates, ectopically expressed BAHD1-MYC co-immunoprecipitated with both EZH2 and EED (Figure 6E). In HUDEP-2 cells, ectopically expressed BAHD1-MYC co-immunoprecipitated with endogenous EZH2 (supplemental Figure 9C). We were unable to demonstrate co-immunoprecipitation of endogenous EZH2 and BAHD1 HUDEP-2 cells, perhaps because the latter protein is expressed at relatively low levels.26 Erythroid genes that were downregulated after FBXO11 KO or overexpression of BAHD1 were enriched for PRC2 targets (Figure 6F), although the protein levels of PRC2 components were unchanged (supplemental Figure 9D). Thus, BAHD1 interacts genetically, functionally, and physically with PRC2, an H3K27me3 reader and writer that functions at bivalent domains.31
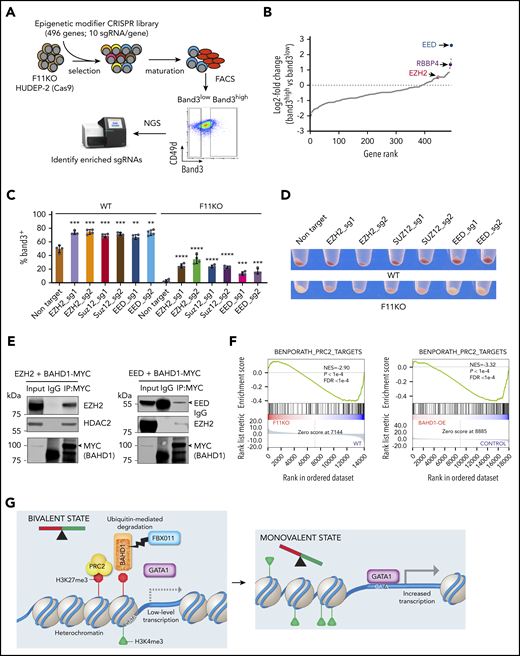
BAHD1 interacts functionally and physically with the PRC2 complex. (A) Cas9-expressing F11KO HUDEP-2 cells were transduced with a lentiviral vector library encoding sgRNAs against 496 epigenetic modifier genes, selected in puromycin, then induced to undergo maturation for 5 days. Band3high and Band3low erythroblasts were FACS purified and analyzed by deep sequencing to compare the sgRNA representation. (B) Differential gene rank by RRA score from MAGeCK analysis32,33 of Band3high and Band3low erythroblasts. The PRC2 complex genes EED, EZH2, and RBBP4 are indicated. (C) WT and F11KO (clone F11KO #2) HUDEP-2 cells expressing Cas9 plus individual EZH2, SUZ12, EED, or control (Ctrl) sgRNAs were analyzed for Band3 expression after 5 days of induced erythroid maturation. The graph shows the mean ± SEM from 4 biological replicate experiments. (D) Pellets of cells described in panel C after 5 days of induced maturation. (E) 293T cells were transfected with plasmids encoding BAHD1-MYC and EZH2 (left panel) or BAHD1-MYC and EED (right panel). After 48 hours, cell lysates were immunoprecipitated with anti-MYC or IgG antibody, and western blot analysis was performed with the antibodies indicated at the right of each panel. The input represents 10% of the immunoprecipitated samples. (F) GSEA of differentially expressed genes in F11KO vs WT HUDEP-2 cells (left panel) or BAHD1-OE vs control HUDEP-2 cells (right panel), showing enrichment for a PRC2 target gene set. (G) Model showing the regulation of erythroid gene expression by FBXO11-mediated degradation of BAHD1. In early-stage erythroblasts, many erythroid genes are maintained in a bivalent state associated with concomitant H3K4me3 and H3K27me3 promoter marks and low-level expression. The heterochromatin-associated protein BAHD1 binds H3K3me3, recruits repressor proteins, and physically interacts with the PRC2 complex (an H3K27me3 writer). Recruitment of the erythroid transcription factor GATA1 is inhibited by BAHD1-induced heterochromatin. FBXO11 relieves transcriptional repression, facilitates GATA1 binding and promotes transition to a monovalent activating state by stimulating ubiquitin-mediated proteolysis of BAHD1, either before or after its binding to DNA and/or its interaction with corepressor proteins. NGS, next-generation sequencing. **P < .01; ***P < .001; ****P < .0001 (unpaired Student t test).
BAHD1 interacts functionally and physically with the PRC2 complex. (A) Cas9-expressing F11KO HUDEP-2 cells were transduced with a lentiviral vector library encoding sgRNAs against 496 epigenetic modifier genes, selected in puromycin, then induced to undergo maturation for 5 days. Band3high and Band3low erythroblasts were FACS purified and analyzed by deep sequencing to compare the sgRNA representation. (B) Differential gene rank by RRA score from MAGeCK analysis32,33 of Band3high and Band3low erythroblasts. The PRC2 complex genes EED, EZH2, and RBBP4 are indicated. (C) WT and F11KO (clone F11KO #2) HUDEP-2 cells expressing Cas9 plus individual EZH2, SUZ12, EED, or control (Ctrl) sgRNAs were analyzed for Band3 expression after 5 days of induced erythroid maturation. The graph shows the mean ± SEM from 4 biological replicate experiments. (D) Pellets of cells described in panel C after 5 days of induced maturation. (E) 293T cells were transfected with plasmids encoding BAHD1-MYC and EZH2 (left panel) or BAHD1-MYC and EED (right panel). After 48 hours, cell lysates were immunoprecipitated with anti-MYC or IgG antibody, and western blot analysis was performed with the antibodies indicated at the right of each panel. The input represents 10% of the immunoprecipitated samples. (F) GSEA of differentially expressed genes in F11KO vs WT HUDEP-2 cells (left panel) or BAHD1-OE vs control HUDEP-2 cells (right panel), showing enrichment for a PRC2 target gene set. (G) Model showing the regulation of erythroid gene expression by FBXO11-mediated degradation of BAHD1. In early-stage erythroblasts, many erythroid genes are maintained in a bivalent state associated with concomitant H3K4me3 and H3K27me3 promoter marks and low-level expression. The heterochromatin-associated protein BAHD1 binds H3K3me3, recruits repressor proteins, and physically interacts with the PRC2 complex (an H3K27me3 writer). Recruitment of the erythroid transcription factor GATA1 is inhibited by BAHD1-induced heterochromatin. FBXO11 relieves transcriptional repression, facilitates GATA1 binding and promotes transition to a monovalent activating state by stimulating ubiquitin-mediated proteolysis of BAHD1, either before or after its binding to DNA and/or its interaction with corepressor proteins. NGS, next-generation sequencing. **P < .01; ***P < .001; ****P < .0001 (unpaired Student t test).
Discussion
In stem and progenitor cells, many genes are maintained at low expression levels by a bivalent epigenetic signature with concomitant activating and repressive chromatin marks, H3K4me3 and H3K27me3, respectively. Upon cellular differentiation, the conversion to monovalent activating states induces high-level expression of lineage-specific genes, whereas the shift to monovalent repressive states silences stem, progenitor, and alternate lineage genes, thereby driving cell fate. These processes are regulated by the relative chromatin occupancies of the MLL and PRC2 complexes, which generate H3K4me3 and H3K27me3 marks, respectively.34 Accordingly, our CRISPR screen identified KMT2D (MLL subunit) as a candidate positive regulator of erythroid development and EED (PRC2 subunit) as a negative regulator (Figure 1C). In addition to these predictable findings, we identified FBXO11 as an E3 ubiquitin ligase that drives erythropoiesis by eliminating the BAHD1 transcriptional repressor.
Transcriptional repression at bivalent promoters is maintained by the canonical PRC1 and PRC2 complexes.31 The PRC2 catalytic subunit EZH2 establishes H3K27me3 marks that recruit additional PRC2 via its EED subunit and PRC1, which stabilizes PRC2 binding and mediates gene silencing.34 Here we have shown that BAHD1, an H3K27me3 reader that binds transcriptional co-repressors,16,17,26,27 interacts genetically, functionally, and physically with the PRC2 complex to promote transcriptional repression directly at bivalent promoters. Previous studies have established roles for BAHD1 as a transcriptional repressor in fibroblasts, epithelial cells, and placental tissues.16,17,26 More recently, 2 BAH domain proteins, EBS and SHL, were identified as H3K27me3 readers that promote PRC2-mediated gene silencing at bivalent chromatin in plants.35,36 Thus, the BAH domain is an evolutionarily conserved H3K27me3 reader and effector of PRC2-mediated gene repression.
How PRC2-mediated repression is relieved at bivalent promoters during cellular differentiation is not fully understood. During erythropoiesis, GATA1 mediates a developmental switch from EZH2 to EZH1 expression, resulting in a shift from the canonical PRC2 repressor complex to a noncanonical one that activates erythroid gene expression.37 Our findings provide a novel complementary mechanism for the developmental regulation of PRC2 activities. Specifically, we propose that the BAHD1 corepressor complex binds H3K27me3 marks at bivalent domains in early erythroid precursors and cooperates with PRC2 to induce a condensed chromatin state that restricts GATA1 occupancy (Figure 6G). The degradation of BAHD1 by FBXO11 results in open chromatin, thereby enhancing GATA1 occupancy and erythroid gene expression. Several lines of evidence support this model. First, the loss of FBXO11 in erythroblasts impairs terminal maturation and erythroid gene expression. Second, FBXO11 binds BAHD1 and facilitates its ubiquitination in vitro and in vivo. Third, genetic depletion of BAHD1 or PRC2 components partially suppresses FBXO11-deficient erythroid phenotypes. Fourth, BAHD1 overexpression and the loss of FBXO11 inhibit overlapping sets of erythroid genes. Fifth, the binding of GATA1 to erythroid target genes is reduced in FBXO11 KO erythroblasts, despite their normal GATA1 levels.
Elimination of BAHD1 by FBXO11 leads to a reduction in H3K27me3 marks at erythroid promoters (Figure 5A), which could occur through several mechanisms. Increased GATA1 occupancy at erythroid gene promoters caused by loss of BAHD1-induced heterochromatin may facilitate interactions with long-range enhancers that can recruit H3K27me3 demethylases such as JMJD3.38,39 In addition, the recruitment of transcriptional activators, including GATA1 and its cofactors, can interfere with binding of the H3K27me3 writer PRC2 to unmethylated CpG-rich regions.40 Finally, downregulated expression of EZH2 during erythroid maturation, coupled with ongoing cell division, may clear H3K27me3 by replicational dilution.37,41
The levels of FBXO11 and BAHD1 proteins are unchanged during the early stages of erythropoiesis (supplemental Figure 5E-F), and the decline of BAHD1 protein during terminal maturation is not accompanied by increased FBXO11, suggesting that additional signals are required to initiate BAHD1 degradation by FBXO11. In epithelial cells, protein kinase D1 phosphorylation of the SNAIL protein is required for its ubiquitination by FBXO11.22 In various nonerythroid cells, cyclin-dependent kinase phosphorylation of the CDT2 protein protects it from FBXO11-mediated degradation.23,42 Hence, phosphorylation of BAHD1 in erythroid cells may regulate its degradation. Alternatively, the degradation of BAHD1 during erythroid maturation may be triggered by other amino acid modifications that facilitate its binding to FBXO11, altered subcellular localization of either protein, and/or the elimination of interfering protein interactions. It will be interesting to identify the erythroid signals that initiate FBXO11-mediated degradation of BAHD1, which may be mechanistically linked to a previously described S-phase–dependent maturation process that is associated with the loss of H3K27me3 marks at erythroid gene promoters and their transcriptional activation.43,44
There are numerous open questions related to our study. Because suppression of BAHD1 only partially rescued the expression of erythroid genes in FBXO11-depleted erythroblasts, additional proteins that repress gene expression are likely targeted for degradation by FBXO11. Moreover, T-cell and hematopoietic stem cell–related transcripts were upregulated in FBXO11-depleted erythroblasts (Figure 3A,C), indicating that FBXO11 may eliminate activators of these genes. Our proteome-based screen identified several candidate FBXO11 target genes that require future study (Figure 3D). In addition, the method used to identify FBXO11-degraded proteins was not comprehensive, and it will be important to seek other ubiquitination targets by using alternate approaches.45 Finally, it will be interesting to investigate how FBXO11-mediated degradation of BAHD1 and possibly other chromatin modulators regulates the activities of GATA transcription factors. For example, GATA1 facilitates erythropoiesis by activating erythroid genes and repressing those expressed in alternate lineages and HSPCs.46-54 Thus, FBXO11 may repress T-cell and HSPC genes (Figure 3A,C) by facilitating the repressive activities of GATA1. Along the same lines, GATA1 modulates transcription both positively and negatively by displacing GATA2 from many cognate motifs during erythroid maturation,55,56 and FBXO11 may facilitate this process at some genes.
FBXO11 regulates multiple developmental processes,15,21,57,58 and some of the activities may be mediated by degradation of BAHD1. For example, FBXO11 regulates B-cell development and acts as a tumor suppressor for B-cell lymphomas by stimulating the ubiquitin-mediated proteolysis of transcriptional repressor BCL6.15,58 It is possible that FBXO11 also regulates normal and malignant B-cell lymphopoiesis by destabilizing BAHD1. In support, FBXO11 expression and elevated BAHD1 expression are associated with reduced survival in B-cell lymphomas.59 Further studies are required to confirm whether the FBXO11-BAHD1 axis regulates B-cell lymphomagenesis.
The regulation of cell fate by ubiquitin ligases is an emerging concept in biology. Recent studies have illustrated how the activities of a single E3 ligase can alter the levels of many cellular proteins to affect cell development. For example, mono-ubiquitination of the nucleolar proteins TCOF1 and NOLC1 by the E3 ligase KBTBD8 alters ribosomes to favor neural crest gene translation.60 Our studies have shown how 1 E3 ligase can regulate >100 erythroid genes by eliminating a heterochromatin-inducing protein. It seems likely that this general mechanism applies to the activities of FBXO11 in multiple tissues and perhaps to the activities of other E3 ligases during metazoan development.
All data are available in the main text or in the supplemental materials.
The RNA-seq and ChIP-seq data reported in this article have been deposited in the Gene Expression Omnibus database (accession number GSE115357).
The online version of this article contains a data supplement.
The publication costs of this article were defrayed in part by page charge payment. Therefore, and solely to indicate this fact, this article is hereby marked “advertisement” in accordance with 18 USC section 1734.
Acknowledgments
The authors thank Keith A. Laycock for scientific editing of the manuscript. Ryo Kurita and Yukio Nakamura (Cell Engineering Division, RIKEN BioResource Center, Tsukuba, Japan) provided HUDEP-2 cells. Xiuli An (Laboratory of Membrane Biology, New York Blood Center) provided the anti-Band3 antibody. Martine F. Roussel (Department of Tumor Cell Biology, St. Jude Children’s Research Hospital) provided the plasmids encoding EED and EZH2 cDNAs. David Root (Genetic Perturbation Platform, The Broad Institute) provided the CRISPR/Cas9 library targeting UPS components. The following St. Jude Children’s Research Hospital core facilities contributed to this work: Flow Cytometry, Proteomics, Center for Advanced Genome Engineering, and the Hartwell Center.
This research was supported by grants from the National Institutes of Health (NIH)/National Institute of Diabetes and Digestive and Kidney Diseases (R01DK61692 [M.J.W.] and R24DK106766 [Y.C.]), NIH/National Institute of General Medical Sciences (R01GM114260 [J. Peng] and R37GM069530 [B.A.S.]), Biogen-Idec (160419010 [M.J.W.]), from the European Research Commission (project BCM-UPS, grant 682473 [F.B.]), and the Deutsche Forschungsgemeinschaft (SFB 1335 [F.B.]).
The content is solely the responsibility of the authors and does not necessarily represent the official views of the NIH.
Authorship
Contribution: P.X. and M.J.W. designed the experiments, analyzed the data, and wrote the manuscript; P.X. performed CRISPR screening, RNA-seq, and ChIP-seq with help from Y.Y. and R.F.; B.X., Y.-D.W., L.E.P., L.C., and W.B. performed bioinformatics analyses with help from Y.F. and Y.C.; H.W. and Y.L. performed proteomics profiling and data analysis under the guidance of J. Peng.; J. Papizan and S.M.P.-M. helped generate the BAHD1-V5 tagged knockin cell line; D.C.S., M.T.K., and P.X. performed planned studies related to BAHD1 biochemistry and ubiquitination assays under the guidance of B.A.S.; A.F.A., C.L., R.S., K.M., and F.B. provided conceptual advice and technical expertise; M.J.W. supervised the study; and all authors discussed the results and contributed to preparing the manuscript.
Conflict-of-interest disclosure: M.J.W. received consulting payments or equity from Beam Therapeutics, Esperion Therapeutics, Novartis, Cellarity Inc, Forma Therapeutics, and Rubius Inc. The remaining authors declare no competing financial interests.
Correspondence: Mitchell J. Weiss, St. Jude Children’s Research Hospital, 262 Danny Thomas Place, MS #355, Memphis, TN 38105-3678; e-mail: mitch.weiss@stjude.org.

This feature is available to Subscribers Only
Sign In or Create an Account Close Modal