

Key Points
Feasibility of monitored out-of-hospital pain and patient-reported VOC days as end points for clinical trials in SCD is shown.
ePROs, actigraphy, and laboratory biomarkers enable improved identification and assessment of in-hospital and out-of-hospital VOCs.

Abstract
Clinical trials in sickle cell disease (SCD) often focus on health care utilization for painful vaso-occlusive crises (VOCs). However, no objective, quantifiable pain biomarkers exist, pain is not specific to VOCs, health care utilization varies between patients, unreported at-home VOCs likely contribute to long-term outcomes, and patient-reported outcomes are seldom considered. This noninterventional, longitudinal, 6-month study aimed to develop tools to identify VOCs in SCD patients with or without health care utilization. Participants wore an actigraph device, tracking sleep and activity. Patients with SCD used an electronic patient-reported outcome (ePRO) tool to collect data on pain, medication, fatigue, and daily function. Patients self-reported when they experienced VOC pain (VOC day). Biomarkers were collected every 3 weeks (non-VOC). Self-reported VOCs triggered at-home or in-hospital blood collection. The study enrolled 37 participants with SCD; 35 completed the study. Participants reported 114 VOC events and 346 VOC days, of which 62.3% and 78.3%, respectively, were self-treated at home. The ePRO and actigraphy captured end points of pain, functionality, fatigue, activity, and sleep; each was significantly altered on VOC days compared with non-VOC days. Biomarkers collected at home or in the hospital on VOC days were significantly altered compared with non-VOC baseline values, including leukocyte-platelet aggregates, microfluidic-based blood cell adhesion, interleukin-6, C-reactive protein, interleukin-10, tumor necrosis factor-α, and thrombin–antithrombin. The Evaluation of Longitudinal Pain Study in Sickle Cell Disease (ELIPSIS) trial shows the feasibility of accurately monitoring out-of-hospital pain by using patient-reported VOC days as potential end points for clinical trials in SCD; it describes the changes in biomarkers and activity measured by actigraphy that may enable improved identification and assessment of VOCs.
Introduction
Sickle cell disease (SCD) is one of the most common genetic diseases, with a global burden of 250 000 new cases each year.1,2 Among the most common pathophysiology and morbidity-inducing manifestations of SCD are vaso-occlusive crises (VOCs).3 These pain episodes result in missed workdays and school days and a decrease in quality of life, and they correlate with increased health care costs, morbidity, and mortality. Because the timing of VOC pain episodes and other complications are difficult to predict and occur at irregular intervals, testing new treatments is challenging and requires a reliable method of tracking pain over long periods of time. Physicians currently rely on patients to verbally provide a history of VOC, often during peak times of pain when the patient is distressed and seeking medical attention.
The conventional SCD-related VOC end point, as used in clinical trials, requires medical utilization and is defined by the following: acute episodes of pain with no other medically determined cause; duration >4 hours; a medical facility visit; and treatment with oral or parenteral narcotic agents or a parenteral nonsteroidal anti-inflammatory drug.4-7 However, the threshold for both pain toleration and seeking medical contact varies between patients. Furthermore, it can be difficult for patients to provide an accurate history of their pain status leading up to their VOC. Consequently, many painful episodes do not come to the attention of the medical system or a clinical trial. Paper diaries can capture home-based patient experience but are often unreliable. Daily monitoring using an electronic patient-reported outcome (ePRO) device may provide a means to better capture the patient’s pain experience.8
The present Evaluation of Longitudinal Pain Study in Sickle Cell Disease (ELIPSIS) trial was a non-interventional, longitudinal study to test novel tools to identify and document the natural history of VOCs occurring in patients with SCD before, during, and after a self-reported VOC event. A patient-focused definition of VOC, the VOC day, was developed to capture the patient experience of a pain crisis that was managed either at home, in a clinic, in the emergency department, or in the hospital. Actigraphy, biomarker, and clinical laboratory data were collected before, during, and after a self-reported VOC to assess the longitudinal association between stable, non-VOC, and VOC measurements of daily activity and biomarker changes. Mobile phlebotomy enabled blood collections at home.
Methods
Study participants
This protocol was approved by the Wayne State University Human Investigation Committee Institutional Review Board. Participants had a confirmed diagnosis of stable SCD (defined as no significant complications for at least 1 week before study entry such as VOC requiring in-patient hospitalization, acute chest syndrome, or any complication requiring in-patient hospitalization, or no acute transfusions for at least 1 month before the baseline visit) with hemoglobin SS or S-β thalassemia0 were identified at clinic visits and offered written informed consent to participate in the study. Participants must have had 2 unplanned medical interventions with health care providers for VOCs, requiring opioid treatment, in the 12 months before study entry and be at least 12 years of age, with a weight of at least 43.5 kg to allow for the frequent blood collections. Participants who were being treated with hydroxyurea must have been on a stable dose for at least 8 weeks prior to visit 1. Exclusion criteria are presented in the supplemental Methods (available on the Blood Web site). The study also included participants with SC trait (HbAS) and non-SCD healthy participants to collect baseline biomarker data.
Study design
The 6-month longitudinal study of patients with SCD (with and without hydroxyurea therapy) (Figure 1A) was conducted to document the natural history of self-reported VOCs and to assess biomarkers in longitudinally collected blood samples before, during, and after VOC events (Figure 1B). The at-home study used a novel ePRO device for self-reported daily VOC days, pain, fatigue, function, and medication (supplemental Methods). The e-diary was developed based in part on previous research conducted in the PiSCES (Pain in Sickle Cell Epidemiology Study) trial.9-11 Daily reporting was completed by the participant. The daily e-diary captured a patient-reported VOC pain crisis as a VOC day, if the participant responded yes to whether they experienced a pain crisis in the last 24 hours (supplemental Figure 1). Each VOC day, the participant’s choice of medical utilization, if the participant required medical utilization, or oral or parenteral narcotics or nonsteroidal anti-inflammatory drugs used during a crisis were captured. Treatment decisions for VOCs were categorized as direct (with or without hospitalization), indirect (telephone/e-mail contact with health care provider), or self-treatment. The participants were instructed to complete the diary daily with the possibility of a second entry if a VOC occurred after entry for the day. One entry per day on the ePRO was considered compliance for that day.
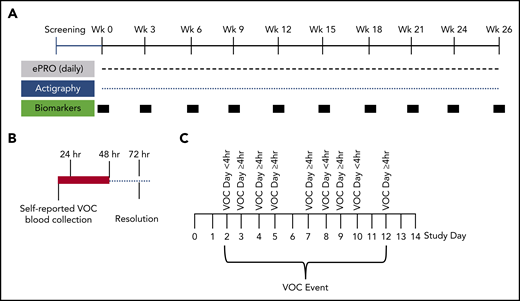
Schematic of study design. (A) Study design for the 6-month longitudinal analysis of SCD patients (with and without hydroxyurea therapy) to document the natural history of self-reported VOCs. This innovative at-home study design used the ePRO tool for self-reported daily pain, fatigue, function, and medication. Pain, functionality, fatigue, and medications were recorded by using the e-diary. Participants recorded their experience of pain crisis in a 24-hour recall period. The ePRO documented real-time self-reported VOC days that tracked the patient’s treatment decisions (at home vs emergency department or hospital). Blood samples for biomarkers and clinical laboratory tests were drawn by a mobile phlebotomist in the subject’s home every 3 weeks during non-VOC periods to establish longitudinal baseline values. Activity was monitored continuously throughout the study by using the Philips Actiwatch Spectrum. (B) Blood collections by mobile phlebotomists were triggered within 24 hours and 48 hours of self-reported VOCs, with follow-up collections 72 hours after the VOC resolution. These collections occurred at the subject’s home or at the medical facility where the subject sought treatment. Baseline, non-VOC samples were restarted 2 weeks after resolution of the VOC (if blood volume limits were not exceeded). (C) Depicted is an example of a VOC event. A VOC event was described as a sequence of VOC days that can also include intermittent days with no pain crisis. The VOC event resolves when there are no VOC days for 2 consecutive study days.
Schematic of study design. (A) Study design for the 6-month longitudinal analysis of SCD patients (with and without hydroxyurea therapy) to document the natural history of self-reported VOCs. This innovative at-home study design used the ePRO tool for self-reported daily pain, fatigue, function, and medication. Pain, functionality, fatigue, and medications were recorded by using the e-diary. Participants recorded their experience of pain crisis in a 24-hour recall period. The ePRO documented real-time self-reported VOC days that tracked the patient’s treatment decisions (at home vs emergency department or hospital). Blood samples for biomarkers and clinical laboratory tests were drawn by a mobile phlebotomist in the subject’s home every 3 weeks during non-VOC periods to establish longitudinal baseline values. Activity was monitored continuously throughout the study by using the Philips Actiwatch Spectrum. (B) Blood collections by mobile phlebotomists were triggered within 24 hours and 48 hours of self-reported VOCs, with follow-up collections 72 hours after the VOC resolution. These collections occurred at the subject’s home or at the medical facility where the subject sought treatment. Baseline, non-VOC samples were restarted 2 weeks after resolution of the VOC (if blood volume limits were not exceeded). (C) Depicted is an example of a VOC event. A VOC event was described as a sequence of VOC days that can also include intermittent days with no pain crisis. The VOC event resolves when there are no VOC days for 2 consecutive study days.
The daily e-diary also included a pain severity scale, functionality as measured by a return to normal activity questionnaire, fatigue, nonmedical treatment, and medication use (supplemental Figure 1). Prior to use in this study, one-time, one-on-one qualitative interviews with adolescent and adult patients aged 12 to 64 years were conducted to ascertain concepts important to patients for content validity of the e-diary items, to obtain patient input into the development of the items, and to assess scale comprehension and relevance.12 The pain crisis module triggered at-home blood collections (within 24 hours of the initial event, with follow-up collections at 48 hours and 72 hours after VOC event resolution) using mobile phlebotomy (Figure 1B). Baseline non-VOC blood collections were conducted at 3-week intervals during the 6-month period.
Actigraphy
The Actiwatch 2 (Philips Respironics, Bend, OR) was used to objectively monitor the activity and sleep parameters of all study individuals. Participants used the Actiwatch 2 device for the entire study duration on a wrist band on the nondominant hand, excluding periods of charging the device. The total actigraphy recording time ranged from 7 to 179 days, with a median of 85 days; the data lost were due to technical issues as well as noncompliance. The Philips’ rapid actigraphy data analyzer (RADA) measures obtained are described in the supplemental Methods. RADA is a class II, US Food and Drug Administration–approved, 510k exempt product (US Food and Drug Administration Product code IKK).
Biomarkers and clinical laboratories
Blood samples for biomarkers, hematology, and chemistry laboratory tests were drawn at home using mobile phlebotomy (Sanguine BioSciences, Inc, Sherman Oaks, CA) or in the hospital if the patient chose medical utilization for a VOC. Baseline, non-VOC blood samples were obtained at study entry in the participant’s home and repeated every 3 weeks until completion of the study. When a patient reported onset of a VOC pain crisis on the ePRO device, a series of VOC blood collections were scheduled: the first within 24 hours, a second the following day, and a third sample collection after the VOC had resolved (patient reported 2 consecutive days of not having a VOC). A comprehensive panel of blood-based biomarkers (exploratory and standard clinical laboratory values) was assessed, including leukocyte-platelet aggregates, microfluidic flow adhesion assays, and circulating markers of cell adhesion, activation, inflammation, injury, and hemostasis; also assessed were clinical safety laboratory tests (supplemental Methods). For a more robust baseline value, biomarker baseline values for each subject were generated by averaging all baseline (non-VOC) blood collections throughout the evaluation period.
Statistical methods
Sample demographic characteristics, overall and by SCD (SCD, SC trait, and non-SCD), were summarized by using counts and percentages for categorized variables. The baseline biomarker levels were presented by SCD as geometric means with corresponding 95% confidence intervals and compared between SCD groups by using repeated measures analysis of variance. Repeated measures mixed models were used to evaluate changes from baseline in ePRO, actigraphy, and biomarker measures during a crisis, adjusting for each subject’s baseline value for each measure. The results of the analyses are presented as an estimate of change from baseline (for ePRO) or percent change from baseline (for actigraphy measures and biomarkers), corresponding 95% confidence intervals, and P values. Generalized additive models were used to evaluate raw actigraphy counts during a 24-hour day cycle, and the estimated 24-hour activity profiles are presented graphically. All analyses were performed by using SAS 9.4 (SAS Institute, Inc, Cary, NC) or R 3.5.0.12 In all analyses, P < .05 was considered significant, and no correction for multiplicity was done. Full descriptions are provided in the supplemental Methods.
Results
Patients and demographic characteristics
The study enrolled 37 participants with SCD (hemoglobin SS and S-β thalassemia0) aged between 13 and 48 years; 35 of these patients completed the study. Two participants discontinued the study, due to repeated missed appointments and not completing the daily ePRO or wearing of the actigraph. The study included comparable numbers of male and female subjects, participants with (n = 20) and without (n = 17) hydroxyurea therapy, and equal representation of adolescents aged 13 to 17 years, young adults aged 18 to 27 years, and adult participants aged ≥28 years (Table 1). A control population consisting of 10 SC trait (HbAS) and 4 non-SCD healthy control participants, all 14 of whom completed a 3-month observation period consisting of only biomarker monitoring, were also enrolled.
Demographic and baseline characteristics
| Characteristic | Total SCD sample (n = 37)* | SCD on hydroxyurea (n = 20) | SCD not on hydroxyurea (n = 17) | Non-SCD sample (n = 14) |
|---|---|---|---|---|
| Sex, no. (%) | ||||
| Male | 18 (49) | 12 (60) | 6 (35) | 3 (21) |
| Female | 19 (51) | 8 (40) | 11 (65) | 11 (79) |
| Age, no. (%) | ||||
| 13-17 y | 12 (32.5) | 5 (25) | 7 (41) | 3 (22) |
| 18-27 y | 13 (35) | 9 (45) | 4 (24) | 2 (14) |
| 28-48 y | 12 (32.5) | 6 (30) | 6 (35) | 7 (50) |
| 49-63 y | 0 | 0 | 0 | 2 (14) |
| Ethnicity, no. (%) | ||||
| Hispanic | 1 (3) | 1 (5) | 0 | 0 |
| Non-Hispanic | 36 (97) | 19 (95) | 17 (100) | 14 (100) |
| Genotype, no. (%) | ||||
| HbSS | 31 (84) | 18 (90) | 13 (76) | NA |
| HbS-β0 thalassemia | 6 (16) | 2 (10) | 4 (24) | NA |
| SC trait | NA | NA | NA | 10 (71) |
HbS-β0, hemoglobin sickle-β; HbSS, hemoglobin SS; NA, not applicable.
Thirty-five participants completed the study.
VOC events and event duration
The daily e-diary captured a patient-reported VOC pain crisis as a VOC day and the patient’s choice of treatment (Figure 1B; supplemental Study). A VOC event was described as a sequence of VOC days that can also include intermittent days with no pain crisis (Figure 1C). The VOC event resolves when there are no VOC days for 2 consecutive study days. The classification of a VOC event was defined by using the highest level of medical utilization during the event. The distribution of VOC events showed a median number of 8 annualized VOC events with a mean duration of 2.7 days (Figure 2A-B). There were 346 VOC days (Figure 2C) and 114 VOC events (Figure 2D). Of these, 20.5% of VOC days (7.5% direct/emergency department, 13% hospitalization) and 35.9% of VOC events (17.5% direct/emergency department, 18.4% hospitalization) were managed in a health care setting, and 1.2% of VOC days and 1.8% VOC events required indirect medical attention. For most VOC days (78.3%) and events (62.3%), patients self-treated in the home setting.
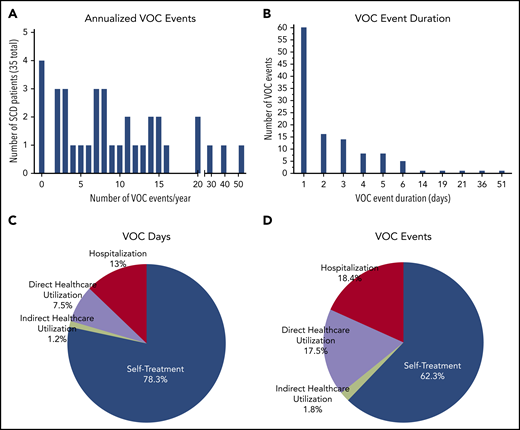
Patient-reported VOC events and VOC event duration, as captured by ePRO. (A) Annualized patient self-reported VOC events (median, 8 events per year). (B) Duration of VOC event (sum of the VOC day) reported by patient (mean, 2.7 days). Health care utilization for VOC days based on 346 VOC days (C) and events based on 114 events (D) were categorized as direct (± hospitalization), indirect, or self-treatment. Direct health care utilization resulted in hospitalization from the day of admission to the day of discharge for VOC. Direct health care utilization was a VOC that required an unscheduled “face-to-face” medical contact, including emergency department presentation of the patient (may be <24 hours). Indirect health care utilization was any day in which an unscheduled indirect medical utilization (eg, e-mail, call, or text to medical staff) occurred. Self-treatment VOCs were self-treated requiring no medical utilization. A VOC day is when the patient responds YES to the ePRO question “Did you have a pain crisis in the past 24 hours?” A VOC day was described as a single day when the patient reported having a crisis. The level of health care utilization depicted is the highest level reported for each VOC day or event.
Patient-reported VOC events and VOC event duration, as captured by ePRO. (A) Annualized patient self-reported VOC events (median, 8 events per year). (B) Duration of VOC event (sum of the VOC day) reported by patient (mean, 2.7 days). Health care utilization for VOC days based on 346 VOC days (C) and events based on 114 events (D) were categorized as direct (± hospitalization), indirect, or self-treatment. Direct health care utilization resulted in hospitalization from the day of admission to the day of discharge for VOC. Direct health care utilization was a VOC that required an unscheduled “face-to-face” medical contact, including emergency department presentation of the patient (may be <24 hours). Indirect health care utilization was any day in which an unscheduled indirect medical utilization (eg, e-mail, call, or text to medical staff) occurred. Self-treatment VOCs were self-treated requiring no medical utilization. A VOC day is when the patient responds YES to the ePRO question “Did you have a pain crisis in the past 24 hours?” A VOC day was described as a single day when the patient reported having a crisis. The level of health care utilization depicted is the highest level reported for each VOC day or event.
Pain, functionality, and fatigue
Study participants with SCD (N = 35) self-reported their pain, functionality, and fatigue by using the ePRO device during 114 self-reported VOC events (0-51 per subject), and these data were compared with ePRO outcomes on non-VOC days, adjusting for individual baselines (Figure 3). All VOCs and all at-home VOC day pain scores were significantly higher than non-VOC pain scores. VOC and at-home VOC day physical, social, and functionality scores were significantly reduced compared with non-VOC day scores. Self-care functionality was significantly reduced for all VOC days but not for at-home VOC days compared with non-VOC days. Fatigue score was significantly higher during all VOC days and at-home VOC days compared with non-VOC days. Overall patient compliance using the ePRO device was 67%.
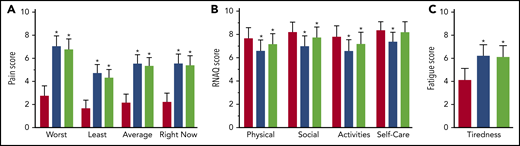
ePRO secondary end points: pain, functionality, and fatigue during VOC days. (A) The severity scale included 4 items for worst, least, and average pain in the last 24 hours, and pain right now as reported by the subject, scored 1 (least) to 10 (worst). (B) The functional health status was based on activities of daily living/return to normal activity as recorded in the Return to Normal Activity Questionnaire (RNAQ). It was scored as 1 (cannot do at all) to 10 (can do as usual) and included 4 measures: physical, social, self-care, and daily activities. (C) The fatigue score was scaled from 1 (least fatigue) to 10 (worst fatigue) according to the tiredness Numerical Rating Scale. Pain, fatigue, and RNAQ used an 11-point numerical rating scale. Patient-reported outcomes on non-VOC days were compared with those on VOC days by using a mixed model approach adjusting for baseline. Results are reported as means with 95% confidence intervals. Red bars, non-VOC days; blue bars, all VOC days; green bars, at-home VOC days. *P < .001.
ePRO secondary end points: pain, functionality, and fatigue during VOC days. (A) The severity scale included 4 items for worst, least, and average pain in the last 24 hours, and pain right now as reported by the subject, scored 1 (least) to 10 (worst). (B) The functional health status was based on activities of daily living/return to normal activity as recorded in the Return to Normal Activity Questionnaire (RNAQ). It was scored as 1 (cannot do at all) to 10 (can do as usual) and included 4 measures: physical, social, self-care, and daily activities. (C) The fatigue score was scaled from 1 (least fatigue) to 10 (worst fatigue) according to the tiredness Numerical Rating Scale. Pain, fatigue, and RNAQ used an 11-point numerical rating scale. Patient-reported outcomes on non-VOC days were compared with those on VOC days by using a mixed model approach adjusting for baseline. Results are reported as means with 95% confidence intervals. Red bars, non-VOC days; blue bars, all VOC days; green bars, at-home VOC days. *P < .001.
Actigraphy
Feedback from actigraph monitors continuously measured movement frequency to determine the longitudinal changes in hourly averaged activity (counts per minute) during a self-reported VOC day (Figure 4A; supplemental Table 2). The amount and dynamic range of activity over a 24-hour period during medical contact VOC days was decreased compared with the non-VOC day or at-home VOC day. At-home VOC day activity was more like non-VOC day over the 24-hour period, but the daytime activity from hour 13 to hour 23 was consistently lower. Data derived from the Philip’s RADA algorithm found that compared with non-VOC day, a statistically significant reduction in average daytime activity during both at-home VOC day (7% reduction) and any VOC day (14% reduction) was observed (Figure 4B). Total rest time during the day was significantly higher for both any VOC day and at-home VOC day compared with non-VOC day (31% and 23% increase, respectively). Disturbance of sleep at night showed (Figure 4C) a significant increase in average activity by 14% for any VOC day and by 7%, not quite reaching statistical significance, for at-home VOC day . Total sleep time was significantly reduced during both any and at-home VOC days (6% and 7% reduction).
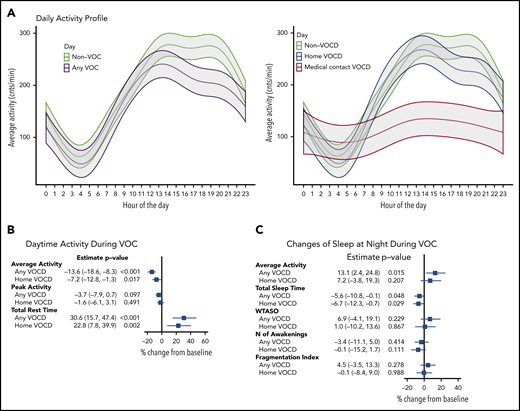
Activity changes with patient-reported VOC analyzed by using actigraphy monitoring. (A) Raw activity counts per minute were averaged for each hour of the day. Twenty-four-hour actigraphy profiles were analyzed by using a generalized additive model with type of the day included as a parametric component (presented by different color) and accounting for correlation of the data within participants. The shaded areas present 95% confidence region around the mean estimate. (B-C) Rapid Actigraphy Data Analyzer (RADA) data results. Percent change in activity measures from non-VOC baseline to VOC days, adjusted for baseline, was analyzed by using a mixed model approach. Measures are log-transformed for analyses. Results are reported as percent change with 95% confidence interval. MFI, movement and fragmentation intex (sum of percent mobile and percent 1-minute immobile bouts divided by number of immobile bouts per interval); VOCD, VOC day; WTASO, wake time after sleep onset (total number of epochs between start and end time of sleep interval scored as wake multiplied by epoch length).
Activity changes with patient-reported VOC analyzed by using actigraphy monitoring. (A) Raw activity counts per minute were averaged for each hour of the day. Twenty-four-hour actigraphy profiles were analyzed by using a generalized additive model with type of the day included as a parametric component (presented by different color) and accounting for correlation of the data within participants. The shaded areas present 95% confidence region around the mean estimate. (B-C) Rapid Actigraphy Data Analyzer (RADA) data results. Percent change in activity measures from non-VOC baseline to VOC days, adjusted for baseline, was analyzed by using a mixed model approach. Measures are log-transformed for analyses. Results are reported as percent change with 95% confidence interval. MFI, movement and fragmentation intex (sum of percent mobile and percent 1-minute immobile bouts divided by number of immobile bouts per interval); VOCD, VOC day; WTASO, wake time after sleep onset (total number of epochs between start and end time of sleep interval scored as wake multiplied by epoch length).
SCD biomarkers
Biomarkers were evaluated to establish the relationship between biomarkers shown to have a role in SCD biology and the self-reported VOC event/VOC day. Longitudinal sampling (3-7 collections per participant) of SCD, SCD trait, and non-SCD participants generated individual baseline values for each participant that incorporated longitudinal variability. Biomarker levels from SCD participants on baseline, non-VOC days were compared with levels from SCD trait and non-SCD participants (Table 2). Additional biomarker analysis compared an individual SCD participant’s baseline, non-VOC levels vs their own levels collected on VOC days. Analysis of monocyte- and neutrophil-platelet aggregates showed increases in size (mean fluorescence intensity) in SCD participants compared with SCD trait participants. The percentage of cellular aggregates further increased (by 24.9% to 29.9%) on VOC days (Figure 5A) in SCD participants. Adhesion of whole blood samples under physiological flow to both P-selectin and VCAM-1 were elevated in stable SCD patient participants compared with SCD trait participants. The adhesion of whole blood and white blood cells to P-selectin, but not to VCAM-1, was significantly higher on VOC days. Soluble levels of E-selectin, P-selectin, and VCAM-1 were elevated at baseline in SCD vs SCD trait and non-SCD participants; however, these were not elevated on VOC days (data not shown). A clinical chemistry panel found elevated baseline levels of hemoglobin F, bilirubin, and lactate dehydrogenase (LDH), whereas hemoglobin was reduced in SCD compared with SCD trait participants. Further increases in bilirubin (9.8%) and LDH (11.0%) were observed on VOC days in SCD participants (Figure 5B).
A comparison of baseline, non-VOC values by SCD (HbSS, HbS-β0), SC trait (HbAS), and non-SCD (HbA) status
| Biomarker | SCD geometric mean (95% CI) | SC trait geometric mean (95% CI) | Non-SCD geometric mean (95% CI) | P | |||
|---|---|---|---|---|---|---|---|
| Overall | SC trait vs non-SCD | SCD vs non-SCD | SCD vs SC trait | ||||
| Functional cellular adhesion | |||||||
| Monocyte-platelet aggregates, % | 32.56 (27.62, 38.38) | 23.33 (16.78, 32.44) | 19.65 (11.67, 33.09) | .060 | |||
| Monocyte-platelet aggregates, MFI | 128.47 (114.91, 143.64) | 87.49 (69.16, 110.67) | 79.34 (54.71, 115.06) | .002 | .659 | .016 | .004 |
| Neutrophil-platelet aggregates, % | 12.35 (10.38, 14.68) | 10.37 (7.32, 14.69) | 9.00 (5.19, 15.61) | .418 | |||
| Neutrophil-platelet aggregates, MFI | 63.78 (58.59, 69.42) | 44.40 (37.10, 53.14) | 38.04 (28.64, 50.53) | <.001 | .362 | .001 | .001 |
| Whole blood adhesion to VCAM-1, adherent cells/mm2 | 287.68 (236.84, 349.44) | 57.01 (39.12, 83.09) | 65.35 (36.06, 118.41) | <.001 | .699 | <.001 | <.001 |
| White blood cell adhesion to VCAM-1, adherent cells/mm2 | 404.17 (377.14, 433.14) | 438.65 (376.09, 511.62) | 510.24 (400.05, 650.78) | .145 | |||
| Whole blood adhesion to P-selectin, adherent cells/mm2 | 28.61 (24.35, 33.62) | 13.37 (9.54, 18.72) | 21.79 (12.83, 37.01) | .001 | .125 | .329 | <.001 |
| White blood cell adhesion to P-selectin, adherent cells/mm2 | 110.51 (95.09, 128.42) | 88.44 (64.16, 121.89) | 99.20 (59.73, 164.76) | .443 | |||
| Soluble E-selectin, ng/mL | 20.07 (17.10, 23.56) | 9.29 (6.88, 12.56) | 5.79 (3.59, 9.31) | <.001 | .097 | <.001 | <.001 |
| Soluble P-selectin, ng/mL | 110.05 (99.64, 121.56) | 81.02 (67.04, 97.92) | 74.76 (55.43, 100.83) | .004 | .650 | .017 | .006 |
| Soluble VCAM-1, ng/mL | 947.2 (826.9, 1084.9) | 461.4 (357.1, 596.1) | 551.0 (367.6, 826.0) | <.001 | .460 | .014 | <.001 |
| Clinical chemistries | |||||||
| Hemoglobin, g/dL | 8.27 (7.83, 8.74) | 12.19 (11.00, 13.51) | 13.75 (11.69, 16.18) | <.001 | .215 | <.001 | <.001 |
| Hemoglobin F, % | 8.16 (5.81, 11.47) | 0.10 (0.05, 0.19) | 0.23 (0.08, 0.62) | <.001 | .168 | <.001 | <.001 |
| Bilirubin, total, mg/dL | 2.44 (2.01, 2.96) | 0.31 (0.21, 0.44) | 0.34 (0.19, 0.60) | <.001 | .788 | <.001 | <.001 |
| LDH, U/L | 528.95 (473.89, 590.40) | 206.11 (167.38, 253.80) | 202.69 (145.83, 281.71) | <.001 | .932 | <.001 | <.001 |
| Cellular blood counts | |||||||
| Platelets, k/cu mm | 337.53 (305.72, 372.65) | 290.79 (240.36, 351.79) | 213.77 (158.15, 288.94) | .014 | .089 | .006 | .169 |
| Eosinophil, % | 2.52 (1.81, 3.52) | 1.46 (0.77, 2.78) | 3.72 (1.34, 10.35) | .213 | |||
| Lymphocyte, % | 33.33 (30.58, 36.33) | 35.06 (29.71, 41.38) | 45.69 (35.16, 59.38) | .080 | |||
| Absolute monocyte count, k/cu mm | 1.00 (0.87, 1.14) | 0.40 (0.31, 0.52) | 0.35 (0.23, 0.52) | <.001 | .529 | <.001 | <.001 |
| Monocyte, % | 10.11 (9.14, 11.19) | 5.94 (4.90, 7.20) | 6.33 (4.66, 8.58) | <.001 | .725 | .005 | <.001 |
| Absolute neutrophil count, k/cu mm | 4.73 (4.23, 5.29) | 3.57 (2.88, 4.44) | 2.28 (1.62, 3.22) | <.001 | .031 | <.001 | .025 |
| Neutrophil, % | 47.83 (44.69, 51.18) | 54.32 (47.69, 61.86) | 40.87 (33.27, 50.22) | .059 | |||
| Nucleated red blood cells, k/cu mm | 0.09 (0.05, 0.16) | 0.00 (0.00, 0.00) | 0.00 (0.00, 0.01) | <.001 | .928 | <.001 | <.001 |
| Soluble inflammatory/cytokines/ markers | |||||||
| CRP, mg/L | 3.87 (2.97, 5.05) | 4.63 (2.77, 7.72) | 1.45 (0.64, 3.26) | .053 | |||
| IL-10, pg/mL | 1.72 (1.56, 1.89) | 0.70 (0.58, 0.85) | 0.65 (0.48, 0.88) | <.001 | .684 | <.001 | <.001 |
| TN-α, pg/mL | 1.78 (1.60, 1.99) | 0.93 (0.75, 1.16) | 0.93 (0.66, 1.31) | <.001 | .992 | .001 | <.001 |
| IL-6, pg/mL | 3.39 (2.24, 5.13) | 2.20 (1.00, 4.80) | 0.92 (0.27, 3.18) | .116 | |||
| Coagulation markers | |||||||
| D-dimer, µg/L | 1.26 (0.98, 1.61) | 0.42 (0.26, 0.66) | 0.25 0.12, 0.53) | <.001 | .259 | <.001 | <.001 |
| Prothrombin fragment 1+2, pmol/L | 300.53 (256.56, 352.03) | 193.51 (142.81, 262.22) | 112.31 (69.51, 181.45) | <.001 | .060 | <.001 | .013 |
| TAT complex, µg/L | 7.11 (6.20, 8.16) | 3.11 (2.35, 4.11) | 2.40 (1.55, 3.73) | <.001 | .329 | <.001 | <.001 |
| Tissue factor, pg/mL | 29.42 (26.15, 33.10) | 36.28 (29.08, 45.27) | 22.03 (15.53, 31.25) | .053 | |||
HbS-β0, hemoglobin sickle-β; HbSS, sickle cell hemoglobin; MFI, mean fluorescence intensity.
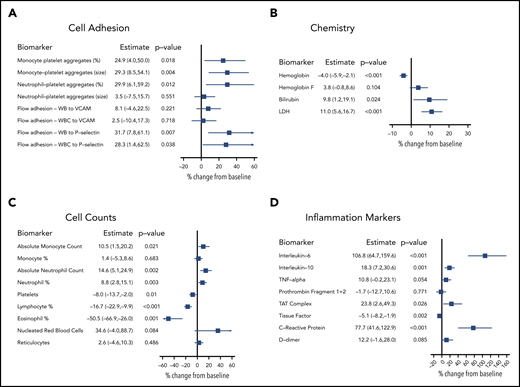
Changes in biomarkers during patient-reported VOC. Percent change in biomarkers from non-VOC baseline to VOC days, adjusted for baseline, was analyzed by using a mixed model approach. Measures were log-transformed for analyses. (A) Cell adhesion; (B) chemistry; (C) cell counts; (D) inflammation markers. Results are reported as percent change with 95% confidence interval. WB, whole blood; WBC, white blood cell.
Changes in biomarkers during patient-reported VOC. Percent change in biomarkers from non-VOC baseline to VOC days, adjusted for baseline, was analyzed by using a mixed model approach. Measures were log-transformed for analyses. (A) Cell adhesion; (B) chemistry; (C) cell counts; (D) inflammation markers. Results are reported as percent change with 95% confidence interval. WB, whole blood; WBC, white blood cell.
Elevations in absolute monocyte and neutrophil counts were observed in SCD participants at baseline (Table 2) and minor (<15%) elevations during VOC days (Figure 5C). Levels of platelets and eosinophils were comparable at baseline and were reduced by 8% and 50.5%, respectively, on VOC days in SCD participants. Nucleated red blood cells were elevated at baseline and further elevated by 34.6% in VOC day samples. Measurement of soluble inflammatory biomarkers found unaltered levels of both interleukin-6 (IL-6) and C-reactive protein (CRP) at baseline in participants with SCD that were elevated on VOC days (106.8% for IL-6 and 77.7% for CRP) (Figure 5D). Baseline levels of IL-10 and tumor necrosis factor (TNF)-α were elevated at baseline but only modestly elevated (18.3% for IL-10 and 10.8% for TNF-α) on VOC days. In a panel of coagulation markers, D-dimer, prothrombin fragment 1+2, and thrombin–antithrombin (TAT) complexes were elevated at baseline, and a 23.8% increase in TAT complexes and a 12% increase (P = .085) in D-dimer were observed in VOC day samples.
Discussion
This innovative at-home study design shows the feasibility of monitoring out-of-hospital pain, the use of patient-reported VOC day and mobile phlebotomy, and links actigraphy and biomarkers to patient’s self-reported pain crisis. The ELIPSIS study involved longitudinal assessment and sampling to establish individual baseline values for each SCD patient across a panel of ePRO, actigraphy, and biomarker measures. To describe a more patient-centered experience, these longitudinal measures were agnostic to medical utilization and spanned at-home to hospital visits. The utility and feasibility of the VOC day end point through daily ePRO reporting revealed several favorable attributes, as the baseline ePRO levels were consistent throughout the 6 months of evaluation. This study found that patients with SCD experienced a median of 8 annualized VOC events that had a mean duration of 2.7 days. Most of these events (63%) were reported outside the scope of medical utilization. In agreement with the self-reporting of a VOC, the patients reported significant changes in daily pain, fatigue, and daily function, regardless of degree of medical utilization. Additional longitudinal analysis revealed significant changes in daily activity and circulating biomarkers of hemolysis, inflammation, adhesion, and coagulation, which further support the validity of the patient-reported VOC event.
The ELIPSIS e-diary was developed based on previous SCD studies using a paper diary or Web-based diary.9,10,13 Electronically reported outcome devices allow collection of real-time data on the patient experience. In the ELPSIS study, completion of the e-diary declined from 84% in the first month of the study; overall patient compliance over the 6 months was 67% on average. Decreases in ePRO compliance over time has been observed in other studies.14,15 The ELIPSIS study provides guidance for improvement and mitigation strategies to maintain a high level of compliance in further studies with the ePRO.
In ELIPSIS, the majority of patients self-reporting a VOC manage the crisis at home, which is consistent with the results of the PiSCES trial.9,10 In PiSCES, the frequency of patient-reported pain was also higher than that captured by health care providers and was largely managed at home. Patients (aged ≥16 years) in the PiSCES study used a daily paper diary to record maximum pain, pain crisis, and medical utilization. The study enrolled 308 patients, with 232 patients contributing to the 31 017 analyzed patient-days in which pain on a total of 54.5% of days was reported; 12.7% of patient-days were reported as pain crisis managed at home and medical utilization on 3.5% of patient-days.
The data from the ELIPSIS study, consistent with those from the PiSCES study, indicate that medical utilization VOCs represent a minority of all VOC event types and therefore underestimate the total burden of VOC events.
In addition to ePRO VOC day, actigraphy may be a useful tool in clinical studies because it provides 24-hour monitoring of the patient’s activity. Subjective and diary reports of sleep and sleep quality have been used historically to determine patterns of altered sleep, but these methodologies may not capture the minutiae necessary to abundantly depict a unidirectional causation pattern between altered sleep and pain. Objective measures of activity and sleep pattern and quality can be obtained by actigraphy.16,17 These devices, such as in the form of a watch-like device, can be worn discreetly for long periods of time. The relationship of sleep and pain has been extensively studied in SCD, and there are multiple reasons to have disrupted sleep, ranging from neurologic to pulmonary comorbidities. Both adult and pediatric SCD populations have described difficulty with sleep onset and maintenance in separate studies.18-20 In a recent study, 50 individuals with SCD were monitored over 7 days with aged-matched control subjects using a wearable hip device; the results showed an increase in sedentariness in the patients with SCD.21 In this study, the measurement of daily activity using an actigraph device further supports the concept that VOC events, whether at home or in a hospital setting, diverge from the normal daily activity patterns. Although chronic pain states have been shown to alter daily activity,22 this is the first demonstration, to our knowledge, of alterations in daily activity during an acute at-home VOC event and corroborates the pain, fatigue, and daily function alterations captured by the ePRO. This study highlights the potential future use of daily activity data as a tool for monitoring (or possibly predicting) VOC onset, severity, and/or resolution.
Although no validated biomarkers for VOCs in SCD exist, several studies have identified candidate biomarkers that are either elevated in SCD participants during stable, non-VOC days,23,24 or are elevated in SCD participants experiencing a VOC compared with a separate cohort of non-VOC control subjects.25 The ELIPSIS study takes the biomarker comparison a step further by establishing individual baseline values for each participant through 6-month longitudinal sampling as opposed to a single sample baseline from the entire population. Establishing definitive baseline biomarker levels provides a basis to assess changes associated with self-reported VOC day or VOC event. Whole blood, as well as isolated white blood cell adhesion to P-selectin, the percentage of monocyte-platelet and neutrophil-platelet aggregates, and monocyte-platelet aggregate size, were all significantly increased during the VOC day. Inflammation is involved in the pathogenesis of SCD. One feature is that heterotypic interactions of sickle erythrocytes, neutrophils, monocytes, and platelets are believed to be a fundamental component of VOC pathophysiology. Activated platelets can adhere to monocytes and neutrophils, resulting in cell activation and formation of cell-platelet aggregates.26 The activation of monocytes and neutrophils subsequently upregulates the inflammatory mediators (eg, TNF-α, IL-1). This action contributes to the initiation of cell adhesion and recruitment on endothelium and the propagation of vaso-occlusive processes, as well as soluble inflammatory biomarkers (IL-6, IL-10, C-reactive protein, and TNF-α), consistent with the proposition that the VOCs are acute pro-inflammatory events.23,27-30
There were also correlations with common clinical laboratory values (hemoglobin, percent eosinophils, absolute monocyte count, absolute neutrophil count, neutrophil percent, platelet counts, lymphocyte, percent, bilirubin, and LDH), as well as coagulation markers (TAT and D-dimer).
These findings represent a link between a self-reported VOC event and markers of the underlying pathophysiology. One limitation of this study is the small number of patients and the fact the study was conducted at a single site. These data should be interpreted in the patient group studied, and the results may not be applicable to those not in the age range studied or in other geographic, demographic, genotypic, or phenotypic categories. In addition, the use of the VOC day as an end point and actigraphy will need further analysis in clinical trials in the context of randomized controlled treatment studies. This study addresses the priority set out by the US Food and Drug Administration and the American Society of Hematology to identify potential pharmacodynamic biomarkers and surrogate end points, including patient-reported outcomes in SCD.31,32
In summary, the ELIPSIS study shows the potential and feasibility of a more patient-centered, longitudinal assessment of SCD VOC events that are not dependent on medical utilization because at-home VOCs also affect patients and are important to the patient’s overall well-being, and their reduction would be clinically meaningful. The validity of the at-home VOC day was supported by significant changes in ePRO pain, fatigue, and daily function. The ePRO changes were corroborated by significant changes in daily activity monitored by using wearable actigraph devices. Finally, a panel of biomarkers representing the VOC pathophysiology, including monocyte- and neutrophil-platelet aggregates, blood cell adhesion indices, bilirubin, LDH, nucleated red blood cells, IL-6, CRP, and TAT complexes, were found to be significantly altered during these self-reported VOC events. The use of mobile phlebotomy enabled a more patient-centric approach with blood draws in a home setting. The presently described successful integration of longitudinal ePRO, actigraph, and biomarker data has identified the compelling potential of future use of these parameters in clinical studies of patients with SCD, including therapeutic studies.
The authors confirm that the full data supporting the findings of this study are available within the article.
The online version of this article contains a data supplement.
The publication costs of this article were defrayed in part by page charge payment. Therefore, and solely to indicate this fact, this article is hereby marked “advertisement” in accordance with 18 USC section 1734.
Acknowledgments
The authors acknowledge all patients and individuals who contributed to the study. They also thank Sanguine BioSciences, Clinical Ink, and CRF Health for their expertise and efforts to make this study possible. Editorial assistance was provided by Teri O’Neill of Peloton Advantage, LLC, an OPEN Health company, and funded by Pfizer Inc.
This study was sponsored by Pfizer Inc.
Authorship
Contribution: D.D.P., P.C.H., D.B., and D.R. contributed to study design, data analysis, and manuscript preparation; A.L.F. and A.D.M. contributed to data analysis and manuscript preparation; K.L. contributed to the flow adhesion data analysis; X.G. performed all flow adhesion assays and contributed to analysis of the biomarker data; J.W. participated in flow experiments and data analysis; A.U.Z. contributed to actigraph data analysis and interpretation; R.J.C. contributed to the study design and data collection; M.U.C. was the lead investigator and contributed to the study design and manuscript preparation; and all authors contributed to interpretation of the data, participated in the critical review and revision of the manuscript, provided approval of the final manuscript, and had access to the data and assume responsibility for the completeness and accuracy of the data and data analyses.
Conflict-of-interest disclosure: D.D.P., D.B., D.R., and R.J.C. are employees of Pfizer Inc. P.C.H., K.L., X.G., and J.W. are employees of Functional Fluidics. A.L.F. has received grants from Argenx, Baxalta, Eisai, Eli Lilly & Daiichi Sankyo, Ionis, Ironwood, Medtronic, Pfizer, and Sysmex; and has received grants and personal fees from Surface Oncology. A.D.M. has received grants from Argenx, Baxalta, Eisai, Eli Lilly & Daiichi Sankyo, Ionis, Ironwood, Medtronic, Pfizer, and Sysmex; has received personal fees from AstraZeneca; and has received grants and personal fees from Surface Oncology. A.U.Z. has received personal fees from Novartis; is on a speakers bureau and has received grants and personal fees from Global Blood Therapeutics; and has received personal fees from Emmaus Medical. M.U.C. has received grants and personal fees from Bayer, Biomarin, Global Blood Therapeutics, HEMA Biologics, Kedrion, Octapharma, Pfizer, Roche/Genentech, Sanofi/Bioverativ, Spark Therapeutics, and Takeda.
Correspondence: Michael U. Callaghan, Central Michigan University, Sickle Center, Children’s Hospital of Michigan, Detroit, 3rd Floor Carls Bldg, 3901 Beaubien, Detroit, MI 48201; e-mail: calla1mu@cmich.edu.
