

Key Points
Microbiota injury is observed in recipients of auto-HCT.
Lower periengraftment diversity in fecal samples is associated with worse overall and progression-free survival in auto-HCT patients.

Abstract
We previously described clinically relevant reductions in fecal microbiota diversity in patients undergoing allogeneic hematopoietic cell transplantation (allo-HCT). Recipients of high-dose chemotherapy and autologous HCT (auto-HCT) incur similar antibiotic exposures and nutritional alterations. To characterize the fecal microbiota in the auto-HCT population, we analyzed 1161 fecal samples collected from 534 adult recipients of auto-HCT for lymphoma, myeloma, and amyloidosis in an observational study conducted at 2 transplantation centers in the United States. By using 16S ribosomal gene sequencing, we assessed fecal microbiota composition and diversity, as measured by the inverse Simpson index. At both centers, the diversity of early pretransplant fecal microbiota was lower in patients than in healthy controls and decreased further during the course of transplantation. Loss of diversity and domination by specific bacterial taxa occurred during auto-HCT in patterns similar to those with allo-HCT. Above-median fecal intestinal diversity in the periengraftment period was associated with decreased risk of death or progression (progression-free survival hazard ratio, 0.46; 95% confidence interval, 0.26-0.82; P = .008), adjusting for disease and disease status. This suggests that further investigation into the health of the intestinal microbiota in auto-HCT patients and posttransplant outcomes should be undertaken.
Introduction
High-dose chemotherapy followed by autologous hematopoietic cell transplantation (auto-HCT) is a therapeutic strategy that prolongs overall survival (OS) and progression-free survival (PFS) in patients with multiple myeloma.1,2 Auto-HCT is used as first-line therapy for mantle cell lymphoma and peripheral T-cell lymphoma, as well as salvage therapy for relapsed/refractory diffuse large B-cell lymphoma and Hodgkin lymphoma.3-6 The most common cause of treatment failure after auto-HCT is relapse or progression of the underlying disease (POD).7 Specific toxicities in auto-HCT vary by conditioning regimen and include diarrhea, mucositis, bloodstream infections, and organ toxicity.8-11 For example, high-dose melphalan conditioning for patients with multiple myeloma induces diarrhea in up to 70% to 80% of cases. Up to 60% of patients develop grade 2 diarrhea, as scored by the National Cancer Institute Common Terminology Criteria for Adverse Events criteria.12,13 The reported incidence of transplant-related mortality is up to 3%,14-16 attributable to infections and organ toxicity.
The intestinal microbiome is a complex community consisting of trillions of microbes that inhabit the mammalian gastrointestinal tract and fundamentally influence host physiology.17-19 We and others have described that patients undergoing allogeneic HCT (allo-HCT) exhibit loss of fecal diversity and anaerobic commensal taxa and domination by potentially pathogenic organisms.20-24 Loss of fecal diversity, as well as increased abundance of members of genus Enterococcus have been associated with graft-versus-host disease (GVHD),20-23 bloodstream infections,25 and shorter OS after allo-HCT.24,26 Increased abundance of a cluster of related bacteria including Eubacterium limosum was associated with decreased risk of relapse or POD.27 Increased proportions of Blautia were associated with reduced lethality of acute GVHD and improved OS.28 Higher abundances of butyrate-producing bacteria have also been associated with a lower incidence of lower respiratory tract infection in this patient population.29
Auto-HCT and allo-HCT recipients share many exposures that might affect the composition of their intestinal microbiota, including myeloablative chemotherapy, impaired gut barrier function due to mucositis, antibiotic therapy, and disruption of normal nutrition.30-34 However, auto-HCT patients have low rates of transplant-related mortality and do not develop GVHD. Understanding microbiota composition and dynamics in auto-HCT patients may provide information on the effects of high-dose chemotherapy on fecal diversity and clinical outcomes without the confounding influence of alloreactivity. We hypothesized that auto-HCT is associated with microbiota injuries similar to those in allo-HCT and that the degree of dysbiosis is associated with survival after auto-HCT. Here, we describe our observations and associate microbiota features with PFS and OS in a large multicenter cohort of auto-HCT patients.
Methods
We included all adult recipients of auto-HCT for lymphoma, myeloma, or amyloidosis in an observational study at 2 centers, Memorial Sloan Kettering Cancer Center (MSKCC) and Duke University Medical Center (Duke), between June 2010 and June 2018. They received myeloablative chemotherapy and had at least 1 evaluable stool sample collected between day –30 and day +100 of their first auto-HCT (Figure 1A). In analyses that focused on early pretransplant samples, we considered samples collected between days −15 and −3. In global, longitudinal analyses, we considered any evaluable sample from day −30 to day 100 (supplemental Table 1, available on the Blood Web site). Samples collected after a second transplant (including planned tandem auto-HCT), after allo-HCT, or after chimeric antigen receptor T-cell therapy subsequent to auto-HCT were excluded (supplemental Table 1). All patients provided written informed consent for biospecimen collection in accordance with protocols from local institutional review boards. The standard antibiotic prophylaxis for auto-HCT recipients at both centers was ciprofloxacin (orally as tolerated, otherwise intravenously), which started at the beginning of conditioning at Duke and at either day −2 or upon development of neutropenia at MSKCC. Ciprofloxacin was continued until engraftment, after which it was discontinued, or when febrile neutropenia was diagnosed, which resulted in the initiation of a broad-spectrum antibiotic.
![OS and PFS in auto-HCT patients is correlated with perineutrophil engraftment fecal diversity. (A) Histogram of sample collection times relative to transplantation for 1161 samples from 534 unique patients. (B) Fecal diversity, as measured by 16S sequencing and the inverse Simpson index, declined comparably at both institutions during the course of transplantation in 841 samples from 384 unique patients at MSKCC and 207 samples from 121 unique patients at Duke. Each point represents a stool sample color coded by institution. Curves are loess-smoothed averages. The y-axis was square-root scaled using the scale_y_sqrt function of the R package ggplot2. The same data are plotted together with samples through day 100 in supplemental Figure 1. (C) Fecal diversity in early pretransplant samples (defined as the earliest sample available per patient during days −15 to −3) was lower than the median diversity of 313 samples from 212 healthy participants of the HMP and 34 samples from 34 healthy MSKCC volunteers. The data from HMP and healthy MSKCC volunteers have been previously published24 and are reused here as controls. MSKCC includes 70 samples from 70 unique patients and Duke includes 38 samples from 38 unique patients. MSKCC healthy volunteer median was 15.87 (standard error [SE], 1.39), HMP median was 12.05 (SE, 0.50), MSKCC auto-HCT median was 9.39 (SE, 0.67), and Duke median was 9.68 (SE, 1.04). Another pretransplant window is used in supplemental Figure 6. The ends of the whisker lines represent the minimum and maximum values within 1.5× the interquartile range. (D) Patients with higher diversity in available perineutrophil engraftment (days +9 to +16) samples are at a reduced risk of progression or death. Patients were split into above-median (high-diversity) and below-median (low-diversity) groups in each of these day +17 landmark analyses by using the median inverse Simpson index (4.03) as the cutoff value. In all, 181 MSKCC and 59 Duke patients’ samples were analyzed. Analyses of diversity as a continuous variable and multivariable models are provided in supplemental Table 4 and analyses of pretransplant therapies are provided in supplemental Figure 6.](https://ash.silverchair-cdn.com/ash/content_public/journal/blood/137/11/10.1182_blood.2020006923/1/m_bloodbld2020006923f1.png?Expires=1769122646&Signature=4pYZez6E9FQzaF5C2fO~uK1grAzlmqkHqxHq0BMZzjehbrkaZ~N2dPmsYg06vgyGV92fr~iB-cM~zRbkI~D7jZNkC1UDNAN~45Ede7aPP5SIsBi31ooY8ohDwraZcGLz3jrkr1T2rY2~rVWqtxh1V1t~hLNUqIQ4CC4DkX7BdpGtn8Wi~x4u9h2U4Cp6l0EowwfDZ21pAIlRR7C85MqCuLH0D8SSMeidI-0nIzdYLC1c4KQRQq3eVivuAN1gAztFtp-uIbu2ZKY2oi0MEfU5Wb~b2YKHxvBehLw8T-Ql6re4OAk1e~CyNgEE186qZmMnoU6Xk2ozaeAvpGxjUe8~kQ__&Key-Pair-Id=APKAIE5G5CRDK6RD3PGA)
OS and PFS in auto-HCT patients is correlated with perineutrophil engraftment fecal diversity. (A) Histogram of sample collection times relative to transplantation for 1161 samples from 534 unique patients. (B) Fecal diversity, as measured by 16S sequencing and the inverse Simpson index, declined comparably at both institutions during the course of transplantation in 841 samples from 384 unique patients at MSKCC and 207 samples from 121 unique patients at Duke. Each point represents a stool sample color coded by institution. Curves are loess-smoothed averages. The y-axis was square-root scaled using the scale_y_sqrt function of the R package ggplot2. The same data are plotted together with samples through day 100 in supplemental Figure 1. (C) Fecal diversity in early pretransplant samples (defined as the earliest sample available per patient during days −15 to −3) was lower than the median diversity of 313 samples from 212 healthy participants of the HMP and 34 samples from 34 healthy MSKCC volunteers. The data from HMP and healthy MSKCC volunteers have been previously published24 and are reused here as controls. MSKCC includes 70 samples from 70 unique patients and Duke includes 38 samples from 38 unique patients. MSKCC healthy volunteer median was 15.87 (standard error [SE], 1.39), HMP median was 12.05 (SE, 0.50), MSKCC auto-HCT median was 9.39 (SE, 0.67), and Duke median was 9.68 (SE, 1.04). Another pretransplant window is used in supplemental Figure 6. The ends of the whisker lines represent the minimum and maximum values within 1.5× the interquartile range. (D) Patients with higher diversity in available perineutrophil engraftment (days +9 to +16) samples are at a reduced risk of progression or death. Patients were split into above-median (high-diversity) and below-median (low-diversity) groups in each of these day +17 landmark analyses by using the median inverse Simpson index (4.03) as the cutoff value. In all, 181 MSKCC and 59 Duke patients’ samples were analyzed. Analyses of diversity as a continuous variable and multivariable models are provided in supplemental Table 4 and analyses of pretransplant therapies are provided in supplemental Figure 6.
OS and PFS in auto-HCT patients is correlated with perineutrophil engraftment fecal diversity. (A) Histogram of sample collection times relative to transplantation for 1161 samples from 534 unique patients. (B) Fecal diversity, as measured by 16S sequencing and the inverse Simpson index, declined comparably at both institutions during the course of transplantation in 841 samples from 384 unique patients at MSKCC and 207 samples from 121 unique patients at Duke. Each point represents a stool sample color coded by institution. Curves are loess-smoothed averages. The y-axis was square-root scaled using the scale_y_sqrt function of the R package ggplot2. The same data are plotted together with samples through day 100 in supplemental Figure 1. (C) Fecal diversity in early pretransplant samples (defined as the earliest sample available per patient during days −15 to −3) was lower than the median diversity of 313 samples from 212 healthy participants of the HMP and 34 samples from 34 healthy MSKCC volunteers. The data from HMP and healthy MSKCC volunteers have been previously published24 and are reused here as controls. MSKCC includes 70 samples from 70 unique patients and Duke includes 38 samples from 38 unique patients. MSKCC healthy volunteer median was 15.87 (standard error [SE], 1.39), HMP median was 12.05 (SE, 0.50), MSKCC auto-HCT median was 9.39 (SE, 0.67), and Duke median was 9.68 (SE, 1.04). Another pretransplant window is used in supplemental Figure 6. The ends of the whisker lines represent the minimum and maximum values within 1.5× the interquartile range. (D) Patients with higher diversity in available perineutrophil engraftment (days +9 to +16) samples are at a reduced risk of progression or death. Patients were split into above-median (high-diversity) and below-median (low-diversity) groups in each of these day +17 landmark analyses by using the median inverse Simpson index (4.03) as the cutoff value. In all, 181 MSKCC and 59 Duke patients’ samples were analyzed. Analyses of diversity as a continuous variable and multivariable models are provided in supplemental Table 4 and analyses of pretransplant therapies are provided in supplemental Figure 6.
End points of the study were OS and PFS at 24 months. The day of neutrophil engraftment was the first of 3 consecutive days with a peripheral absolute neutrophil count of >500 cells per μL. Clinical data were obtained from institutional clinical research databases and by medical record review. Stool samples were collected prospectively at both centers using harmonized procedures. DNA extraction, polymerase chain reaction amplification, 16S ribosomal RNA gene amplicon sequencing, and data analysis were performed centrally at MSKCC as previously described.24,26,28 DNA was extracted and purified from each fecal sample, and the V4 to V5 region of the 16S ribosomal RNA gene was amplified by polymerase chain reaction and sequenced using the MiSeq Illumina platform. Paired-end reads were merged and demultiplexed, and the UPARSE pipeline was used to perform error filtering using maximum expected error (Emax = 1), group sequences into operational taxonomic units of 97% distance-based similarity, and identify and remove potential chimeric sequences using both de novo and reference-based methods. Singleton sequences were removed before clustering. The compositional similarity index was calculated as reported previously as a measure of how similar a given sample is to that patient’s early pretransplant sample, with 1 being identical and 0 being the most dissimilar sample in the data set.35
Statistical analysis was performed using R (version 3.5.0). A Wilcoxon rank-sum test was used to compare α-diversity among MSKCC, Duke, and Human Microbiome Project (HMP) samples with false discovery rate correction of P values. A generalized estimating equation with an independence working covariance structure estimated the association between diversity and the predictors of institution and HCT day (analysis window: day –10 to day +30). An interaction term was included to examine whether the estimated decrease in diversity over time was different by institution. A separate generalized estimating equation estimated the association between diversity and underlying disease type. To evaluate the association between diversity and OS or PFS, diversity was considered as both a continuous (log10-transformed) variable and a binary variable (using the median diversity value in periengraftment samples from both centers as the cutoff). Cox proportional hazards regression was used to evaluate univariable and multivariable associations between periengraftment diversity and survival, starting from a landmark of day +17, which corresponded to the end of the sampling window. Because of the correlation between disease type (lymphoma vs multiple myeloma or amyloidosis) and conditioning regimen (ie, carmustine, etoposide, cytarabine, and melphalan [BEAM] vs melphalan), disease type and not conditioning regimen was considered in the multivariable models. Induction chemotherapy was defined as first receipt of doublet or triplet therapy.
We used the t-distributed stochastic neighbor embedding (t-SNE) algorithm to visualize clusters of samples with similar composition based on Bray-Curtis distances.36 In the t-SNE plot, each point represents a single stool sample; similar samples are located relatively close to each other, and dissimilar samples are farther apart.36 A modified adonis test37 was used to measure intersubject differences and taxonomic variation; significance was evaluated by using a permutation test modified to account for multiple samples per patient.
Results
Patient characteristics
A cohort of 534 patients (409 from MSKCC, 125 from Duke) was identified with a total of 1161 evaluable samples (Table 1; supplemental Table 1) that were collected approximately once per week during the peritransplantation period, resulting in a median of 2 samples per patient. The majority of samples were collected between days –10 and +30 (Figure 1A). The variation in the number of samples collected per patient was not explained by time to neutrophil engraftment (P = .13; supplemental Figure 1).
Clinical characteristics
| Characteristic | Overall | MSKCC | Duke |
|---|---|---|---|
| Institution | 534 (100) | 409 | 125 |
| MSKCC | 409 (76.6) | ||
| Duke | 125 (23.4) | ||
| Mean age at auto-HCT, y (SD) | 58.4 (11.5) | 58.0 (11.7) | 59.9 (10.7) |
| Sex | |||
| Male | 329 (61.6) | 252 (61.6) | 77 (61.6) |
| Female | 205 (38.4) | 157 (38.4) | 48 (38.4) |
| Disease | |||
| Multiple myeloma | 272 (50.9) | 189 (46.2) | 83 (66.4) |
| Lymphoma | 227 (42.5) | 186 (45.5) | 41 (32.8) |
| Non-Hodgkin lymphoma | 200 (37.5) | 164 (40.1) | 36 (28.8) |
| Hodgkin lymphoma | 27 (5.0) | 22 (5.4) | 5 (4.0) |
| Amyloidosis | 35 (6.5) | 34 (8.3) | 1 (0.8) |
| Conditioning regimen | |||
| Melphalan | 305 (57.1) | 223 (54.5) | 82 (65.6) |
| Other melphalan-based regimen | 8 (1.5) | 5 (1.2) | 3 (2.4) |
| BEAM | 109 (20.4) | 82 (20.0) | 27 (21.6) |
| Other BEAM-based regimen | 46 (8.6) | 42 (10.2) | 4 (3.2) |
| Thiotepa-busulfan-cyclophosphamide | 47 (8.8) | 45 (11.0) | 2 (1.6) |
| TBI-based regimen | 3 (0.6) | 2 (0.5) | 1 (0.8) |
| Other* | 16 (3.0) | 10 (2.4) | 6 (4.8) |
| Disease status at transplant | |||
| Complete response/near complete response† | 171 (32.0) | 125 (30.6) | 46 (36.8) |
| Partial response | 183 (34.3) | 165 (40.3) | 18 (14.4) |
| Very good partial response‡ | 137 (25.7) | 85 (20.8) | 52 (41.6) |
| Relapse/refractory | 6 (1.1) | 2 (0.5) | 4 (3.2) |
| Progressive/stable disease | 27 (5.0) | 26 (6.4) | 1 (0.8) |
| Other | 10 (1.9) | 6 (1.5) | 4 (3.2) |
| Median follow-up of survivors, mo (IQR) | 26.6 (17.3-36.6) | 30.6 (19.7-39.4) | 19.1 (12.9-25.9) |
All data are presented as no. (%), unless otherwise indicated. For the categories listed herein, there were no missing values. Percentages may not total 100 due to rounding.
BEAM, carmustine, etoposide, cytarabine, and melphalan; IQR, interquartile range; SD, standard deviation; TBI, total body irradiation.
Other conditioning regimens (with numbers of patients treated in parentheses) included carmustine-thiotepa (1), bendamustine-cytarabine-etoposide-melphalan (1), carmustine-etoposide-cyclophosphamide (7), cyclophosphamide-carmustine-etoposide (1), gemcitabine-busulfan-melphalan (1), mitoxantrone-cyclophosphamide-carmustine (1), rituximab-ibritumomab-carmustine-etoposide-cytarabine-melphalan (1), rituximab-bendamustine-melphalan (2), and thiotepa-carmustine (1).
Near complete response for myeloma was defined as serum and urine M-protein detectable by immunoelectrophoresis, but not by electrophoresis and <5% plasma cells in bone marrow.
Very good partial response does not include lymphoma patients.
Kinetics of fecal microbial diversity during auto-HCT
We quantified α-diversity by the inverse Simpson index (S), which summarizes the number of different organisms in a sample as well as their relative distribution, with higher values for more diverse samples. We observed a decrease in fecal diversity from days –10 to +30 at both centers (P < .01; Figure 1B; supplemental Table 2). A diversity nadir was observed near day +17 for MSKCC patients and near day +14 for Duke patients. After nadir, fecal diversity increased until day +100 in the smaller number of patients from whom samples were available (102 samples from 80 patients were collected after day +30; supplemental Figure 2A). Overall, α-diversity trends were comparable at the 2 institutions. The estimated difference in fecal diversity at day 0 between centers was not statistically significant (P = .142) (supplemental Table 2).
Having observed a pattern of microbiome injury in auto-HCT recipients, we next evaluated the health of their early pretransplant microbiota. To minimize the amount of exposure to conditioning-related damage to gastrointestinal epithelia and immune cells, we selected the earliest available sample from each patient collected between days –15 and –3. We calculated the fecal diversity of healthy volunteers from the publicly available HMP (n = 212) as a comparator38 and of a cohort of healthy adult volunteers at MSKCC (n = 34). Patients presenting for auto-HCT had lower fecal diversity in early pretransplant samples than did healthy volunteers (healthy controls vs MSKCC auto-HCT patients: median S, 15.87 vs 9.39; P = .003; healthy controls vs Duke auto-HCT patients: median S, 15.87 vs 9.68; P = .006; HMP vs MSKCC auto-HCT patients: median S, 12.05 vs 9.39; P = .006; Figure 1C). Early pretransplant fecal diversity among patients was comparable between both centers (MSKCC auto-HCT vs Duke auto-HCT patients: median S, 9.39 vs 9.68; P = .839) and was also comparable between the HMP volunteers and MSKCC healthy controls (median S, 12.05 vs 15.87; P = .392). Because some early pretransplant samples were collected after conditioning chemotherapy started (supplemental Figure 2B-C), we also considered an alternative window defined as the earliest sample collected after day −15 and before any exposure to conditioning chemotherapy. In this set of 19 MSKCC patients and 45 Duke patients, we still observed a significantly lower diversity in the Duke patients compared with healthy volunteers, although the small number of samples from MSKCC that met this more stringent definition were not different than those from healthy controls (supplemental Figure 2D). Together, these data indicate that auto-HCT recipients arrive for transplantation with fecal diversity that is lower than normal, that they incur additional loss of diversity during the course of auto-HCT, and that this occurs similarly in 2 different transplant centers.
We also evaluated β-diversity, which measures differences in overall composition between samples. To assess recovery from microbiota injury, we applied a similarity index that measures the similarity of each sample’s composition to that of the early pretransplant sample from the same patient. We observed a gradual recovery toward pretransplant composition (supplemental Figure 2E). We also measured the similarity of each fecal sample to an average composition of samples from healthy volunteers (supplemental Figure 2F). Samples from both MSKCC and Duke patients started at a composition relatively similar to those from healthy volunteers, became more dissimilar throughout the course of the transplant, and ultimately returned to a composition closer to that of healthy volunteers.
Association between survival and fecal diversity in the perineutrophil engraftment period
The overall trend toward diversity showed a decline, but there was significant heterogeneity across the population (Figure 1B). We hypothesized that, as in the case of allo-HCT, more severe microbiota injury would be associated with higher mortality rates. To test this hypothesis, we selected all patients from MSKCC and Duke with an evaluable stool sample in the perineutrophil engraftment period, which we defined as days +9 to +16, a 1-week period (corresponding to the approximately once-per-week frequency of sample collection) after the median day of neutrophil engraftment (day +9) in the cohort. We analyzed OS and PFS using a landmark analysis that started the day after the end of the sampling period (day +17). For patients with multiple stool samples in this time window, the median diversity value of those samples was used. In all, 240 patients had a sample within this window that was thus analyzed (supplemental Tables 3 and 4).
When fecal diversity was considered as a log10-transformed continuous variable, patients with greater fecal diversity had a decreased risk of progression or death (PFS hazard ratio [HR] 0.68; 95% confidence interval [CI], 0.48-0.95; P = .022; supplemental Table 4). This association was also observed after adjusting for disease type and disease status, factors chosen for their clinical significance (PFS HR, 0.6; 95% CI, 0.42-0.83; P = .006) (supplemental Table 4). Patients with fecal intestinal diversity above the median (S > 4.03) in this perineutrophil engraftment period had a decreased risk of progression or death compared with those with below-median diversity (PFS HR, 0.54; 95% CI, 0.32-0.92; P = .024) (Figure 1D). Patients with greater fecal diversity also had a decreased risk of death when fecal diversity was considered as a log10-transformed continuous variable (OS HR, 0.5; 95% CI, 0.29-0.87; P = .014). The association was not statistically significant after adjusting for disease type and disease status for OS (HR, 0.58; 95% CI, 0.32-1.06; P = .079; supplemental Table 4). Patients with fecal intestinal diversity above the median also had a decreased risk of death compared with those with below-median diversity (S ≤ 4.03) (HR, 0.38; 95% CI, 0.16-0.92; P = .032) (Figure 1D). To confirm that these associations were not dependent on our definition of the periengraftment period and the median values used for patients with multiple samples within the window, we also explored the relationship between diversity and clinical outcomes using a sample-selection criterion that we previously published.26 In this approach, each patient’s first postengraftment sample (collected up to 1 week after engraftment) is selected for analysis. Significant associations were observed between postengraftment fecal diversity and PFS as well as OS in both univariable and multivariable models (supplemental Table 5).
To explore whether specific bacterial taxa might be associated with increased mortality, we used a random survival forest39 for the OS end point in the 19 genera that were observed with at least 5 × 10⁻⁴ relative abundance in 20% of periengraftment samples. The model had modest discrimination, but the variable importance for genera were examined to generate hypotheses. Enterococcus abundance had the highest variable importance (supplemental Figure 3). We also performed Cox proportional hazards analyses for each of these 19 genera (supplemental Table 6). The abundance of genus Enterococcus was associated with an increased risk of mortality (OS HR, 5.76; 95% CI, 2.13-15.59; false-discovery-rate adjusted P = .011). No significant association was identified between abundance of these genera and freedom from progression.
To evaluate whether this association between fecal microbial diversity and survival remained consistent in a more homogeneous patient cohort, we defined a subgroup of the 99 patients with multiple myeloma who underwent auto-HCT within 12 months of induction chemotherapy and who had a periengraftment sample collected between days 9 and 16 of auto-HCT (myeloma subcohort: n = 65 from MSKCC and n = 34 from Duke; Table 2). In this subcohort, higher fecal microbial diversity was associated with a reduced risk of progression or death when fecal diversity was considered as a log10-transformed continuous variable (PFS HR, 0.48; 95% CI, 0.27-0.83; P = .009; supplemental Table 7). A similar association was also observed after adjusting for cytogenetic risk (HR, 0.53; 95% CI, 0.29-0.96; P = .037; supplemental Table 7). However, when this subcohort was split into above- and below-median groups according to fecal diversity, the 2 groups did not have a statistically significant difference for PFS (supplemental Table 7). When we analyzed postengraftment samples from this myeloma subcohort, we again observed that higher fecal microbial diversity was associated with a reduced risk of progression or death when fecal diversity was considered as a continuous variable (PFS HR, 0.48; 95% CI, 0.26-0.87; P = .015; supplemental Table 8). A similar association was also observed after adjusting for cytogenetic risk (HR, 0.51; 95% CI, 0.27-0.98; P = .042; supplemental Table 8). We sought to analyze a homogeneous lymphoma subset as well, but even for diffuse large B-cell lymphoma, which was the most common subtype of lymphoma in this study, only 29 patients had samples in the periengraftment window. This underpowered analysis did not show an association between diversity and PFS (supplemental Tables 9 and 10). Taken together, these observations suggest that injury to the microbiota, as measured by lower fecal diversity, is associated with a higher risk of progression and mortality after auto-HCT.
Clinical characteristics of selected patients in the multiple myeloma subcohort with available periengraftment samples from days +9 to +16
| Characteristic | Myeloma subcohort (n = 99) |
|---|---|
| Institution | |
| MSKCC | 65 (65.7) |
| Duke | 34 (34.3) |
| Mean age at auto-HCT, y (SD) | 60.9 (8.6) |
| Male sex | 56 (56.6) |
| Melphalan dose | |
| 200 mg/m2 | 74 (74.7) |
| 140 mg/m2 | 23 (23.2) |
| 180 mg | 1 (1.0) |
| 360 mg | 1 (1.0) |
| Status at transplant | |
| Complete response/near complete response | 15 (15.2) |
| Partial response | 32 (32.3) |
| Very good partial response | 48 (48.5) |
| Progressive disease or stable disease | 3 (3.0) |
| Other | 1 (1.0) |
| Median follow-up of survivors, mo (IQR) | 26.1 (16.4-36.6) |
| International Staging System* | |
| I | 50 (50.5) |
| II | 21 (21.2) |
| III | 19 (19.2) |
| Immunoglobulin | |
| IgG κ | 40 (40.4) |
| IgG λ | 23 (23.2) |
| IgA κ | 12 (12.1) |
| IgA λ | 4 (4.0) |
| κ free light chains | 7 (7.1) |
| λ free light chains | 3 (3.0) |
| Other† | 7 (7.1) |
| Cytogenetic risk‡ | |
| Standard | 52 (52.5) |
| High | 31 (31.3) |
| No. of previous lines of therapy | |
| 1 | 66 (66.7) |
| 2 | 22 (22.2) |
| ≥3 | 11 (11.1) |
All data represent no. (%), unless otherwise specified.
ISS data unavailable for 9 patients (9.1%).
Other incorporates biclonal, IgM κ, IgD λ, and nonsecretory subtypes. Unavailable for 3 patients (3.0%).
Cytogenetic risk unavailable for 16 patients (16.2%).
Pattern of microbial injury in auto-HCT
We next sought to better characterize the patterns of microbiota injury observed in auto-HCT recipients. We calculated Bray-Curtis β-diversity distances between samples and used the t-SNE algorithm to visualize the complex microbial composition in each sample. In the 4 t-SNE plots presented in Figure 2A-C,G, each point is a stool sample, and samples with similar composition are clustered together. Color coding the t-SNE projection by sample diversity demonstrated that samples with high diversity clustered together (yellow, orange, and red in Figure 2A) whereas several other clusters with low-diversity compositions were observed (adonis test P < .001; blue and gray in Figure 2A).
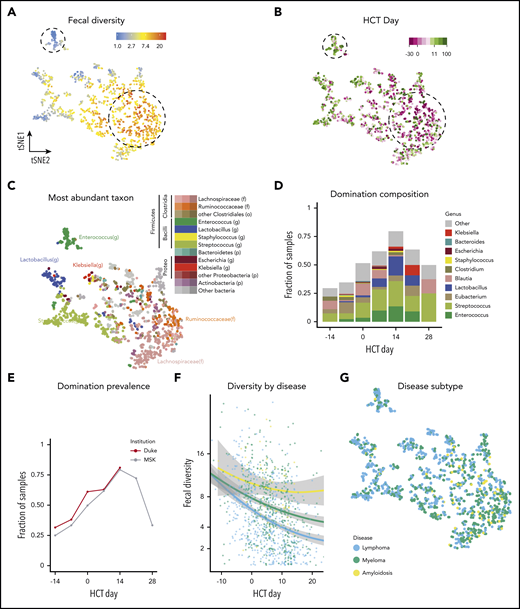
Characterization of patterns of injury to microbiota during auto-HCT. (A-C) Microbiota composition of 1161 samples from 534 patients visualized via the t-SNE algorithm. Each point represents a stool sample; those with more similar microbiota composition are clustered together. Dotted lines were manually annotated to highlight features of interest. (A) Higher diversity samples (red and yellow) are clustered away from lower diversity (blue and gray) samples. (B) The same t-SNE projection as in panel A is color coded by day of sample collection. Pretransplant samples (dark purple) cluster in the region of high-diversity samples, whereas samples from days −1 to 20 (light pink and light green) cluster in the low-diversity regions. Of note, some late samples (dark green) again cluster in the early pretransplant or high-diversity region. (C) The same t-SNE projection as in panels A and B is color coded by the most abundant taxon. This shows a cluster of samples with a preponderance of Enterococcus (dark green) in an area of low diversity. Bray-Curtis distances were calculated on operational taxonomic unit (OTU) abundances, and points were color-coded by higher taxonomic ranks as indicated in the color key. f, family; g, genus; o, order; p, phylum. (D) Domination was assessed at the OTU level; bars are color coded at the genus level according to the color key. (E) The fraction of samples with intestinal domination (defined as >30% relative abundance by any single OTU) was >50% by day 7 and was >75% by day 14. (F) Diversity was lower in patients with lymphoma than in those with myeloma or amyloidosis. (G) The same t-SNE projection as in panels A-C is color coded by underlying disease (lymphoma, myeloma, or amyloidosis). Samples did not cluster together significantly by underlying disease.
Characterization of patterns of injury to microbiota during auto-HCT. (A-C) Microbiota composition of 1161 samples from 534 patients visualized via the t-SNE algorithm. Each point represents a stool sample; those with more similar microbiota composition are clustered together. Dotted lines were manually annotated to highlight features of interest. (A) Higher diversity samples (red and yellow) are clustered away from lower diversity (blue and gray) samples. (B) The same t-SNE projection as in panel A is color coded by day of sample collection. Pretransplant samples (dark purple) cluster in the region of high-diversity samples, whereas samples from days −1 to 20 (light pink and light green) cluster in the low-diversity regions. Of note, some late samples (dark green) again cluster in the early pretransplant or high-diversity region. (C) The same t-SNE projection as in panels A and B is color coded by the most abundant taxon. This shows a cluster of samples with a preponderance of Enterococcus (dark green) in an area of low diversity. Bray-Curtis distances were calculated on operational taxonomic unit (OTU) abundances, and points were color-coded by higher taxonomic ranks as indicated in the color key. f, family; g, genus; o, order; p, phylum. (D) Domination was assessed at the OTU level; bars are color coded at the genus level according to the color key. (E) The fraction of samples with intestinal domination (defined as >30% relative abundance by any single OTU) was >50% by day 7 and was >75% by day 14. (F) Diversity was lower in patients with lymphoma than in those with myeloma or amyloidosis. (G) The same t-SNE projection as in panels A-C is color coded by underlying disease (lymphoma, myeloma, or amyloidosis). Samples did not cluster together significantly by underlying disease.
When colored by day of sample collection, pretransplant samples (shades of violet) clustered in the region of high diversity and peritransplant samples clustered in the lower diversity regions (adonis P < .001; Figure 2B). Interestingly, several samples collected in the late period from days +45 to +100 (dark green) again clustered in the early-high diversity region, consistent with some degree of recovery of microbiota composition to an initial state. To gain insight into the patterns of microbiota injury, we color coded each sample according to its most abundant taxon. Many of the samples in the early, highly diverse cluster had a preponderance of members of the Ruminococcaceae (orange) and Lachnospiraceae (pink) families, which are typical members of healthy human gut communities. One distinct low-diversity cluster had a high abundance of Enterococcus (dark-green cluster; Figure 2C); other low-diversity states harbored relatively high abundances of Streptococcus (light green) or Lactobacillus (dark blue).
As an additional measure of microbiome disruption, we explored the incidence of bacterial domination during auto-HCT, which we and others have previously defined as a relative abundance of any taxonomic unit ≥30% and have associated with adverse outcomes after allo-HCT, particularly when this domination occurs by members of the Enterococcus genus.22,40,41 The most common genera contributing to posttransplant domination events were Streptococcus and Enterococcus (Figure 2D). In samples collected from days –14 to 30, the fraction of samples with fecal microbiota domination by any organism at the operational taxonomic unit level peaked at >75% by day 14 after transplant (Figure 2E). Taken together, auto-HCT patients exhibit patterns of microbiota injury that are characterized by low diversity compositions and frequent domination by certain organisms, many of which are facultative anaerobes. We also explored microbiota composition and stool consistency as a surrogate of clinical diarrhea via t-SNE (supplemental Figure 4). We observed that formed stools clustered in the high-diversity region of the t-SNE projection (adonis P < .001). An expected association was observed between decreased diversity and exposure to gut-perturbing antibiotics, as previously defined.35 In a generalized estimating equation that adjusted for time relative to transplantation using a spline, we found that the average log-transformed inverse Simpson index was lower for samples exposed to antibiotics (–2.35; 95% CI, −3.22 to −1.47; P < .001; data not shown).
Finally, we examined composition of the microbiome by underlying disease (Figure 2F-G) and by samples from high- vs low-diversity patient groups (supplemental Figure 5). We observed that the mean difference in α-diversity was estimated to be different by disease at day +0 after transplant. Diversity was lower in patients with lymphoma vs patients with myeloma (P < .001) and in patients with lymphoma vs patients with amyloidosis (P = .006) (Figure 2F). In contrast, no clear separation of samples was seen by disease in the t-SNE plot of all samples from all time points (adonis P = .20), indicating that the overall bacterial composition and patterns of change were comparable across the 3 diseases (Figure 2G). This suggests that the degree of loss of α-diversity may vary by disease or disease-associated variables such as conditioning regimen, but that overall, patients are subject to comparable changes in microbiota composition across disease types.
Discussion
We report the largest and first multicenter study of fecal microbiota composition in auto-HCT patients. We observed that auto-HCT patients arrive for transplantation with fecal microbial diversity that is lower than that of healthy volunteers, and that patients go on to incur further microbiome disruption during the neutropenic period following transplantation. These observations are consistent with previous single-center analyses of 8, 15, and 28 patients each.25,42,43 Importantly, we observed that patients with a greater degree of microbiome damage, as assessed by below-median fecal diversity around the time of neutrophil engraftment, had higher rates of disease progression after transplantation.
The pattern of microbiome injury in auto-HCT patients is comparable to the pattern we have reported in allo-HCT recipients.24,26 We hypothesize that this injury is caused by a combination of pretransplant chemotherapy, antibiotics, mucositis, and changes in nutrition.30-34 The association of high fecal diversity at perineutrophil engraftment with longer PFS is consistent with our previous observation of fecal diversity as an independent predictor for mortality in allo-HCT patients.24,26 Importantly, low fecal diversity in allo-HCT recipients has been linked to transplant-related mortality and particularly to GVHD-related mortality and not to relapse or POD.24,26,27 In contrast, in this multicenter auto-HCT population, the mortality difference was explained by decreased PFS in recipients with lower fecal diversity. The participants in this study had only a small number of non-relapse mortality events (supplemental Table 11), which is concordant with registry data7 and may render transplant-related mortality after auto-HCT difficult to correlate with variables such as microbiome composition.
The primary effect of auto-HCT has been attributed to cytoreductive chemotherapy, but human observational studies and preclinical experimental data also implicate a degree of immune control of myeloma in autograft recipients.44,45 In a mouse model of auto-HCT, CD8+ T cells in the donor graft conferred immune control of myeloma in an interferon-γ–dependent fashion.46 Adoptive cell therapy in a syngeneic mouse model may partly depend on signals from the intestinal microbiota crossing an impaired gut barrier to augment antitumor immunity.47 Melphalan has also been reported to augment adoptive immunotherapy in mice.48
Other studies have identified links between the intestinal microbiota composition and multiple myeloma, including a mouse model in which progression of disease could be modulated by manipulating the intestinal microbiome and promoting the expansion of interleukin-17–producing cells.49 The organism identified in that study, Prevotella heparinolytica, was not identified in our cohort. We previously reported that stool samples from myeloma patients receiving maintenance therapy without minimal residual disease contained a higher relative abundance of Eubacterium hallii than those without detectable disease, and we identified Eubacterium limosum and Faecalibacterium prausnitzii as candidate taxa implicated in freedom from multiple myeloma progression.27,50 In this group of myeloma patients who had received a transplant, E limosum was present in 23 of 99, E hallii was present in 68 of 99, and F prausnitzii was present in 83 of 99 patients’ periengraftment samples. There was no statistically significant difference in association between relative abundance of these organisms and PFS. Of note, only 42% of the participants in the previous study had received autografts.
In this cohort, we observed a high frequency of domination events in the first 2 weeks after transplantation. The most frequently dominating genera were Streptococcus and Enterococcus, similar to the genera found in our analysis of allo-HCT patients.40 We have previously associated both with bloodstream infections by corresponding organisms in allo-HCT.40,51 This cohort of auto-HCT patients had an insufficient number of bloodstream infection events to perform such an analysis.
Strengths of this analysis include its large, multicenter cohort and the collection of >1 stool sample per patient. An important limitation of this observational study is that its interpretations must be limited to associations and not causal relationships. In addition, 16S amplicon sequencing limits the precise analysis of microbial communities to bacteria at the genus level and does not capture fungal or viral communities. One potentially confounding factor in our survival analysis of myeloma patients may be the different doses of melphalan to which patients were exposed, because higher melphalan doses have been associated with improved OS in auto-HCT patients.52 In this cohort, melphalan dose was not significantly associated with PFS in a univariable analysis (supplemental Tables 7 and 8). Melphalan pharmacokinetics has been associated with differing toxicity between patients and may also be a factor.
Associations between microbiota composition and cancer treatment responses have been described in other settings, including response to checkpoint-blockade immunotherapy in patients with melanoma and epithelial tumors53-58 and in response to certain cytotoxic chemotherapy agents59,60 and radiation.61 We also extend observed relationships between stool consistency and diversity in healthy populations62-64 to a population that has received chemotherapy, although the directionality of this relationship cannot be determined from this retrospective analysis. Although the mechanisms for these findings should be studied in preclinical models, this study provides the rationale for including auto-HCT patients in clinical studies of strategies to prevent or restore intestinal dysbiosis. Such strategies might include modifications to dietary recommendations,65 tailoring of antibiotics,66,67 use of prebiotics,68 or probiotic approaches such as fecal microbiota transplantation35,69 or the transfer of rationally designed consortia of bacteria.70,71
Sequence data are available at the National Center for Biotechnology Information under BioProject Accession PRJNA606262. Data from the Human Microbiome Project were downloaded from https://portal.hmpdacc.org/.
The online version of this article contains a data supplement.
The publication costs of this article were defrayed in part by page charge payment. Therefore, and solely to indicate this fact, this article is hereby marked “advertisement” in accordance with 18 USC section 1734.
Acknowledgments
M.A.P. thanks Theodore and Laura Hromadka for their generous support.
This research was supported by the National Institutes of Health (NIH)/National Cancer Institute grants R01-CA228358 and R01-CA228308 (M.R.M.v.d.B.) and 5R01-CA203950 (N.J.C.), Memorial Sloan Kettering Cancer Center (MSKCC) Cancer Center Core Grants P30 CA008748 and Project 2 of P01-CA023766 (M.R.M.v.d.B.); by NIH/National Heart, Lung, and Blood Institute grants R01 HL147584, R01-HL125571, and R01-HL123340 (M.R.M.v.d.B.) and K08HL143189 (J.U.P.); NIH/National Institute of Aging Project 2 of P01-AG052359 (M.R.M.v.d.B.), Mini #6 of P30-AG028716 (A.D.S.), and R21-AG066388 (A.D.S. and N.J.C.); NIH/National Institute of Allergy and Infectious Diseases grants U01 AI124275 (M.R.M.v.d.B.) and R01-AI137269-01 (Y.T.); NIH/National Center for Advancing Translational Sciences grant 5KL2TR001115-03 (A.D.S.); Tri-Institutional Stem Cell Initiative 2016-013 (M.R.M.v.d.B.); American Society of Hematology Scholar Award (A.D.S.); Conquer Cancer Foundation/American Society of Clinical Oncology Young Investigator Award (N.K.); The Lymphoma Foundation (M.R.M.v.d.B. and N.K.); Deutsche Forschungsgemeinschaft (S.L.); The Sawiris Foundation (J.U.P. and A.M.L.); the Society of Memorial Sloan Kettering Cancer Center (J.U.P. and N.K.); the Multiple Myeloma Research Foundation (MMRF) (A.M.L.); The Susan and Peter Solomon Divisional Genomics Program (M.R.M.v.d.B.); MSKCC Cancer Systems Immunology Pilot Grant (J.U.P.); the Parker Institute for Cancer Immunotherapy at MSKCC (A.M.L., M.R.M.v.d.B., and J.U.P.); the American Society for Transplantation and Cellular Therapy (J.U.P.); and Seres Therapeutics (M.R.M.v.d.B. and J.U.P.).
N.K. received a Master of Science from Weill Cornell Graduate School of Medical Sciences for a degree in Clinical Epidemiology and Health Services. This work was submitted in partial fulfillment of the requirement for that degree.
Authorship
Contribution: N.K., A.L.C.G., S.M.D., S.G., J.U.P., and M.R.M.v.d.B. designed the project; N.K., G.L.S., A.D.S., C.S.S., H.J.L., P.B.D., M.-A.P., D.J.C., A.M.L., A.C., J.B.S., A.E.S., D.G.B., P.A.G., M.M., G.K.A., C.R.-C., E.F., L.B., S.R., A.T.B., M.V.L., J.A.M., E.L., Y.T., R.R.J., N.J.C., S.G., K.A.M., E.G.P., J.U.P., and M.R.M.v.d.B. collected the data; N.K., S.L., S.M.D., K.A.M., A.D., A.L.C.G., and J.U.P. analyzed the data; N.K., S.L., and J.U.P. wrote the article; and all authors revised and approved the final version of the report.
Conflict-of-interest disclosure: N.K. received research funding from Gilead Sciences and an honorarium from Back Bay Life Sciences. S.L. received travel support from Celgene, Sanofi, and Neovii. A.L.C.G. received support from Seres Therapeutics. G.L.S. received research funding from Janssen and Amgen. A.D.S. received support from Seres Therapeutics. C.S.S. served as a consultant on advisory boards for Juno Therapeutics, Sanofi-Genzyme, Spectrum Pharmaceuticals, Novartis, Genmab, Precision Biosciences, Kite (a Gilead Company), Celgene, Gamida Cell, and GlaxoSmithKline and received research funding for clinical trials from Juno Therapeutics, Celgene, Precision Biosciences, and Sanofi-Genzyme. H.J.L. served on advisory boards for Takeda, Janssen, and Celgene, served as a consultant for Caelum Biosciences and Karyopharm, and received research support from Takeda. M.-A.P. received honoraria from AbbVie, Bellicum, Celgene, Bristol Myers Squibb, Incyte, Merck, Novartis, Nektar Therapeutics, Omeros, and Takeda, served on data safety monitoring boards for Cidara Therapeutics, Servier, and Medigene and scientific advisory boards for MolMed and NexImmune, has received research support for clinical trials from Incyte, Kite/Gilead, and Miltenyi Biotec, has served as a volunteer for and as a member of the Board of Directors of American Society for Transplantation and Cellular Therapy and Be The Match (National Marrow Donor Program), and on the Center for International Blood and Marrow Transplant Research Cellular Immunotherapy Data Resource Committee. D.J.C. received research funding from Genentech. A.E.S. received support from Seres Therapeutics. R.R.J. has consulted for Karius, Merck, Microbiome DX, and Prolacta, has served on the scientific advisory boards of Kaleido, Maat Pharma, and Seres, and has received patent royalties licensed to Seres. S.G. received research funding from Amgen, Actinuum, Celgene, Johnson & Johnson, Miltenyi, Takeda, and Omeros, and has served on advisory boards for Amgen, Actinuum, Celgene, Johnson & Johnson, Janssen, Jazz Pharmaceutical, Takeda, Novartis, Kite, and Spectrum Pharma. K.A.M received travel support and honoraria or consulting fees from Karius. E.G.P. has received speaker honoraria from Bristol Myers Squibb, Celgene, Seres Therapeutics, MedImmune, Novartis, and Ferring Pharmaceuticals and is an inventor on patent application #WPO2015179437A1 (entitled “Methods and compositions for reducing Clostridium difficile infection”) and #WO2017091753A1 (entitled “Methods and compositions for reducing vancomycin-resistant enterococci infection or colonization”) and holds patents that receive royalties from Seres Therapeutics. M.R.M.v.d.B. has received research support and stock options from Seres; has received stock options from Notch Therapeutics; has received royalties from Wolters Kluwer; consulted and received honorarium from, or participated in, advisory boards for Seres Therapeutics, Jazz Pharmaceuticals, Rheos, Therakos, WindMIL Therapeutics, Amgen, Merck & Co, Inc, Magenta Therapeutics, Frazier Healthcare Partners, Nektar Therapeutics, Notch Therapeutics, Forty Seven Inc, Priothera, Ceramedix, DKMS (Deutsche KnochenMarkSpenderdatei), Pharmacyclics (spouse), Kite Pharmaceuticals (spouse); has IP Licensing with Seres Therapeutics and Juno Therapeutics; and holds a fiduciary role on the Foundation Board of DKMS (a nonprofit organization). J.U.P. has received research funding, intellectual property fees, and travel reimbursement from Seres Therapeutics and consulting fees from DaVolterra. The remaining authors declare no competing financial interests.
Correspondence: Jonathan U. Peled, Adult Bone Marrow Transplantation Service, Department of Medicine, Memorial Sloan Kettering Cancer Center, 1275 York Ave, ZRC 1419, New York, NY 10065; e-mail; peledj@mskcc.org.

This feature is available to Subscribers Only
Sign In or Create an Account Close Modal