

Key Points
An atlas of PML/RARα direct targets redefines the activating function and explains synergism of all-trans retinoic acid/arsenic trioxide.
PML/RARα activates target gene GFI1 through chromatin conformation at the super-enhancer region, which is required for APL cell growth.

Abstract
Transcriptional deregulation initiated by oncogenic fusion proteins plays a vital role in leukemia. The prevailing view is that the oncogenic fusion protein promyelocytic leukemia/retinoic acid receptor-α (PML/RARα), generated by the chromosome translocation t(15;17), functions as a transcriptional repressor in acute promyelocytic leukemia (APL). Here, we provide rich evidence of how PML/RARα drives oncogenesis through both repressive and activating functions, particularly the importance of the newly identified activation role for the leukemogenesis of APL. The activating function of PML/RARα is achieved by recruiting both abundant P300 and HDAC1 and by the formation of super-enhancers. All-trans retinoic acid and arsenic trioxide, 2 widely used drugs in APL therapy, exert synergistic effects on controlling super-enhancer-associated PML/RARα-regulated targets in APL cells. We use a series of in vitro and in vivo experiments to demonstrate that PML/RARα-activated target gene GFI1 is necessary for the maintenance of APL cells and that PML/RARα, likely oligomerized, transactivates GFI1 through chromatin conformation at the super-enhancer region. Finally, we profile GFI1 targets and reveal the interplay between GFI1 and PML/RARα on chromatin in coregulating target genes. Our study provides genomic insight into the dual role of fusion transcription factors in transcriptional deregulation to drive leukemia development, highlighting the importance of globally dissecting regulatory circuits.
Introduction
In genetics of myeloid neoplasia, chromosomal translocations often involve transcription factors (TFs), leading to oncogenic fusion TFs that can induce malignant transformation through aberrant transcriptional programs.1 Depending on the predominant transcriptional activity on direct target genes, these fusion TFs are dichotomously classified as either activators or repressors. This concept of dichotomy has been challenged by the discovery of versatile roles of transcriptional regulators in gene expression,2 largely propelled by rapid advances in high-throughput genomic technologies.
Acute promyelocytic leukemia (APL) is characterized by a specific t(15;17) chromosome translocation, which generates the promyelocytic leukemia/retinoic acid receptor-α (PML/RARα) fusion gene. The encoded fusion protein has been long viewed as a transcriptional repressor of RARα signaling to interfere with myeloid differentiation.3 Our previous studies have revealed that PML/RARα can also exert repressive effects on PU.1 target genes.4,5 Such repression is largely achieved by the recruitment of corepressors.3,6 However, gene expression profiling has implicated the capacity to upregulate (in addition to downregulate) gene expression, as observed in both PML/RARα-overexpressed cells and transgenic mice.7,8 PML/RARα can directly transactivate the expression of genes essential for APL pathogenesis.9,10 However, only a few such genes have been reported, and the mechanism by which PML/RARα mediates transcriptional activation on a genome scale is unknown.
TF-governing gene regulation is principally modeled as the switch between 2 mutually exclusive classes of coregulators, coactivators and corepressors, respectively activating and repressing transcription.11 However, this classical model has been challenged by genome-wide binding data of coregulators. In human T cells, both coactivators and corepressors can colocalize on actively transcribed regions.2 In embryonic stem cells, the repressor complex and the mediator activator complex are recruited to super-enhancer regions with histone hyperacetylation.12 These findings suggest a functional interplay between coactivators and corepressors on chromatin.
Current knowledge of corepressors involved in PML/RARα-mediated transcriptional repression is largely learned from wild-type RARα.3,13 However, we have shown that RARα-bound canonical retinoic acid responsive elements only account for a small portion of PML/RARα binding sites.4 A more interesting observation is that PML/RARα tends to bind open chromatin rather than compact chromatin.14 These observations strongly suggest that PML/RARα may have distinct coregulator patterns that differ from RARα. However, the limited information regarding direct targets and coregulators has long hampered our understanding of PML/RARα-mediated transcriptional deregulation in APL.
In this study, we established 2 distinct classes of PML/RARα direct targets that were divergent in function during leukemogenesis: repressed and activated genes. Profiling coregulators (HDAC1 and P300) and histone modifications (H3K4me1 and H3K27ac) allowed us to identify super-enhancer-associated PML/RARα-regulated target genes for which expression changes were therapeutically relevant, including the target gene, GFI1.
GFI1 is a transcriptional regulator with context-dependent roles in hematopoiesis and leukemogenesis.15-23 Reduced or loss of GFI1 expression has been reported in myeloid malignancies,18-21 while high GFI1 expression has been observed in AML1-ETO-positive acute myeloid leukemia (AML)23 and acute lymphoid leukemia,22 but without clear roles defined for GFI1 in APL pathogenesis. Here, we demonstrate that transactivation of GFI1 by PML/RARα (likely oligomerized) and its chromatin conformation regulation at the super-enhancer are necessary for the maintenance of APL. Further profiling GFI1 targets allowed us to identify coregulated genes with PML/RARα.
Methods
Primary samples and cell lines
Primary APL blasts were obtained according to the Declaration of Helsinki at disease onset from bone marrow of 7 newly diagnosed patients with >85% abnormal promyelocytic blasts (supplemental Table 1, available on the Blood Web site). Informed consent was obtained according to procedures approved by the Institutional Review Board from Ruijin Hospital, which is affiliated with Shanghai Jiao Tong University School of Medicine. NB4, U937, and HEK-293T cells were authenticated. Details are available in supplemental Methods.
Identification of PML/RARα direct targets
The integrative assays of chromatin immunoprecipitation sequencing (ChIP-seq) and RNA sequencing (RNA-seq) were performed on NB4 cells without the treatment of all-trans retinoic acid (ATRA) to identify target genes both bound and regulated by PML/RARα. This integration aimed to minimize possible effects associated with each assay, for example, the influence by the changing state of cells upon PML/RARα knockdown. MACS suite24 was used to call ChIP-seq binding peaks (P < 1 × 10⁻¹⁰), and edgeR25 was used to identify differentially expressed genes upon short hairpin RNA (shRNA)-mediated PML/RARα knockdown (false discovery rate <0.01 and at least twofold changes) for 3 days. The maximum distance (50 kb) was used to associate each binding peak with the nearest differential gene showing increased expression (ie, PML/RARα directly repressed targets) or decreased expression (ie, PML/RARα directly activated targets). Details are available in supplemental Methods.
Sequential ChIP (Re-ChIP), chromatin conformation capture (3C), knockdown experiments, luciferase reporter assays, coimmunoprecipitation, and functional experiments
Primers used for these experimental assays are listed in supplemental Table 2, and details are available in supplemental Methods.
Mouse studies
Mouse experiments were carried out in accordance with institutional animal protocols, approved by the Institutional Animal Care and Use Committee of Ruijin Hospital/Shanghai Jiao Tong University School of Medicine. The transplantable murine APL mice model was used in the functional studies of Gfi1 and the xenograft nonobese diabetic/severe combined immunodeficiency (NOD/SCID) mouse model used to investigate the effects of the intronic enhancer of GFI1. Details are available in supplemental Methods.
Bioinformatic and statistical analysis
Bioinformatic and statistical analysis are detailed in supplemental Methods.
Results
PML/RARα exerts both repressive and activating functions through direct binding
Identification of bona fide direct targets is essential to investigate the oncogenic activity of PML/RARα during APL pathogenesis. We first sought to identify genes both bound and regulated by PML/RARα in APL cells through integrative assays of ChIP-seq and RNA-seq (Figure 1A). Briefly, we performed ChIP-seq analysis of NB4 cells, an APL patient-derived cell line, using the antibody against the fusion site of PML/RARα (supplemental Figure 1A-C). A total of 6415 PML/RARα binding sites were obtained (supplemental Figure 1D and supplemental Table 3) and confirmed by ChIP-seq data using both anti-RARα and anti-PML antibodies, which were performed by ourselves and retrieved from previously published data26 (supplemental Figure 1E-F). In parallel, we conducted 2 independent RNA-seq experiments on NB4 cells upon PML/RARα knockdown using the fusion gene-specific shRNA (supplemental Figure 2A-C) for 3 days, with a total of 2052 PML/RARα differentially regulated genes identified (supplemental Table 4). PML/RARα knockdown decreased its binding on chromatin (supplemental Figure 2D) and induced differentiation and apoptosis of NB4 cells (supplemental Figure 2E-I). These effects show similarities to those observed when NB4 cells are treated with arsenic trioxide (ATO).3,27 Combining evidence from ChIP-seq and RNA-seq data, we created an atlas of 787 PML/RARα direct genes, including 363 repressed genes (as expected) and 424 activated genes (unexpected) (Figure 1A; supplemental Table 5). Data from ChIP-quantitative polymerase chain reaction (ChIP-qPCR) using antibodies against the PML moiety, the RARα moiety, or the fusion site of PML/RARα supported the existence of 2 classes of PML/RARα direct targets in APL cells, including both NB4 (supplemental Figure 3) and primary blast cells (Figure 1B). Furthermore, luciferase reporter assays in U937 transfected with PML/RARα and in NB4 cells with PML/RARα knockdown confirmed that transrepression or transactivation was directly mediated by PML/RARα (Figure 1C; supplemental Table 6).

PML/RARα exerts both repressive and activating functions through direct binding. (A) Genome-wide identification of PML/RARα direct target genes from integrative assays of ChIP-seq and RNA-seq. Schematic illustration of the experimental design, including the criteria used for analysis (left). Heatmap showing the expression change of the identified direct target genes upon PML/RARα knockdown (right). Two classes of target genes were categorized: PML/RARα-repressed targets (in blue) and PML/RARα-activated targets (in red). The maximum distance of 50 kb was used to associate ChIP-seq peaks with the nearest differentially expressed genes identified by RNA-seq. (B) Validation of PML/RARα targets in primary APL samples. ChIP-qPCR was performed on primary blasts from 2 APL patients using the antibody against the fusion site of PML/RARα. Negative controls include 2 irrelevant genomic regions with no PML/RARα binding signals (NC-1 and NC-2). Validation of PML/RARα targets in NB4 cells can be found in supplemental Figure 3. (C) PML/RARα effects on transcriptional activities of the directly repressed gene CEBPE (bottom right) or the directly activated gene GFI1 (top right). The left panel shows the genome browser tracks of PML/RARα binding, with the regions cloned in the luciferase constructs highlighted in dotted box. The luciferase reporter plasmid of each detected region was cotransfected with the PML/RARα-expressing plasmid in U937 cells or small interfering RNA (siRNA) targeting the fusion site of PML/RARα in NB4 cells. Luciferase activity was detected at 24 hours after transfection. N.C. siRNA, nonspecific siRNA control. Data represent the mean of 3 replicates ± standard deviation (SD). Statistical significance was determined using the unpaired, 2-tailed Student t test. *P < .01, **P < .001. chr, chromosome. (D) GSEA in terms of differentially expressed genes identified comparing blasts from 16 APL patients vs 163 non-APL AML patients (left panel) and comparing APL patients vs normal promyelocytes (right panel). NES, normalized enrichment score. (E) Enrichment analysis of PML/RARα-activated and repressed targets using the gene sets signifying genes specifically expressed in each of 10 stages of myeloid differentiation. t-Distributed stochastic neighbor embedding (t-SNE) plots showing the 10 stages of myeloid differentiation constructed using the transcriptome data of sorted hematopoietic stem cells, myeloid progenitors, and their mature progeny (bottom panel). The statistical significance of the enrichment was determined by the hypergeometric test (top panel). BCs, band cells; CMPs, common myeloid progenitors; GMPs, granulocyte/monocyte progenitors; HSCs, hematopoietic stem cells; MEPs, megakaryocyte/erythroid progenitors; MMs, metamyelocytes; MPPs, multipotential progenitors; MYs, myelocytes; PMs, promyelocytes; PMNs, polymorphonuclear cells. Red bars represent PML/RARα-activated targets, and blue bars represent PML/RARα-repressed targets.
PML/RARα exerts both repressive and activating functions through direct binding. (A) Genome-wide identification of PML/RARα direct target genes from integrative assays of ChIP-seq and RNA-seq. Schematic illustration of the experimental design, including the criteria used for analysis (left). Heatmap showing the expression change of the identified direct target genes upon PML/RARα knockdown (right). Two classes of target genes were categorized: PML/RARα-repressed targets (in blue) and PML/RARα-activated targets (in red). The maximum distance of 50 kb was used to associate ChIP-seq peaks with the nearest differentially expressed genes identified by RNA-seq. (B) Validation of PML/RARα targets in primary APL samples. ChIP-qPCR was performed on primary blasts from 2 APL patients using the antibody against the fusion site of PML/RARα. Negative controls include 2 irrelevant genomic regions with no PML/RARα binding signals (NC-1 and NC-2). Validation of PML/RARα targets in NB4 cells can be found in supplemental Figure 3. (C) PML/RARα effects on transcriptional activities of the directly repressed gene CEBPE (bottom right) or the directly activated gene GFI1 (top right). The left panel shows the genome browser tracks of PML/RARα binding, with the regions cloned in the luciferase constructs highlighted in dotted box. The luciferase reporter plasmid of each detected region was cotransfected with the PML/RARα-expressing plasmid in U937 cells or small interfering RNA (siRNA) targeting the fusion site of PML/RARα in NB4 cells. Luciferase activity was detected at 24 hours after transfection. N.C. siRNA, nonspecific siRNA control. Data represent the mean of 3 replicates ± standard deviation (SD). Statistical significance was determined using the unpaired, 2-tailed Student t test. *P < .01, **P < .001. chr, chromosome. (D) GSEA in terms of differentially expressed genes identified comparing blasts from 16 APL patients vs 163 non-APL AML patients (left panel) and comparing APL patients vs normal promyelocytes (right panel). NES, normalized enrichment score. (E) Enrichment analysis of PML/RARα-activated and repressed targets using the gene sets signifying genes specifically expressed in each of 10 stages of myeloid differentiation. t-Distributed stochastic neighbor embedding (t-SNE) plots showing the 10 stages of myeloid differentiation constructed using the transcriptome data of sorted hematopoietic stem cells, myeloid progenitors, and their mature progeny (bottom panel). The statistical significance of the enrichment was determined by the hypergeometric test (top panel). BCs, band cells; CMPs, common myeloid progenitors; GMPs, granulocyte/monocyte progenitors; HSCs, hematopoietic stem cells; MEPs, megakaryocyte/erythroid progenitors; MMs, metamyelocytes; MPPs, multipotential progenitors; MYs, myelocytes; PMs, promyelocytes; PMNs, polymorphonuclear cells. Red bars represent PML/RARα-activated targets, and blue bars represent PML/RARα-repressed targets.
We next investigated the disease relevance of these 2 classes of PML/RARα direct targets. Gene set enrichment analysis (GSEA) using RNA-seq data of 179 AML patients (16 APL and 163 non-APL AML)28 revealed that repressed targets were more likely downregulated in APL, while activated genes tended to be enriched among genes highly expressed in APL (Figure 1D). Similar results were obtained when comparing APL samples and normal promyelocytes29 (Figure 1D), suggesting that both classes of PML/RARα targets were APL specific and malignant related. We also found that these 787 PML/RARα direct genes were collectively informative to distinguish APL patients from non-APL AML patients and normal promyelocytes (supplemental Figure 4). Furthermore, we also analyzed gene signatures for myeloid differentiation stages, including hematopoietic stem cells, myeloid progenitors, and their mature progeny.30,31 We found that PML/RARα-repressed targets tended to be uniquely expressed in the mature myeloid progeny, ie, band cells and polymorphonuclear neutrophils, consistent with inhibition of terminal neutrophil differentiation by PML/RARα. Interestingly, PML/RARα-activated targets were mostly correlated with genes uniquely expressed in promyelocytes and granulocyte/monocyte progenitors (Figure 1E), suggesting the necessity of PML/RARα in dictating myeloid commitment and the promyelocytic phenotype. We found numerous previously unreported PML/RARα-activated direct targets, including those critical in hematopoiesis and leukemogenesis, such as GFI1, MPO (a strong diagnostic marker for APL32 ), and WT1 and MYC (involved in leukemogenesis33,34 ).
Repressive and activating functions of PML/RARα are attributed to distinct HDAC1 and P300 binding patterns
Next, we explored potential factors determining the PML/RARα-mediated transcriptional consequence (activation vs repression). We speculated that PML/RARα-activated and repressed targets might have different binding patterns of coregulators, considering 2 observations: (1) the recruitment of corepressors is widely recognized to inhibit transcription, whereas the binding of coactivators activates target genes3,6 ; and (2) the potential of PML/RARα repressing or activating transcription depends on specific contexts (eg, PML/RARα may repress the transcription through recruiting corepressors, and ATRA can reactivate the transcription through replacing corepressors with coactivators).3 To test our speculation, we performed ChIP-seq analysis of corepressor HDAC1 and coactivator P300 in NB4 cells to determine chromatin co-occupancy with PML/RARα (supplemental Tables 7 and 8). We unexpectedly found that both HDAC1 and P300 co-localized with PML/RARα at the majority of PML/RARα binding sites in NB4 cells (Figure 2A). Moreover, we found that binding signals of both coregulators were abundant on the PML/RARα-activated regions, whereas only abundant HDAC1 signals observed on repressed targets (Figure 2B-C). This finding was validated by ChIP-qPCR in primary APL samples (Figure 2D). We also performed co-IP and re-ChIP assays to explore whether HDAC1 and P300 physically bind to PML/RARα and found that the 3 proteins interacted each other on the chromatin of PML/RARα targets (Figure 2E-F).

Repressive and activating functions of PML/RARα are attributed to distinct cobinding patterns with HDAC1 and P300. (A) Heatmaps of ChIP-seq data showing cobinding of HDAC1 and P300 at the PML/RARα binding sites, displayed separately for PML/RARα-repressed targets (the top half) and -activated targets (the bottom half). (B) Abundant enrichment of both HDAC1 and P300 on PML/RARα-activated targets vs abundant HDAC1 with moderate/minor P300 on PML/RARα-repressed targets, illustrated using aggregate plots of ChIP-seq signals of HDAC1 and P300 centered on the PML/RARα binding peak summit. (C) Genome browser tracks showing the binding patterns of PML/RARα, HDAC1, and P300 on the representative repressed gene (CEBPE) and activated gene (GFI1). (D) ChIP-qPCR validation of distinct HDAC1 and P300 cobinding patterns on PML/RARα-repressed and activated targets in blast cells from 2 primary APL patients. (E) The physical interaction of both HDAC1 and P300 with PML/RARα. Endogenous coimmunoprecipitation (co-IP) experiments were performed in NB4 cells using antibodies against HDAC1 and P300, respectively. The protein level of PML/RARα was detected by western blotting with anti-RARα antibody (C20). IgG, immunoglobulin G; WB, western blot. (F) ChIP-re-ChIP showing co-occupancy of PML/RARα, HDAC1, and P300 on chromatin. ChIP products immunoprecipitated by each of the 3 antibodies were subjected to re-ChIP using the other 2 antibodies or normal immunoglobulin G. Data represent the mean of 3 replicates ± SD. *P < .01. (G) Aggregate plots of H3K27ac ChIP-seq signals centered on the PML/RARα peak summit. Red, PML/RARα-activated targets; blue, PML/RARα-repressed targets. (H) Enrichment of RNA Pol II at genes activated and repressed by PML/RARα. The activity of Pol II was determined by the Pol II traveling ratio, which was calculated by the relative amount of Pol II binding at the gene body vs near the promoter. Red, PML/RARα-activated targets; blue, PML/RARα-repressed targets. The 2-sample Kolmogorov-Smirnov test was used to compare distributions (P < .001).
Repressive and activating functions of PML/RARα are attributed to distinct cobinding patterns with HDAC1 and P300. (A) Heatmaps of ChIP-seq data showing cobinding of HDAC1 and P300 at the PML/RARα binding sites, displayed separately for PML/RARα-repressed targets (the top half) and -activated targets (the bottom half). (B) Abundant enrichment of both HDAC1 and P300 on PML/RARα-activated targets vs abundant HDAC1 with moderate/minor P300 on PML/RARα-repressed targets, illustrated using aggregate plots of ChIP-seq signals of HDAC1 and P300 centered on the PML/RARα binding peak summit. (C) Genome browser tracks showing the binding patterns of PML/RARα, HDAC1, and P300 on the representative repressed gene (CEBPE) and activated gene (GFI1). (D) ChIP-qPCR validation of distinct HDAC1 and P300 cobinding patterns on PML/RARα-repressed and activated targets in blast cells from 2 primary APL patients. (E) The physical interaction of both HDAC1 and P300 with PML/RARα. Endogenous coimmunoprecipitation (co-IP) experiments were performed in NB4 cells using antibodies against HDAC1 and P300, respectively. The protein level of PML/RARα was detected by western blotting with anti-RARα antibody (C20). IgG, immunoglobulin G; WB, western blot. (F) ChIP-re-ChIP showing co-occupancy of PML/RARα, HDAC1, and P300 on chromatin. ChIP products immunoprecipitated by each of the 3 antibodies were subjected to re-ChIP using the other 2 antibodies or normal immunoglobulin G. Data represent the mean of 3 replicates ± SD. *P < .01. (G) Aggregate plots of H3K27ac ChIP-seq signals centered on the PML/RARα peak summit. Red, PML/RARα-activated targets; blue, PML/RARα-repressed targets. (H) Enrichment of RNA Pol II at genes activated and repressed by PML/RARα. The activity of Pol II was determined by the Pol II traveling ratio, which was calculated by the relative amount of Pol II binding at the gene body vs near the promoter. Red, PML/RARα-activated targets; blue, PML/RARα-repressed targets. The 2-sample Kolmogorov-Smirnov test was used to compare distributions (P < .001).
HDAC1 and P300 are generally assumed to be counterplayers that can control histone acetylation levels determining transcriptional repression or activation.35 The coexistence of HDAC1 and P300 on PML/RARα targets prompted us to further profile the histone acetylation mark H3K27ac. Indeed, the H3K27ac signals on PML/RARα-activated genes were more significantly abundant than on repressed genes (Figure 2G). Histone hyperacetylation is associated with active chromatin.36 We next quantified the degree of active transcription at PML/RARα targets by the traveling ratio, defined as the density of RNA polymerase II (Pol II) at the gene body vs near the promoter.37 Indeed, the traveling ratio was significantly higher on PML/RARα-activated targets than on repressed genes (Figure 2H), indicating that PML/RARα-activated genes were more actively transcribed in APL.
PML/RARα transactivates target genes largely through super-enhancer regulation
The interaction between PML/RARα and P300 on activated targets suggested the involvement of PML/RARα in enhancer regulation. We thus performed ChIP-seq using the enhancer marks H3K4me1 and H3K27ac to define enhancer regions and found that ∼40% of PML/RARα were located at enhancer regions (Figure 3A). Surprisingly, we also found that PML/RARα preferentially co-occupied enhancers with higher H3K27ac signals (Figure 3B; supplemental Figure 5), which met the criteria of super-enhancers.12 We further assessed the binding tendency of PML/RARα on 2 categories of enhancers, super-enhancers and typical enhancers, and found that PML/RARα was over fourfold more likely to co-occupy super-enhancers than typical enhancers (80.6% vs 19.0%; Figure 3C; supplemental Table 9). Similar results (threefold, 60.6% vs 21.5%) were observed in primary APL blasts (Figure 3C; supplemental Table 10). At the gene level, we identified a total of 303 super-enhancer-associated PML/RARα-regulated targets (SEPRTs; supplemental Table 11). To illustrate the functional importance of SEPRTs in APL, we used a CRISPR-Cas9 screening data set in NB4 cells38 to perform GSEA, showing that SEPRTs tended to be enriched among genes essential for cell growth (Figure 3D), such as GFI1, IKZF1, and JUNB.
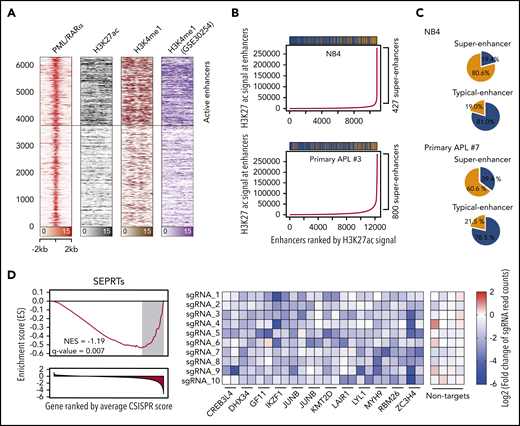
PML/RARα coexists within the super-enhancer regions to regulate APL-specific genes. (A) Heatmap showing abundant PML/RARα, H3K27ac, and H3K4me1 occupancy on PML/RARα binding sites, with those indicative of active enhancers highlighted. (B) PML/RARα tended to bind at enhancers with higher H3K27ac signals in APL cells, including NB4 (upper panel) and primary blasts (lower panel). Enhancers were ranked by the H3K27ac signal. Super-enhancers were defined using the ROSE methods (detailed in supplemental Methods). The bar above shows the distribution of PML/RARα binding among enhancers, in which the yellow represents the peak with PML/RARα binding and the blue for the peak without PML/RARα binding. (C) PML/RARα preferentially bound super-enhancers three- to fourfold more likely than typical enhancers in APL cells, including NB4 (upper panel) and primary blasts (lower panel). Pie plots show the percentages of PML/RARα binding within the super-enhancer regions and typical-enhancer regions. (D) SEPRTs essential for the survival of APL cells, supported by CRISPR-Cas9 screening data in NB4 cells. The left panel shows GSEA using the SEPRTs and CRISPR score. The CRISPR score was used to rank 18 661 genes in the CRISPR-Cas9 screen applied to NB4 cells. The right panel shows normalized read counts of sgRNA in NB4 cells transfected with the Cas9-CRISPR/sgRNA library before and after population doublings.
PML/RARα coexists within the super-enhancer regions to regulate APL-specific genes. (A) Heatmap showing abundant PML/RARα, H3K27ac, and H3K4me1 occupancy on PML/RARα binding sites, with those indicative of active enhancers highlighted. (B) PML/RARα tended to bind at enhancers with higher H3K27ac signals in APL cells, including NB4 (upper panel) and primary blasts (lower panel). Enhancers were ranked by the H3K27ac signal. Super-enhancers were defined using the ROSE methods (detailed in supplemental Methods). The bar above shows the distribution of PML/RARα binding among enhancers, in which the yellow represents the peak with PML/RARα binding and the blue for the peak without PML/RARα binding. (C) PML/RARα preferentially bound super-enhancers three- to fourfold more likely than typical enhancers in APL cells, including NB4 (upper panel) and primary blasts (lower panel). Pie plots show the percentages of PML/RARα binding within the super-enhancer regions and typical-enhancer regions. (D) SEPRTs essential for the survival of APL cells, supported by CRISPR-Cas9 screening data in NB4 cells. The left panel shows GSEA using the SEPRTs and CRISPR score. The CRISPR score was used to rank 18 661 genes in the CRISPR-Cas9 screen applied to NB4 cells. The right panel shows normalized read counts of sgRNA in NB4 cells transfected with the Cas9-CRISPR/sgRNA library before and after population doublings.
ATRA and ATO exert synergistic effects on controlling SEPRTs in APL cells
Next, we explored how SEPRTs responded to ATRA and ATO, 2 widely used drugs in APL therapy. We performed RNA-seq in NB4 cells treated with ATRA or ATO in a time series, from which differentially expressed genes were identified. Using self-organizing map–based gene clustering and visualization, we identified 3 gene clusters (C1-C3; Figure 4A; supplemental Table 12) and found that ATRA and ATO shared some similar regulatory effects (genes in C1 downregulated by both ATRA and ATO) but also exerted different impacts; genes in C2 were only downregulated by ATO, as early as 6 hours after treatment (such as GFI1 and ETS1), while genes in C3 only upregulated by ATRA, with trivial effects upon ATO treatment.

ATRA and ATO exert synergistic effects on controlling SEPRTs in APL cells. (A) Clustering of SEPRTs after ATRA or ATO treatment using self-organizing map. The left panel shows 3 gene clusters color-coded on the map, with per-hexagon genes labeled (for example, genes in the insert with heatmap showing expression pattern). The right panel shows that each presentation indicates treatment- and time-specific changes, in which upregulated (red), downregulated (blue), and no changed (light yellow) genes are well separated. FC, fold change. (B) Functional enrichments in gene clusters. Gene Ontology Biological Process terms were used for enrichment analysis based on the Fisher exact test (1 sided), with odds ratios and 95% confidence interval calculated. FDR, false discovery rate. (C) Pathway crosstalk identified from integrative analysis of time course expression data and known pathway interaction data. The crosstalk illustrated in the same layout but nodes (genes) colored and sized in a treatment- and time-specific manner. Current approved drug therapeutics for crosstalk genes based on the ChEMBL database. ATC, anatomical therapeutic chemical; FDA, US Food and Drug Administration.
ATRA and ATO exert synergistic effects on controlling SEPRTs in APL cells. (A) Clustering of SEPRTs after ATRA or ATO treatment using self-organizing map. The left panel shows 3 gene clusters color-coded on the map, with per-hexagon genes labeled (for example, genes in the insert with heatmap showing expression pattern). The right panel shows that each presentation indicates treatment- and time-specific changes, in which upregulated (red), downregulated (blue), and no changed (light yellow) genes are well separated. FC, fold change. (B) Functional enrichments in gene clusters. Gene Ontology Biological Process terms were used for enrichment analysis based on the Fisher exact test (1 sided), with odds ratios and 95% confidence interval calculated. FDR, false discovery rate. (C) Pathway crosstalk identified from integrative analysis of time course expression data and known pathway interaction data. The crosstalk illustrated in the same layout but nodes (genes) colored and sized in a treatment- and time-specific manner. Current approved drug therapeutics for crosstalk genes based on the ChEMBL database. ATC, anatomical therapeutic chemical; FDA, US Food and Drug Administration.
Functional enrichment analysis of gene clusters (Figure 4B; supplemental Table 13) showed that genes in C1 are functionally involved in the apoptotic process and regulation of cell death, such as RUNX2 and CTSH. Genes in C2 are of functional relevance to endocytosis, such as ARRB1 and MAPKAPK3. Genes in C3 are functionally essential for myeloid leukocyte activation (eg, SPI1, SUCNR1, and PIK3CD), suggesting that these genes might contribute to ATRA-induced differentiation. Also, genes associated with coagulation (eg, PLEK and PTPN6) were enriched in C3, suggesting that the effect of ATRA in alleviating coagulation may be attributed to the regulation of SEPRTs as well. We also explored evidence supporting therapeutic potential by identifying the crosstalk between pathways from our time-course expression data and pathway interaction data (see supplemental Methods). This identified synergistically regulated genes (CTSH and PRKCD) and targets (PIK3CD and RRM2) of approved drugs in other diseases, supporting repurposing opportunities and potential efficacy (Figure 4C). Together, these results indicated that ATO and ATRA can act through SEPRTs, likely explaining the combination use in APL therapy.
PML/RARα-activated GFI1 is necessary for the maintenance of APL
The functional significance of PML/RARα-mediated repression in APL has been intensively investigated; however, little attention is paid to PML/RARα-mediated activation. As an exemplar, we performed more detailed functional experiments on GFI1, the gene encoding a TF known to be involved in the development of hematopoietic stem cells39 and lymphocytes.22 We found that GFI1 knockdown induced a partial granulocytic differentiation and apoptosis, promoted the G0/G1 phase arrest, and reduced the colony-forming abilities of NB4 cells (Figure 5A-E; supplemental Figure 6A). This finding was also verified in primary APL blasts (Figure 5F; supplemental Figure 6B).

PML/RARα-activated GFI1 is necessary for the maintenance of APL. (A-E) Detailed shRNA-mediated loss-of-function analyses on PML/RARα-activated GFI1. Western blot was performed to validate the knockdown efficiency of shRNAs targeting GFI1 (A). Knockdown of GFI1 induced partial differentiation (B) and apoptosis (C), promoted the G0/G1 phase arrest (D), and decreased the colony-forming capacity (E). The expression of the cell surface differentiation marker CD11b in shGFI1 positively transfected cells was determined by flow cytometry and the morphology was detected by Wright-Giemsa staining. Apoptosis was detected in NB4 cells after transfection of shRNA constructs for 4 days and determined by Annexin V-APC staining. Data represent the mean of 3 replicates ± SD. **P < .001, ***P < .0001. (F) GFI1 function was verified in primary APL blast cells. GFI1 siRNAs or negative control (N.C.) were transfected into blast cells isolated from 2 primary APL patients. (G) The schematic diagram of the in vivo experiment. Murine APL blasts isolated from transplantable APL mice were transduced with the shRNA targeting Gfi1, and then the shRNA-positive cells with ZsGreen1 expression were sorted and transplanted into the recipient FVB/NJ mice. The shRNA empty vector was used as the control. (H) Altered disease onset of APL after Gfi1 knockdown. PML/RARα-positive leukemia cells separated from APL transplantable mice (n = 6) were transduced with shRNA targeting Gfi1 or vector and then transplanted into recipient mice. The statistical significance was calculated by the log-rank (Mantel-Cox) test. **P < .001. (I) Knockdown of Gfi1 in murine APL cells resulted in no obvious splenomegaly in APL transplantable mice. Left panels show the representative images of the spleen. **P < .001. (J) Murine APL blasts were hardly seen in bone marrow of mice upon Gfi1 knockdown, as shown by representative Wright-Giemsa staining of bone marrow smears. (K) The tumor burden in the peripheral blood of mice transplanted with PML/RARα-positive cells with GFI1 knockdown, as compared with those transplanted with cells without GFI1 knockdown. The left panel shows the total white blood cell counts, and the percentage of GFP-positive abnormal promyelocytes is shown in the right panel. **P < .001.
PML/RARα-activated GFI1 is necessary for the maintenance of APL. (A-E) Detailed shRNA-mediated loss-of-function analyses on PML/RARα-activated GFI1. Western blot was performed to validate the knockdown efficiency of shRNAs targeting GFI1 (A). Knockdown of GFI1 induced partial differentiation (B) and apoptosis (C), promoted the G0/G1 phase arrest (D), and decreased the colony-forming capacity (E). The expression of the cell surface differentiation marker CD11b in shGFI1 positively transfected cells was determined by flow cytometry and the morphology was detected by Wright-Giemsa staining. Apoptosis was detected in NB4 cells after transfection of shRNA constructs for 4 days and determined by Annexin V-APC staining. Data represent the mean of 3 replicates ± SD. **P < .001, ***P < .0001. (F) GFI1 function was verified in primary APL blast cells. GFI1 siRNAs or negative control (N.C.) were transfected into blast cells isolated from 2 primary APL patients. (G) The schematic diagram of the in vivo experiment. Murine APL blasts isolated from transplantable APL mice were transduced with the shRNA targeting Gfi1, and then the shRNA-positive cells with ZsGreen1 expression were sorted and transplanted into the recipient FVB/NJ mice. The shRNA empty vector was used as the control. (H) Altered disease onset of APL after Gfi1 knockdown. PML/RARα-positive leukemia cells separated from APL transplantable mice (n = 6) were transduced with shRNA targeting Gfi1 or vector and then transplanted into recipient mice. The statistical significance was calculated by the log-rank (Mantel-Cox) test. **P < .001. (I) Knockdown of Gfi1 in murine APL cells resulted in no obvious splenomegaly in APL transplantable mice. Left panels show the representative images of the spleen. **P < .001. (J) Murine APL blasts were hardly seen in bone marrow of mice upon Gfi1 knockdown, as shown by representative Wright-Giemsa staining of bone marrow smears. (K) The tumor burden in the peripheral blood of mice transplanted with PML/RARα-positive cells with GFI1 knockdown, as compared with those transplanted with cells without GFI1 knockdown. The left panel shows the total white blood cell counts, and the percentage of GFP-positive abnormal promyelocytes is shown in the right panel. **P < .001.
Moreover, we determined the in vivo role of Gfi1 using a transplantable APL mouse model, which closely mimics human APL with similar biological characteristics.40 PML/RARα-positive leukemic cells from APL transplantable mice were transduced with shRNAs targeting Gfi1 and then transplanted into the recipient FVB/NJ mice (Figure 5G; supplemental Figure 7). As shown in Figure 5H-K, transplantable blasts with Gfi1 knockdown could not efficiently develop leukemia, as characterized by no obvious tumor burden observed in the recipients. The results suggested that GFI1 is necessary for the maintenance of APL.
PML/RARα transactivates GFI1 through chromatin conformation at the super-enhancer region
Since PML/RARα can form as heterodimers or oligomers through the RBCC domain,41 it is tempting to speculate that PML/RARα might transactivate GFI1 through chromatin conformation at the super-enhancer region. We first exploited 3C-PCR42 to examine the chromatin structure at the super-enhancer region of GFI1 in NB4 cells (Figure 6A). There existed 3 PML/RARα-bound cis elements at the GFI1 locus: the promoter (peak 1), the intronic enhancer (peak 2) and the distal enhancer (peak 3). The loop linking the intronic enhancer (peak 2) to the other 2 cis elements showed the strongest interaction, consistent with the highest PML/RARα binding on this site observed in ChIP-seq (top-left panel in Figure 6A).

PML/RARα transactivates GFI1 through chromatin conformation at the super-enhancer. (A) Chromatin conformation of the PML/RARα-bound super-enhancer region on the GFI1 locus in NB4 cells. Genome browser tracks (top-left panel) show 3 PML/RARα binding peaks corresponding to the promoter (assigned by peak 1), the intronic enhancer (peak 2), and the distal enhancer (peak 3) at the super-enhancer region of GFI1, with black bars indicating the cutting sites of HindIII. The interactions among 3 peaks were determined by the 3C-PCR experiments, with results shown in bottom-left panels and the schematic illustration in bottom-right panels. The anchor primers (ie, H1 and H9) are indicated by red bars. The positive and negative interactions between the anchor primer and the paired 3C primer are indicated by green and black bars, respectively. The curve line represents the interaction between the indicated peaks. Also shown are the sequencing results of the cut and religated sequences of the 3C-PCR products (top-right panel), confirming the interactions between peak 1 (H9) and peak 2 (H7), peak 2 (H7) and peak 3 (H1), and peak 1 (H9) and peak 3 (H1). (B) PML/RARα determined the interaction between the intronic enhancer and the promoter of GFI1. The interactions between each pair of 3 cis elements were determined by 3C-PCR with and without PML/RARα protein induced in the PML/RARα-inducible cell line (U937-PR9). (C) PML/RARα-mediated chromatin conformation resulted in the activation of GFI1. The trans activity was determined by the dual luciferase reporter assays in NB4 cells. Peak 1 represents the promoter and peak 2 represents the intronic enhancer as illustrated in Figure 6A. **P < .001. (D-E) PML/RARα oligomerization was required for the chromatin conformation regulation at the GFI1 locus and the subsequent activation of GFI1. The interactions between peaks at the GFI1 locus were examined by 3C-PCR (D) and relative expression of GFI1 detected by reverse transcription (RT)-qPCR (E) in U937 cells transfected with wild-type PML/RARα or PML/RARα mutant (PML/RARα-F158E) for which oligomerization was impaired due to the mutation in the RBCC domain. **P < .001. (F) Schematic illustration of the CRISPR-dCas9-KRAB-mediated interruption of PML/RARα binding and regulation on the super-enhancer of GFI1. sg-GFI1e, targeting the PML/RARα-enriched loci on the GFI1 intronic enhancer (peak 2), was transduced into dCas9-stably expressing NB4 cells. The right panel shows the decrease of PML/RARα binding on the super-enhancer of GFI1 determined by ChIP-qPCR. *P < .01. (G) Direct interruption of PML/RARα binding and regulation on the enhancer region of GFI1 decreased GFI1 expression (left panel) and subsequently induced granulocytic differentiation of NB4 cells (right panel). Relative expression of GFI1 was detected by quantitative reverse transcription qPCR. The percentage of CD11b-positive cells was detected 3 days after sgRNA transduction and determined by flow cytometry. Data represent the mean of 3 replicates ± SD. **P < .001. (H) Direct interruption of PML/RARα binding and regulation on the enhancer region of GFI1 interfered with the occurrence of APL in vivo. The sgRNA-transduced dCas9-expressing NB4 cells targeting GFI1 intronic enhancer were injected into NOD/SCID mice. The Kaplan-Meier analysis was used to estimate the survival of mice. Statistical significance was calculated by the log-rank (Mantel-Cox) test. **P < .001.
PML/RARα transactivates GFI1 through chromatin conformation at the super-enhancer. (A) Chromatin conformation of the PML/RARα-bound super-enhancer region on the GFI1 locus in NB4 cells. Genome browser tracks (top-left panel) show 3 PML/RARα binding peaks corresponding to the promoter (assigned by peak 1), the intronic enhancer (peak 2), and the distal enhancer (peak 3) at the super-enhancer region of GFI1, with black bars indicating the cutting sites of HindIII. The interactions among 3 peaks were determined by the 3C-PCR experiments, with results shown in bottom-left panels and the schematic illustration in bottom-right panels. The anchor primers (ie, H1 and H9) are indicated by red bars. The positive and negative interactions between the anchor primer and the paired 3C primer are indicated by green and black bars, respectively. The curve line represents the interaction between the indicated peaks. Also shown are the sequencing results of the cut and religated sequences of the 3C-PCR products (top-right panel), confirming the interactions between peak 1 (H9) and peak 2 (H7), peak 2 (H7) and peak 3 (H1), and peak 1 (H9) and peak 3 (H1). (B) PML/RARα determined the interaction between the intronic enhancer and the promoter of GFI1. The interactions between each pair of 3 cis elements were determined by 3C-PCR with and without PML/RARα protein induced in the PML/RARα-inducible cell line (U937-PR9). (C) PML/RARα-mediated chromatin conformation resulted in the activation of GFI1. The trans activity was determined by the dual luciferase reporter assays in NB4 cells. Peak 1 represents the promoter and peak 2 represents the intronic enhancer as illustrated in Figure 6A. **P < .001. (D-E) PML/RARα oligomerization was required for the chromatin conformation regulation at the GFI1 locus and the subsequent activation of GFI1. The interactions between peaks at the GFI1 locus were examined by 3C-PCR (D) and relative expression of GFI1 detected by reverse transcription (RT)-qPCR (E) in U937 cells transfected with wild-type PML/RARα or PML/RARα mutant (PML/RARα-F158E) for which oligomerization was impaired due to the mutation in the RBCC domain. **P < .001. (F) Schematic illustration of the CRISPR-dCas9-KRAB-mediated interruption of PML/RARα binding and regulation on the super-enhancer of GFI1. sg-GFI1e, targeting the PML/RARα-enriched loci on the GFI1 intronic enhancer (peak 2), was transduced into dCas9-stably expressing NB4 cells. The right panel shows the decrease of PML/RARα binding on the super-enhancer of GFI1 determined by ChIP-qPCR. *P < .01. (G) Direct interruption of PML/RARα binding and regulation on the enhancer region of GFI1 decreased GFI1 expression (left panel) and subsequently induced granulocytic differentiation of NB4 cells (right panel). Relative expression of GFI1 was detected by quantitative reverse transcription qPCR. The percentage of CD11b-positive cells was detected 3 days after sgRNA transduction and determined by flow cytometry. Data represent the mean of 3 replicates ± SD. **P < .001. (H) Direct interruption of PML/RARα binding and regulation on the enhancer region of GFI1 interfered with the occurrence of APL in vivo. The sgRNA-transduced dCas9-expressing NB4 cells targeting GFI1 intronic enhancer were injected into NOD/SCID mice. The Kaplan-Meier analysis was used to estimate the survival of mice. Statistical significance was calculated by the log-rank (Mantel-Cox) test. **P < .001.
Using a PML/RARα-inducible cell line (supplemental Figure 8A), we found that the interaction between the intronic enhancer and the promoter became significantly stronger upon PML/RARα induction (Figure 6B), confirming the importance of PML/RARα for super-enhancer formation, mainly through binding on the intronic enhancer. To test the outcome of PML/RARα-mediated chromatin conformation, we generated a construct containing the intronic enhancer cloned upstream of the GFI1 promoter and found that this construct resulted in a 2.5-fold increase in luciferase activity compared with the promoter construct lacking the enhancer activity (Figure 6C). We further used PML/RARα-F158E (with the mutation in the RBCC domain impairing oligomerization43 ) to determine the contribution of PML/RARα oligomerization. We found that chromatin conformation at the GFI1 locus was barely seen and the associated transcriptional activation was significantly reduced in mutant cells (Figure 6D-E; supplemental Figure 8B), indicating that PML/RARα, likely oligomerized, transactivated GFI1 through chromatin conformation.
Next, we determined the effect of PML/RARα binding on super-enhancer regulation in APL development using CRIPPR-dCas9-mediated technology,44 which is capable of disrupting PML/RARα binding and eliciting a silencing event on the targeted region. We designed the single guide RNA (sgRNA) targeting the PML/RARα-enriched loci within the intronic enhancer region of GFI1 (sg-GFI1e) and transduced it into dCas9-KRAB stably expressing NB4 cells (Figure 6F). As shown in Figure 6G, the perturbation of PML/RARα binding led to the reduced GFI1 expression, demonstrating that GFI1 activation depended on PML/RARα binding to this enhancer. Also, these sgRNA-transduced dCas9-KRAB-expressing cells were able to differentiate into terminal granulocytes (Figure 6G; supplemental Figure 9). When these cells transplanted into NOD/SCID mice, we found that leukemia could not be efficiently developed (Figure 6H). Together, the in vitro and in vivo evidence demonstrated that PML/RARα-mediated activation on the GFI1 super-enhancer was required for the development of APL.
Analysis of GFI1 targets and evidence supporting coregulation with PML/RARα
We reasoned that analyzing GFI1 targets particularly comparing with PML/RARα targets could allow us to deduce the interplay between GFI1 and PML/RARα in APL cells. We first performed ChIP-seq of GFI1 in NB4 cells and identified 1603 binding sites shared by both PML/RARα and GFI1 (Figure 7A; supplemental Table 14). Interestingly, motif analysis revealed that the most significant motifs were those for myeloid TFs (the top 3 included CEBPA, ETS, and RUNX1) (Figure 7B), whereas for all GFI1 ChIP regions, the most significant was as expected the canonical GFI1 motif (supplemental Figure 10A). This observation was supported by published ChIP-seq data on RUNX145 and the ETS family member FLI146 (Figure 7C; supplemental Figure 10B). This suggested that PML/RARα and GFI1 might be assembled with a number of myeloid TFs to coregulate the corresponding target genes, consistent with the notion that multiple TFs coordinately regulate lineage-specific gene expression.47 Functional enrichment analysis supported that coregulated target genes were indeed of functional relevance to myeloid differentiation and myeloid-related activities (Figure 7D).
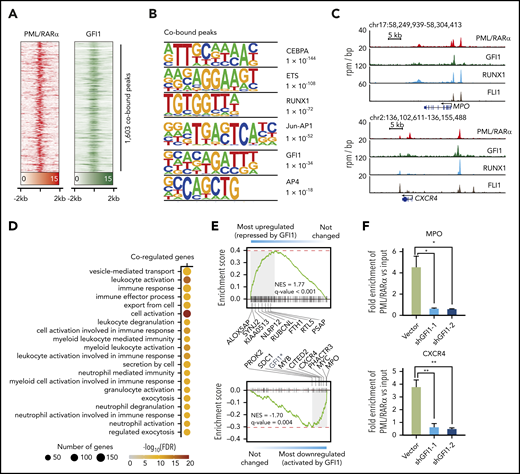
Analysis of GFI1 targets and their association with PML/RARα targets. (A) Heatmap showing the ChIP-seq signals of PML/RARα and GFI1 centering on the binding summit of PML/RARα and GFI1 cobound peaks. (B) Motif analysis of peaks cobound by PML/RARα and GFI1. Top 6 enriched motifs were shown. (C) Genome-browser tracks showing the binding of PML/RARα, GFI1, RUNX1, and FLI1 on the regulatory regions of CXCR4 and MPO in NB4 cells. (D) Gene Ontology enrichment analysis showing Biological Process terms enriched on PML/RARα and GFI1 coregulated genes. (E) GSEA of PML/RARα and GFI1 coregulated genes in terms of differential genes upon shRNA-mediated knockdown of GFI1 (indicated by graded bars). Also labeled are representative genes found at the leading edge. NES, normalized enrichment score. The asterisk indicates that GFI1 downregulation was due to knockdown using shGFI1. (F) Knockdown GFI1 decreased PML/RARα binding on chromatin of GFI1 and PML/RARα cobound and coactivated genes MPO and CXCR4. ChIP-qPCR of PML/RARα binding was performed in NB4 cells with or without GFI1 knockdown. The fold enrichment of ChIPed samples vs input was plotted in the y-axis. *P < .01, **P < .001
Analysis of GFI1 targets and their association with PML/RARα targets. (A) Heatmap showing the ChIP-seq signals of PML/RARα and GFI1 centering on the binding summit of PML/RARα and GFI1 cobound peaks. (B) Motif analysis of peaks cobound by PML/RARα and GFI1. Top 6 enriched motifs were shown. (C) Genome-browser tracks showing the binding of PML/RARα, GFI1, RUNX1, and FLI1 on the regulatory regions of CXCR4 and MPO in NB4 cells. (D) Gene Ontology enrichment analysis showing Biological Process terms enriched on PML/RARα and GFI1 coregulated genes. (E) GSEA of PML/RARα and GFI1 coregulated genes in terms of differential genes upon shRNA-mediated knockdown of GFI1 (indicated by graded bars). Also labeled are representative genes found at the leading edge. NES, normalized enrichment score. The asterisk indicates that GFI1 downregulation was due to knockdown using shGFI1. (F) Knockdown GFI1 decreased PML/RARα binding on chromatin of GFI1 and PML/RARα cobound and coactivated genes MPO and CXCR4. ChIP-qPCR of PML/RARα binding was performed in NB4 cells with or without GFI1 knockdown. The fold enrichment of ChIPed samples vs input was plotted in the y-axis. *P < .01, **P < .001
Next, we conducted RNA-seq experiments in NB4 cells with and without GFI1 knockdown. GSEA showed that coregulated genes were significantly enriched within GFI1-repressed genes (Figure 7E), consistent with the previously identified role of GFI1 as a transcriptional repressor.48 Interestingly, coregulated genes were also significantly enriched within GFI1-activated genes (Figure 7E). When inspecting genes significantly regulated upon PML/RARα knockdown, we found that PML/RARα also activated these GFI1-activated genes, such as CXCR4 and MPO (supplemental Figure 10C). This motivated us to further explore the role of GFI1 on PML/RARα-mediated transactivation on these coregulated genes. We found that the binding of PML/RARα on coactivated genes was dramatically decreased in NB4 cells after GFI1 knockdown (Figure 7F). Together, the results suggested that GFI1 might coordinate with the activating function of PML/RARα on these cobound and coactivated genes.
Discussion
Genome-wide identification of direct targets, particularly a larger number of activated targets, challenges the longstanding view of PML/RARα being a transcriptional repressor. This direct target atlas provides a more complete picture of PML/RARα-driven oncogenesis: PML/RARα represses genes responsible for hematopoiesis and activates super-enhancer genes responsible for APL-specific characteristics.
We redefine the activation role of PML/RARα in APL. Particularly, we provide rich evidence supporting the functional importance of PML/RARα-activated target gene GFI1 in APL. We demonstrate that GFI1 can coordinate with PML/RARα to maintain APL and that PML/RARα-induced differentiation block can be relieved upon GFI1 knockdown. Our findings differ from the previous reports that loss or reduced level of GFI1 impedes generation of granulocytes49,50 but rather support that GFI1 has context-dependent roles in leukemogenesis (in APL depending on PML/RARα). Of note, by reanalyzing the expression data from APL blasts and normal promyelocytes,29 we reveal that GFI1 is maintained at the high expression level in both samples, though PML/RARα-activated targets as a whole tend to be malignant related (APL vs normal promyelocytes) and APL specific (APL vs non-APL AML) (Figure 1D; supplemental Figure 4). It implicates that some of activated targets, such as GFI1, are dedicated to transcriptional programs needed to maintain the promyelocytic stage for APL (maintained consistently) or normal promyelocytes (transiently). We have observed very little overlap of our direct targets with differentially expressed genes reported from the PML/RARα-transgenic preleukemic mice study, in keeping with previous studies.23 These observations call for future studies to clarify the exact function of GFI1 in the initiation and development of APL as well as promyelocyte development.
Equally interesting is that ATO can significantly reverse the activation of GFI1, whereas ATRA has minimal effect (Figure 4A). This seems to be consistent with (1) our observation that ATO, capable of rapidly degrading PML/RARα,41,51 can dramatically reduce PML/RARα, HDAC1, and P300 binding and also interrupt the chromatin conformation at the super-enhancer region of GFI1 (supplemental Figure 11); and (2) the fact that ATRA can release PML/RARα binding only at the late stage of differentiation by activating the ubiquitin proteasome system.52,53
How PML/RARα activates gene expression has been largely undocumented. The prevailing view is that before ATRA treatment, PML/RARα recruits only HDAC1, which is then replaced with P300 after ATRA treatment.3 Our data challenges this view. We show that in the absence of retinoic acid, PML/RARα can interact with abundant P300 and HDAC1 on chromatin (though not necessarily colocalized on the same site of chromatin) to activate gene expression, likely in a ligand-independent manner. Although fetal bovine serum used for cell culture might contain traces of retinoids, the contribution of ATRA might be below the physiological level (supplemental Figure 12). The further addition of the physiological concentration (1 nM) of ATRA has trivial impact on such activation (supplemental Figure 12), supporting ligand independency of PML/RARα-mediated activation. There is considerable evidence to support our findings. Firstly, histone deacetylases (HDACs) may help prevent inappropriate reinitiation of transcription on regulatory regions simultaneously bound by histone acetyltransferases and HDACs.54 Secondly, genome-wide profiling of chromatin-modifying enzymes has indicated that histone acetyltransferases and HDACs can be colocalized on highly active transcribed regions.2,55 Thirdly, histone deacetylases can also act as coactivators at a variety of genes.2,56-58 The tendency of PML/RARα binding on open chromatin rather than compact chromatin14 strongly supports our findings. PML has been reported to exist in the PML/RARα heterodimers/oligomers,59-61 and P300 can interact with wild-type PML or PML/RARα.62,63 It is deducible that P300 might interact with PML/RARα either through PML within the PML-PML/RARα oligomer or through the PML moiety of PML/RARα. Whether an oligomerized PML/RARα forms a complex with both P300 and HDAC1 simultaneously requires more evidence of future studies to support.
Inaddition to the newly identified role of transcriptional activation, we have also found that PML/RARα, likely oligomerized, activates GFI1 through chromatin conformation at the super-enhancer region. This provides the structural basis for the efficient transcriptional activation. PML/RARα could form oligomer via the RBCC domain,43,64 and this property enables PML/RARα to interact with each other to regulate targets through the chromatin conformation in APL.
We note some limitations to our work, which was largely limited by available techniques. First, PML/RARα target genes are identified through integrating RNA-seq (shRNA knockdown) with ChIP-seq (against fusion site); such integration maximizes the power of each technique but cannot distinguish the regulation in a manner whether or not depending on DNA binding. Second, biochemical mechanisms of PML/RARα action on chromatin looping to gene activation await investigation. Third, high-throughput assays are much needed to extensively validate PML/RARα targets, especially activated targets. We anticipate that our work can be further extended with future technological innovations.
Finally, it is worth mentioning that small-molecule compounds selectively targeting super-enhancers have shown tremendous therapeutic potential in inhibiting cancer cell growth.65 Inhibition of PML/RARα-regulated super-enhancers, such as targeting GFI1 demonstrated in this study, may be one of the promising mechanisms that can be exploited pharmacologically to extend the success of ATRA/ATO therapy in APL.
The data reported in this article have been deposited in the Gene Expression Omnibus database (accession numbers GSE126720 and GSE154269).
The online version of this article contains a data supplement.
The publication costs of this article were defrayed in part by page charge payment. Therefore, and solely to indicate this fact, this article is hereby marked “advertisement” in accordance with 18 USC section 1734.
Acknowledgments
The authors gratefully acknowledge the invaluable comments from Hugues de Thé (Université de Paris 7 Denis Diderot, Paris, France), the Center for High-Performance Computing at Shanghai Jiao Tong University for providing the computing platform, and Xujie Zhao for his helpful early inputs on this project.
H.F. is supported by the Program for Professor of Special Appointment (Eastern Scholar) at Shanghai Institutions of Higher Learning. This work was supported, in part, by the National Natural Science Foundation of China (grants 81530003, 81890994, and 81770153) and the National Key Research and Development Program (grant 2019YFA0905900).
Authorship
Contribution: K.W., Z.C., and Y.T. designed the experiments; Y.T., X.W., H.S., R.Z., Y.Z., and W.J. performed the experiments; Y.T., H.F., X.W., and S.L. analyzed the data; K.W. supervised the study and analysis; K.W., Y.T., and H.F. wrote the manuscript; Z.C. and S.C. gave conceptual advice; Z.C. revised the manuscript; and all authors discussed the results and implications and reviewed the manuscript.
Conflict-of-interest disclosure: The authors declare no competing financial interests.
Correspondence: Kankan Wang, Shanghai Institute of Hematology, State Key Laboratory of Medical Genomics, Ruijin Hospital Affiliated to Shanghai Jiao Tong University School of Medicine, 197 Ruijin Er Rd, Shanghai 200025, China; e-mail: kankanwang@shsmu.edu.cn; Zhu Chen, Shanghai Institute of Hematology, State Key Laboratory of Medical Genomics, Ruijin Hospital Affiliated to Shanghai Jiao Tong University School of Medicine, 197 Ruijin Er Rd, Shanghai 200025, China; e-mail: zchen@stn.sh.cn; and Hai Fang, Shanghai Institute of Hematology, State Key Laboratory of Medical Genomics, Ruijin Hospital Affiliated to Shanghai Jiao Tong University School of Medicine, 197 Ruijin Er Rd, Shanghai 200025, China; e-mail: hfang@well.ox.ac.uk.

This feature is available to Subscribers Only
Sign In or Create an Account Close Modal