

Key Points
pDC-AML is characterized by a high frequency of RUNX1 mutations and increased expression of a pDC transcriptional program.
CD123 targeting represents a potential treatment approach for pDC-AML.

Abstract
Plasmacytoid dendritic cells (pDCs) are the principal natural type I interferon–producing dendritic cells. Neoplastic expansion of pDCs and pDC precursors leads to blastic plasmacytoid dendritic cell neoplasm (BPDCN), and clonal expansion of mature pDCs has been described in chronic myelomonocytic leukemia. The role of pDC expansion in acute myeloid leukemia (AML) is poorly studied. Here, we characterize patients with AML with pDC expansion (pDC-AML), which we observe in ∼5% of AML cases. pDC-AMLs often possess cross-lineage antigen expression and have adverse risk stratification with poor outcome. RUNX1 mutations are the most common somatic alterations in pDC-AML (>70%) and are much more common than in AML without pDC expansion and BPDCN. We demonstrate that pDCs are clonally related to, as well as originate from, leukemic blasts in pDC-AML. We further demonstrate that leukemic blasts from RUNX1-mutated AML upregulate a pDC transcriptional program, poising the cells toward pDC differentiation and expansion. Finally, tagraxofusp, a targeted therapy directed to CD123, reduces leukemic burden and eliminates pDCs in a patient-derived xenograft model. In conclusion, pDC-AML is characterized by a high frequency of RUNX1 mutations and increased expression of a pDC transcriptional program. CD123 targeting represents a potential treatment approach for pDC-AML.
Introduction
Plasmacytoid dendritic cells (pDCs) are the principal natural type I interferon, interferon-α (IFN-α)–producing dendritic cells, that play critical roles in the immune response.1,2 Human pDCs can be readily identified by flow cytometry based on high expression of CD123, HLA-DR, and CD303/BDCA2 in the absence of other lineage markers.3 pDCs express the cytokine receptor FLT3 (CD135), whose ligand FLT3L is necessary and sufficient for pDC development from myeloid and lymphoid progenitors,4,5 suggesting the existence of a robust transcriptional program that drives pDC specification and differentiation.6 TCF4, a master transcription factor,7,8 acts jointly with MTG16 and additional factors, such as BCL11A, to promote pDC development9,10 by activating transcription factors involved in pDC differentiation (SPIB, IRF7, and IRF8).7 IRF family members, particularly IRF7, play a key role in activating IFN-I genes by interacting with other important transcription factors, such as RUNX2, SPIB, and NFATC3.11-14 CXXC5 and TET2 have been shown to promote IRF7 expression by maintaining hypomethylation of the IRF7 promoter in pDCs.15
The role of pDCs in malignancy has just begun to unfold. The nature of IFN-α–producing pDCs has led to the hypothesis that pDCs may possess antitumor activities. pDCs, via their secreted IFN-α, promote natural killer cell–mediated killing of tumor cells in vitro.16-18 Topical treatment with imiquimod, one of the best characterized imidazoquinoline compounds and a Toll-like receptor 7 agonist, leads to the recruitment of pDCs and subsequent secretion of IFN-α and granzyme B, which correlate with regression of basal cell carcinoma and melanoma.19,20 In contrast, recent studies have shown that pDC accumulation is associated with progression in different human cancer contexts.21-23 Depletion of pDCs inhibits breast cancer cell growth and metastasis in a mouse model.22 It has been shown that tumor-associated pDCs possess impaired IFN-α production, resulting in a microenvironment that favors regulatory T-cell expansion. In sum, pDCs may have antitumor or protumor effects, depending upon the malignancy and inflammatory context.24
Normally, pDCs account for <1% of total nucleated cells in bone marrow (BM) and peripheral blood.25-27 Neoplastic expansion of pDCs or pDC precursors leads to blastic plasmacytoid dendritic cell neoplasm (BPDCN),28,29 and clonal expansion of mature pDCs has been reported in chronic myelomonocytic leukemia (CMML).30 In contrast, the role of pDC expansion in acute myeloid leukemia (AML) remains to be elucidated. A few small patient series have reported skin, nodal, and marrow pDC expansion in AML,31-37 and a possible correlation with FLT3ITD mutations has been proposed.38,39 In 2018, we reported our preliminary analysis of 24 patients with AML with pDC expansion, suggesting that this might represent an entity with distinct genetic and biologic features.40 Here, we performed detailed genetic, transcriptional, and functional characterization of patients with AML with pDC expansion (pDC-AML) and investigate potential therapeutic interventions for this specific AML subset.
Patients and methods
Patients
Patients with AML were identified from the patient database at the Memorial Sloan Kettering Cancer Center (MSKCC) between January 2014 and December 2019. The key words “plasmacytoid dendritic cells” or “plasmacytoid dendritic cell” were searched for flow cytometric and pathology reports. The clinical, morphologic, immunophenotypic, and cytogenetic/molecular results were independently reviewed again by 3 hematopathologists (W.X., A.C. and M.R.). This study was approved by the Institutional Review Board at MSKCC.
Additional details about additional patient cohorts, cell culture, flow cytometric sorting and analysis, chromosome analysis, fluorescent in situ hybridization studies, sequencing studies, patient-derived xenograft, and statistics are included in the supplemental Methods (available on the Blood Web site).
Results
A subset of AML is characterized by increased levels of pDCs
pDCs were identified by their characteristic immunophenotype on flow cytometry3,6 : specifically low side scatter and CD45 (dim), CD123 (bright), and HLA-DR surface expression (Figure 1A-B; supplemental Figure 1; supplemental Tables 1 and 2). CD303 was also evaluated in a subset of subjects. The median proportion of pDCs in normal marrow controls was 0.29% (interquartile range [IQR], 0.19-0.37) (Figure 1C). pDCs were markedly depleted in the BM of the majority of patients with AML, with a median pDC proportion of 0.03% (IQR, 0.006-0.14%), a 10-fold reduction compared with normal controls (P < .001). Although none of the normal controls had >1% pDCs, there have been reports of as high as 1.6% pDCs in other normal control cohorts.26 Therefore, 2% was chosen to delineate a stringent cutoff for pDC expansion, which is equivalent to 10 standard deviations (SDs) from the mean pDC level of normal controls. Among 850 AML patients, we identified 26 AML patients with ≥2% pDCs in their diagnostic marrow samples. In addition, 16 AML patients had ≥2% pDCs at a later time point after diagnosis (either with persistent disease or relapse). Therefore, 4.9% (42/850) of total patients with AML in our study cohort had pDC expansion (hereafter referred to as pDC-AML). In these patients, the proportion of pDCs ranged from 2.2% to 35.9%, with a median of 7.7% (IQR, 3.4-9.9; P < .0001 vs normal control) (Figure 1C).
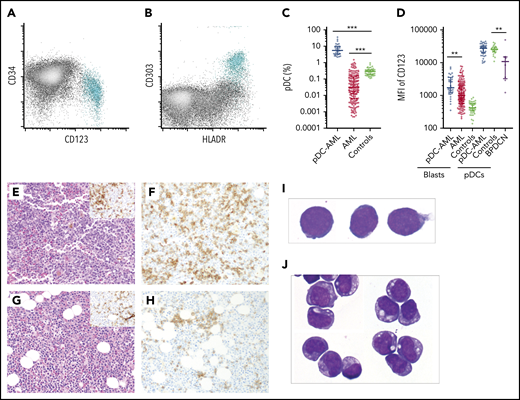
Increased pDCs in a subset of AML. (A-B) Flow cytometric identification of pDCs (aqua population represents pDCs). (C) pDC proportion (percentage of white blood cells) in BM aspirates from patients with AML and normal controls (median ± IQR). AML, AML without pDC expansion; Controls, normal subjects; pDC-AML, AML with pDC expansion. (D) CD123 levels on CD34+ blasts and pDCs (median ± IQR). (E) Hematoxylin and eosin stain of BM biopsy from a representative patient with pDC-AML (inset: anti-CD34 immunostain). (F) Anti-CD123 immunostain of the patient from panel E. (G) Hematoxylin and eosin stain of BM biopsy from another representative patient with pDC-AML (inset: anti-CD34 immunostain). (H) Anti-CD123 immunostain of the patient in panel G. (I-J) Wright-Giemsa stain of flow-sorted leukemic blasts (I) and pDCs (J) from pDC-AML. **P < .01, ***P < .001. Original magnification, ×200 (E-H) and ×1000 (I-J). MFI, mean fluorescence intensity.
Increased pDCs in a subset of AML. (A-B) Flow cytometric identification of pDCs (aqua population represents pDCs). (C) pDC proportion (percentage of white blood cells) in BM aspirates from patients with AML and normal controls (median ± IQR). AML, AML without pDC expansion; Controls, normal subjects; pDC-AML, AML with pDC expansion. (D) CD123 levels on CD34+ blasts and pDCs (median ± IQR). (E) Hematoxylin and eosin stain of BM biopsy from a representative patient with pDC-AML (inset: anti-CD34 immunostain). (F) Anti-CD123 immunostain of the patient from panel E. (G) Hematoxylin and eosin stain of BM biopsy from another representative patient with pDC-AML (inset: anti-CD34 immunostain). (H) Anti-CD123 immunostain of the patient in panel G. (I-J) Wright-Giemsa stain of flow-sorted leukemic blasts (I) and pDCs (J) from pDC-AML. **P < .01, ***P < .001. Original magnification, ×200 (E-H) and ×1000 (I-J). MFI, mean fluorescence intensity.
pDCs and blasts from pDC-AML are immunophenotypically distinct from those from AML without pDC expansion
We next performed immunophenotypic characterization of pDCs in pDC-AML samples and compared this with a cohort of BPDCN samples. CD123 was universally expressed on BPDCN cells, albeit at lower levels compared with normal pDCs, as previously reported (median of mean fluorescence intensity [MFI]): 10 855, P = .0045 vs normal controls, P = .0015 vs pDC-AML) (Figure 1D).41 By contrast, we found that pDCs in pDC-AML patients had high levels of CD123 expression, similar to pDCs from normal controls (MFI, 27 613 vs 25 611, P = .7). pDC distribution in AML, as demonstrated by CD123 immunohistochemical staining, showed a predominantly interstitial pattern throughout the marrow intermixed with, but distinct from, CD34+ leukemic blasts (Figure 1E-F). Although small loose clusters of pDCs were also noted (Figure 1G-H), large aggregates, as seen in CMML, were not observed. Flow cytometry assisted sorting (FACS)-purified leukemic blasts and pDCs displayed distinct blastic and plasmacytoid morphology, respectively (Figure 1I-J). The pDCs from patients with pDC-AML expressed CD4, CD123, and HLA-DR at levels comparable to normal pDCs. However, they also frequently showed aberrant expression of CD56 (4/30; 13%), CD34 (25/41; 61%), CD5 (5/29, 17%), CD13 (17/41, 41%), and cytoplasmic terminal deoxynucleotidyltransferasede (4/10, 40%). Other markers expressed by normal pDCs were positive in only a subset of patients with pDC-AML, including CD303 (7/10, 70%), CD2 (8/29, 28%), and CD33 (11/33; 33%) (supplemental Figure 1; supplemental Table 2). This immunophenotype appears to be intermediate between normal pDCs and BPDCN41 and shows maturational continuity with the leukemic blasts.36,37
The leukemic blasts from 13 of 41 (32%) pDC-AML patients showed expression of ≥2 crosslineage antigens (including CD2, cytoplasmic CD3, CD5, CD7, CD10, CD19, cytoplasmic CD79a) compared with only 3 of 100 (3%) AML patients without pDC expansion (P < .0001; Table 1). Eight of 41 (20%) patients met the immunophenotypic criteria (based on cytoplasmic CD3, CD19, and cytoplasmic CD79a) of mixed phenotype acute leukemia in contrast to only 2 of 100 (2%) patients with AML without pDC expansion (P < .0001; Table 1, supplemental Figure 1; supplemental Table 3). However, these 10 patients with mixed phenotype in both groups carried a diagnosis of secondary AML, which precludes a diagnosis of de novo mixed phenotype acute leukemia.42 Eighteen pDC-AML patients showed monocytic differentiation based on flow cytometric evidence of immature monocytes (≥5%) and/or CD64 expression on the leukemic blasts. After induction therapy, the number of pDCs declined significantly in proportion to the reduction in leukemic blasts (supplemental Figure 2A).
Clinicopathologic features of pDC-AML
| pDC-AML at diagnosis(n = 26) | pDC-AML late (n = 16) | pDC-AML (combined)(n = 42) | AML without pDC expansion (n = 100) | |
|---|---|---|---|---|
| Age, median (IQR), y | 72 (65-77)* | 59 (35-70) | 68 (58-76) | 62 (50-70) |
| Sex, male/female, n | 19/7 | 12/4 | 31/11 | 56/44 |
| Prior therapy, n | 7 (5 HMA, 1 lenalidomide, 1 HMA + lenalidomide) | 2 (2 HMA) | 9 (7 HMA, 1 lenalidomide, 1 HMA + lenalidomide) | 22 (20 HMAs, 1 HMA + ruxolitinib, 1 anti-CD33) |
| Prior allo-HSCT, n | 0 | 0 | 0 | 3 |
| History of MDS/CMML, n | 9/1 | 4/0 | 13/1 | 21/7 |
| CBC at diagnosis | ||||
| WBC, ×109/L, median (IQR) | 3.5 (1.2-9.1) | 6.5 (1.3-26.5) | 4.1 (1.2-11.5) | 3.5 (1.8-8.9) |
| ANC, ×109/L, median (IQR) | 0.55 (0.20-2.8) | 0.60 (0.18-4.5) | 0.55 (0.20-3.0) | 0.6 (0.2-1.9) |
| Absolute monocytes, ×109/L, median (IQR) | 0.20 (0.0-1.4) | 0.10 (0.0-2.3) | 0.15 (0.0-1.6) | 0.10 (0-0.75) |
| Hb, g/dL, median (IQR) | 8.5 (7.5-9.8) | 8.5 (7.1-11.2) | 8.5 (7.5-12.6) | 8.9 (7.6-10.4) |
| PLT, ×109/L, median (IQR) | 78 (39-105)* | 44 (27-64) | 63 (37-97) | 53 (27-114) |
| Blasts, median (IQR), % | 0 (0-19)* | 28 (0-63) | 2.5 (0-30)† | 20 (5-47) |
| BM blasts, median (IQR), % | 37 (27-66) | 42 (22-80) | 37 (24-69) | 42 (30-65) |
| BM cellularity, median (IQR), % | 70 (30-80) | 60 (30-100) | 65 (30-80)† | 80 (60-90) |
| Extramedullary disease, n (%)/sites | 6 (23)/(5 skin, 1 lymph node) | 1 (6)/(skin and lymph node) | 7 (17)/(6 skin, 2 lymph node) | 8 (8)/(3 skin, 1 lymph node, 1 lung, 1 breast, 1 ovary, 1 soft tissue) |
| ≥2 Cross lineage markers, n (%) | 6/25 (24) | 7/16 (44) | 13/41 (32)‡ | 3 (3) |
| Blast CD123 MFI, median (IQR) | 2538 (1146-3563)* | 1108 (765-1682) | 1773 (1006-3077)‡ | 1008 (673-1936) |
| ECOG status documented, n | 19 | 10 | 29 | 61 |
| 0 | 12 | 5 | 17 | 35 |
| 1 | 5 | 4 | 9 | 24 |
| 2 | 0 | 1 | 1 | 2 |
| 3 | 2 | 0 | 2 | 0 |
| AML WHO classification, n | ||||
| De novo AML | 12 | 8 | 20 | 55 |
| Therapy-related AML | 2 | 2 | 4 | 17 |
| AML-MRC | 12 | 6 | 18 | 28 |
| CG risk stratification, n | ||||
| Favorable | 0 | 0 | 0 | 8 |
| Intermediate | 20 | 11 | 31 | 67 |
| Normal karyotype | 7 | 8 | 15 | 41 |
| Unfavorable | 5 | 4 | 9 | 21 |
| Complex karyotype | 2 | 0 | 2 | 12 |
| Unavailable | 1 | 1 | 2 | 4 |
| ELN risk stratification, n | ||||
| Favorable | 0 | 0 | 0 | 23 |
| Intermediate | 3 | 4 | 7 | 41 |
| Adverse | 23 | 7 | 30‡ | 35 |
| Unavailable | 0 | 5 | 5 | 1 |
| Response, n (%) | ||||
| CR | 6 (23) | 7 (44) | 13 (31) | 62 (62) |
| CRi | 1 (4) | 2 (13) | 3 (7) | 9 (9) |
| MLFS | 1 (4) | 1 (6) | 2 (5) | 5 (5) |
| PR | 2 (8) | 2 (13) | 4 (10) | 5 (5) |
| Induction therapy, n | 9 | 12 | 21 | 100 |
| Consolidation therapy, n | 6 | 6 | 12 | 39 |
| HSCT, n (%) | 5 (19) | 11 (69) | 16 (38) | 61 (61) |
| Relapse post-HSCT | 2 (40) | 4 (36) | 6 (38) | 8 (13) |
| Median overall survival from diagnosis, mo | 15.9* | 30.8 | 18.8 | 36.7 |
allo-HSCT, allogeneic hematopoietic stem cell transplantation; AML-MRC, AML with myelodysplasia-related changes; ANC, absolute neutrophil count; CBC, complete blood count; CG, cytogenetic; CR, complete remission; CRi, incomplete remission; ECOG, Eastern Cooperative Oncology Group; ELN, European LeukemiaNet; Hb, hemoglobin; HMA, hypomethylating agent; HSCT, hematopoietic stem cell; MDS, myelodysplastic syndrome; MLFS, morphologic leukemia-free state; PLT, platelets; PR, partial response; WBC, white blood cell; WHO, World Health Organization.
P < .05, Student t test, pDC-AML at diagnosis vs pDC-AML late.
P < .05, Student t test, pDC-AML (combined) vs AML without pDC expansion.
P < .0001, Fisher’s exact test, pDC-AML (combined) vs AML without pDC expansion.
pDC-AML is associated with poor prognosis
Patients with pDC-AML had a median age of 68 years (IQR, 58-76) and male predominance (male/female ratio, 2.8:1) (Table 1; supplemental Table 4), similar to patients with AML without pDC expansion (referred to as AML) and patients with BPDCN (data not shown). Secondary AML (AML with myelodysplasia-related changes and therapy-related AML) were ∼50% in both cohorts (22/42 in pDC-AML vs 45/100 in AML). Patients with pDC-AML had fewer circulating blasts (median 2.5% vs 20% in AML; P < .05). Skin involvement was more common in pDC-AML (6/42 [14%] vs 3/100 [3%] in AML; P = .01) but less frequent than in BPDCN (7/9 [78%]; P = .004). Cytogenetic abnormalities were identified in 25 of 40 (62.5%) patients with pDC-AML (results not available in 2 patients), and 9 of 40 (23%) pDC-AML patients had adverse cytogenetics, not different from the AML cohort (59% and 22%, respectively). The most common abnormality was del7 (5/40; 13%). Only 3 of 40 (7.5%) had trisomy 13. Thirty of 37 patients with pDC-AML (81%; unable to evaluate in 5 patients) had adverse risk based on European LeukemiaNet stratification compared with 35 of 99 (35%) in the AML cohort (P < .0001). Twenty-one of 42 (50%) patients with pDC-AML received induction therapy compared with 100% in the AML cohort (P < .0001). Six of 16 (38%) pDC-AML patients relapsed after allogeneic hematopoietic stem cell transplantation compared with 8 of 61 (13%) in the AML cohort (P = .07). The median survival of patients with pDC-AML was 18.8 months, which was shorter than for the AML cohort (36.7 months; P < .08) (supplemental Figure 2B). When using 2% as a cutoff, increased pDCs at diagnosis were associated with inferior outcome in AML by univariate analysis (hazard ratio, 2.1; 95% confidence interval [CI]: 1.2-3.7; P = .01), but its prognostic value was not significant after controlling for age and European LeukemiaNet risk (hazard ratio, 0.70; 95% CI, 0.4-1.4; P = .3). We also compared patients with pDC-AML with pDC expansion at diagnosis with those who only manifested expanded pDCs after diagnosis. The former had a higher median age (72 vs 59 years; P < .05), higher platelet counts (median 78 × 109/L vs 44 × 109/L; P < .05), and fewer circulating blasts (0% vs 28%; P < .05) (Table 1). Patients with pDC-AML with pDC expansion at diagnosis had shorter median overall survival (15.9 vs 30.8 months compared with those with expanded pDCs only after diagnosis; P < .05) (supplemental Figure 2C).
pDC-AML is characterized by frequent RUNX1 mutations
Targeted sequencing analysis revealed that 32 of 41 (78%) patients with pDC-AML had RUNX1 aberrations, including 29 patients with RUNX1 mutations (34 total mutations; Figure 2A). These mutations were split between missense (18) and nonsense/frame shift (16), with the majority within the RUNT DNA binding domain (Figure 2B). Two patients had atypical RUNX1 translocations: t(8;21) with PLAG1 and t(15;21) with SPATA5L1 as the fusion partners; both fusions retained the RHD and TAD domains of RUNX1 at the 3′ end of the fusion proteins, and 1 patient had a deletion of the region including RUNX1. By comparison, 14 of 100 (14%) of the patients with AML without pDC expansion and 0 of 7 patients with BPDCN had RUNX1 mutations (P < .0001; Table 1 and data not shown). Twelve of 18 (67%) patients with pDC-AML with monocytic differentiation had RUNX1 mutations. Ten of 29 patients with RUNX1 mutations had germline controls (nail DNA). Among the 19 patients with RUNX1 mutations who did not have germline controls, 14 had variant allele frequencies (VAFs) of RUNX1 mutations <30%, and 5 had VAFs >40%.
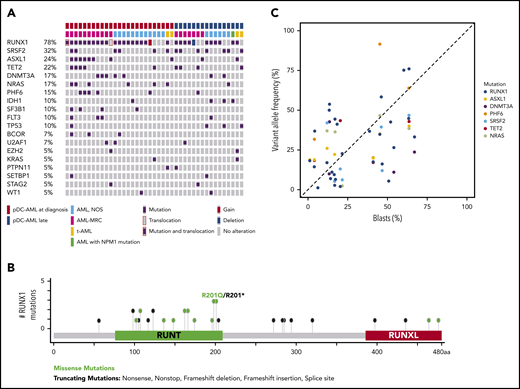
RUNX1 mutations in pDC-AML. (A) Oncoplot of mutations in pDC-AML. (B) Lollipop graph of RUNX1 mutations in pDC-AML. (C) VAF of the major mutations compared with blast percentages. AML, NOS, AML not otherwise specified; AML-MRC, AML with myelodysplasia-related changes; t-AML: therapy-related AML.
RUNX1 mutations in pDC-AML. (A) Oncoplot of mutations in pDC-AML. (B) Lollipop graph of RUNX1 mutations in pDC-AML. (C) VAF of the major mutations compared with blast percentages. AML, NOS, AML not otherwise specified; AML-MRC, AML with myelodysplasia-related changes; t-AML: therapy-related AML.
Other recurrent mutations observed in patients with pDC-AML included SRSF2 (n = 13; 32%), ASXL1 (n = 10; 24%), TET2 (n = 9; 22%), DNMT3A (n = 7; 17%), NRAS (n = 7; 17%), PHF6 (n = 6; 15%), IDH1 (n = 4; 10%), SF3B1 (n = 4; 10%), FLT3 (n = 4; 10%), and TP53 (n = 4; 10%). Sixteen of 29 (55%) patients with RUNX1 mutations had ≥1 mutation commonly observed in clonal hematopoiesis (TET2, ASXL1, and DNMT3A). Six patients had TET2 and SRSF2 concurrent mutations, including the 1 patient with a history of CMML. Based on the VAFs and the blast percentage, RUNX1 mutations were present in the dominant clones in 26 of 29 (90%) patients (Figure 2C; supplemental Table 5). Two of 4 patients with pDC-AML with TP53 mutations had concurrent RUNX1 mutations and the VAF of TP53 mutations in the RUNX1-mutant cases was <5%, suggesting a minor TP53-mutant subclone and a dominant RUNX1-mutant clone.
pDCs share identical mutations and cytogenetic abnormalities with leukemic blasts
We next assessed whether pDCs in pDC-AML were clonally derived from the leukemic clone. We used FACS to purify leukemic blasts and pDCs from 9 patients for paired genomic analysis. Monocytes and T cells were also sorted from a subset of patients. Targeted sequencing and fluorescent in situ hybridization studies were performed on sorted cells from 7 and 2 patients, respectively. As shown in Table 2, the sorted pDCs shared identical mutations and/or cytogenetic abnormalities with the leukemic blasts in all 9 patients. Moreover, the VAFs of these mutations were comparable between pDCs and blasts. Monocytes sorted from 3 patients also had the same mutations and abnormalities, whereas sorted T cells from 5 patients were negative for all mutations and abnormalities. Collectively, these results indicate that pDCs are neoplastic in origin and are clonally related to the leukemic blasts.
Shared genetic abnormalities between sorted blasts and pDCs from pDC-AML
| Patient | Shared variants and cytogenetic abnormalities | VAF, % | |||
|---|---|---|---|---|---|
| Blasts | pDCs | Monocytes | T cells | ||
| 1 | RUNX1 D198G | 48.9 | 48.5 | NA | NA |
| NRAS G12D | 27.9 | 35.3 | |||
| WT1 R380Tfs*5 | 13.9 | 8.2 | |||
| FLT3 I836del | 10.1 | 5.6 | |||
| FLT3D835Y | 2.2 | 0.2 | |||
| 2 | SRSF2 P95H | 39.9 | 52.8 | NA | NA |
| ASXL1 E635Rfs*15 | 19.0 | 22.2 | |||
| KITD816V | 4.0 | 2.0 | |||
| 3 | RUNX1 A435Gfs*165 | 37.6 | 44.2 | NA | NA |
| 4 | RUNX1 L98fs*24 | 45.2 | 44.7 | NA | 0 |
| DNMT3A G543C | 52.5 | 47.5 | 0 | ||
| DNMT3AI715Gfs*69 | 19.9 | 20.0 | 0 | ||
| 5 | RUNX1 D62Rfs*11 | 3.2 | 2.0 | 3.9 | NA |
| TET2 Q743* | 82.6 | 96.4 | 50.4 | ||
| TET2 R1465* | 14.9 | 3.5 | 50.1 | ||
| SRSF2 P95L | 37.8 | 49.3 | 27.3 | ||
| CBL L380P | 27.3 | 19.3 | 21.3 | ||
| NRAS G12V | 7.8 | 1.4 | 17.0 | ||
| KRAS G12R | 1.5 | 0.1 | 2.7 | ||
| Trisomy 8 | 22.7 | 21 | 85 | 0 | |
| 6 | JARID2 E50Afs*8 | 86.7 | 88.3 | NA | NA |
| 7 | RUNX1 V164_G165reSWGCP | 34 | 35 | NA | 0 |
| PHF6 C283F | 97 | 98 | 0 | ||
| SRSF2 P96L | 50 | 53 | 0 | ||
| TET2 Q964* | 47 | 52 | 0 | ||
| ASXL1 P701fs*2 | 46 | 50 | 0 | ||
| NF1 S2309T | 30 | 29 | 0 | ||
| NF1 P2310N | 30 | 29 | 0 | ||
| 8 | CRLF2 fusion | 27.5 | 25 | 19.5 | 0 |
| 9 | Deletion of 7q31 | 98 | 98 | 99 | 0 |
NA, sorted population not available for analysis.
Leukemic blasts from pDC-AML show increased pDC differentiation potential
Our genetic data suggest the possibility that pDCs can differentiate from leukemic clones. To address this, we established an in vitro culture system that induces pDC differentiation from hematopoietic stem/progenitor cells (HSPCs). We cultured cells in FLT3L (100 ng/mL), stem cell factor (10 ng/mL), and thrombopoietin (50 ng/mL)–containing serum-free media (supplemental Figure 3) and assessed pDC differentiation potential with these basal conditions and with the addition of other cytokines/factors. Under these conditions, we were able to efficiently differentiate pDCs from cord blood. The pDCs differentiated from cord blood cells showed characteristic surface expression of CD123, HLA-DR, and CD303 (supplemental Figure 3E-F) and plasmacytoid cytomorphology (data not shown). StemRegenin 1, a small molecule that activates the aryl hydrocarbon receptor, has previously been shown to increase hematopoietic stem cell self-renewal,43 platelet production,44 and pDC differentiation.16,45,46 Consistent with this, pDC output from cord blood CD34+ cells was increased by nearly 10-fold by adding StemRegenin 1 to basal culture conditions (supplemental Figure 3A,C). pDC output from granulocyte colony-stimulating factor–mobilized peripheral blood CD34+ HSPCs was 10-fold lower than that from cord blood HSPCs (supplemental Figure 3B,D).
We then FACS-purified leukemic blasts from pDC-AML (n = 5), as well as AML without pDC expansion, but with or without RUNX1 mutations (n = 5 and n = 10, respectively) (Figure 3A-C). We used CD34+ cord blood cells as controls (n = 10). After 2 weeks of in vitro culture, CD34+ cord blood cells generated a mean of 10.8% pDCs (standard error of the mean [SEM], 1.6%; 95% CI, 7.2-14.5). The leukemic blasts from patients with pDC-AML had 2.5-fold higher pDC output than did cord blood–derived cells, with a mean of 26.8% pDCs (SEM, 4.6%; 95% CI, 14.1-39.6; P < .001 vs cord blood) (Figure 3A,D). In contrast, leukemic blasts from patients with AML without RUNX1 mutations and without pDC expansion in vivo failed to produce pDCs in vitro (Figure 3C,D). Interestingly, leukemic blasts from patients with AML with RUNX1 mutations who did not show pDC expansion in their clinical isolates were able to differentiate into pDCs, with a mean of 12.7% pDCs (SEM, 4.6%; 95% CI, 0.4-25.1; P < .04 vs pDC-AML, P < .001 vs AML without RUNX1 mutations), equivalent to pDC differentiation/expansion potential from CD34+ cord blood cells (Figure 3B,D). Leukemic blasts from pDC-AML had higher pDC output at 2 weeks (mean, 23.7%; SEM, 7.6%) than did CD34+ cord blood cells (mean, 7.7%; SEM, 5.6%; P < .09), and they continued to generate increased levels of pDCs for 4 weeks (mean, 32.3% at 3 weeks and 30.5% at 4 weeks, P < .018 and 0.018, respectively, vs cord blood mean, mean, 3.7% at 3 weeks and 2.1% at 4 weeks) (Figure 3E). pDCs generated in vitro had a typical pDC immunophenotype and cytomorphology (Figure 3F). In total, these experiments provide in vitro evidence that suggests that leukemic blasts from pDC-AML have an intrinsic propensity to differentiate into pDCs.
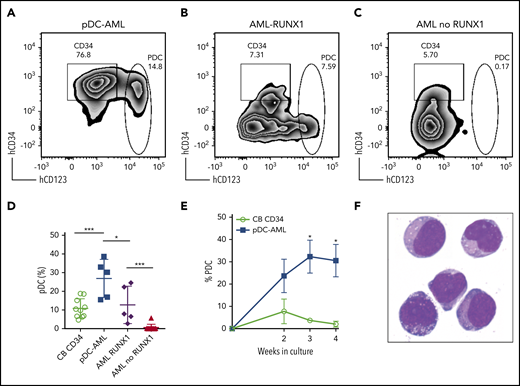
Leukemic blasts from pDC-AML and AML with RUNX1 mutations have greater differentiation propensity to pDCs in vitro. (A-C) The sorted leukemic blasts were cultured in vitro for 2 weeks and subjected to immunophenotyping by flow cytometry. (D) pDC proportions in the culture after 2 weeks were compared. Data are mean ± SD. (E) Time course experiments showed that a high pDC proportion persisted from the leukemic blasts of pDC-AML. Data are mean ± SEM. (F) Wright-Giemsa staining of sorted pDCs (were CD303+ and had bright CD123 and HLA-DR expression and were negative for CD11b, CD14, CD19, CD3, and CD56) from the in vitro culture. AML RUNX1, AML with RUNX1 mutations but no pDC expansion; AML no RUNX1, AML without RUNX1 mutations or pDC expansion. *P < .05, ***P < .001. Original magnification, ×1000 (F).
Leukemic blasts from pDC-AML and AML with RUNX1 mutations have greater differentiation propensity to pDCs in vitro. (A-C) The sorted leukemic blasts were cultured in vitro for 2 weeks and subjected to immunophenotyping by flow cytometry. (D) pDC proportions in the culture after 2 weeks were compared. Data are mean ± SD. (E) Time course experiments showed that a high pDC proportion persisted from the leukemic blasts of pDC-AML. Data are mean ± SEM. (F) Wright-Giemsa staining of sorted pDCs (were CD303+ and had bright CD123 and HLA-DR expression and were negative for CD11b, CD14, CD19, CD3, and CD56) from the in vitro culture. AML RUNX1, AML with RUNX1 mutations but no pDC expansion; AML no RUNX1, AML without RUNX1 mutations or pDC expansion. *P < .05, ***P < .001. Original magnification, ×1000 (F).
Leukemic blasts recapitulate the phenotype of pDC-AML in vivo
We next established a patient-derived xenograft (PDX) model to further characterize pDC-AML. Peripheral blood mononuclear cells isolated from 6 patients with pDC-AML were introduced into sublethally irradiated NSG mice by tail vein injection, and human CD45+ cells were detected at >0.1% in the peripheral blood of all recipients at 3 and 6 months (supplemental Table 6).47 However, only 1 pDC-AML clinical isolate reproducibly generated overt AML in recipient mice. This PDX showed a nearly identical immunophenotype to the original leukemia, with high levels of CD34+ leukemic blasts and increased pDCs (supplemental Figure 4). We then harvested BM cells from primary recipients and transplanted them into secondary NSG recipients in 3 groups: whole BM, FACS-purified leukemic blasts, and FACS-purified pDCs. Unsorted BM cells (1 million cells per mouse) faithfully recapitulated pDC-AML in secondary recipient mice (Figure 4). Sorted leukemic blasts (0.5 million per mouse) also gave rise to AML with increased pDCs (Figure 4A-D,F). In contrast, sorted pDCs (0.5 million per mouse) displayed nearly undetectable engraftment in secondary NSG recipient mice up to 8 weeks posttransplant (Figure 4A-B,E). Collectively, these data provide in vitro and in vivo evidence indicating that pDCs originate from leukemic blasts but, alone, cannot initiate leukemia in vivo.
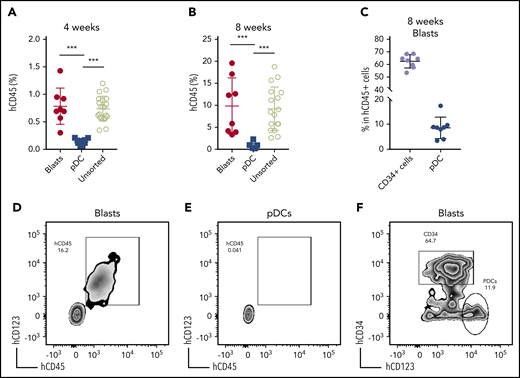
Leukemic blasts differentiate into pDCs in vivo. (A-B) BM cells were harvested from the primary NSG mice receiving pDC-AML leukemic cells, as described in supplemental Figure 4 and supplemental Table 6. The unsorted BM cells, purified leukemic blasts, and purified pDCs were injected IV into secondary NSG mice. Engraftment of human CD45+ cells was evaluated from peripheral blood 4 weeks (A) and 8 weeks (B) after transplant. (C) pDC-AML phenotype in the secondary NSG mice receiving purified leukemic blasts. Data are mean ± SD. (D-E) Representative flow plots showing hCD45+ cells in the secondary NSG mice receiving purified blasts (D) or pDCs (E). (F) Representative flow plot showing pDC-AML phenotype in hCD45+ cells from panel D. ***P < .001.
Leukemic blasts differentiate into pDCs in vivo. (A-B) BM cells were harvested from the primary NSG mice receiving pDC-AML leukemic cells, as described in supplemental Figure 4 and supplemental Table 6. The unsorted BM cells, purified leukemic blasts, and purified pDCs were injected IV into secondary NSG mice. Engraftment of human CD45+ cells was evaluated from peripheral blood 4 weeks (A) and 8 weeks (B) after transplant. (C) pDC-AML phenotype in the secondary NSG mice receiving purified leukemic blasts. Data are mean ± SD. (D-E) Representative flow plots showing hCD45+ cells in the secondary NSG mice receiving purified blasts (D) or pDCs (E). (F) Representative flow plot showing pDC-AML phenotype in hCD45+ cells from panel D. ***P < .001.
Leukemic blasts from pDC-AML upregulate a pDC transcriptional program
Transcriptional profiling was performed to elucidate the gene-regulatory programs underlying the ability of leukemic blasts from pDC-AML to differentiate into pDCs. CD34+ blasts and pDCs were sorted from patients with pDC-AML and from normal controls. Based on our identification of RUNX1 mutations as highly enriched in pDC-AML, we hypothesized that this genetic event may confer a pDC transcriptional program to leukemic blasts. To address this possibility, we sorted CD34+ blasts from patients with AML (no pDC expansion), with and without mutations in RUNX1. Principal component analysis revealed that pDCs from pDC-AML clustered independently from normal pDCs and from leukemic blasts, consistent with their neoplastic origin and their retention of a pDC transcriptional program (Figure 5A). To determine whether blasts from pDC-AML or AML with RUNX1 mutations upregulate a pDC transcriptional signature, we calculated a normalized single sample GSEA score based on expression of previously established pDC genes (Figure 5B; supplemental Figure 5A).48,49 This analysis showed that blasts from pDC-AML significantly upregulated a pDC transcriptional program compared with blasts from AML without RUNX1 mutations (no pDCs). As an orthogonal approach, we identified upregulated genes, with respect to normal marrow CD34+ cells, shared between different groups of leukemic blasts and normal pDCs, and confirmed our observations (supplemental Figure 5B). Blasts from AML with RUNX1 mutation (no pDCs) had greater enrichment of a pDC transcriptional program than did blasts from AML without RUNX1 mutation (no pDCs), but this difference was not statistically significant (supplemental Figure 5B). To identify the specific transcriptional program of blasts from pDC-AML and AML with RUNX1 mutations, we focused on those upregulated genes shared between these groups and shared with normal pDCs (Figure 5C-D). Gene ontology analysis of this gene subset or of genes upregulated in pDC-AML blasts identified inflammatory pathways and interferon signaling as highly enriched processes, an intriguing finding because these processes contribute to pDC development (Figure 5E; supplemental Figure 5C). Consistent with these findings, we observed that several genes that are involved in the IFN response were highly upregulated in normal pDCs and neoplastic pDCs, moderately upregulated in blasts from pDC-AML and AML with RUNX1 mutations, but not upregulated in blasts from AML without RUNX1 mutations (Figure 5F). In total, this suggests that leukemic blasts from pDC-AML and AML with RUNX1 mutations may gain an IFN-driven pDC transcriptional program, potentially contributing to the increased pDC output in these settings.
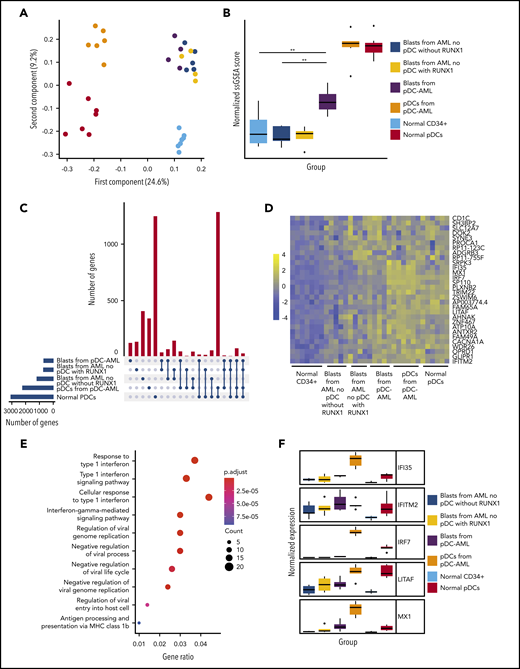
Leukemic blasts from pDC-AML upregulate a pDC transcriptional program. (A) Principal component analysis of gene expression in normal marrow CD34+ cells, normal pDCs, pDCs from pDC-AML, blasts from pDC-AML, blasts from AML without RUNX1 mutations or pDC expansion, and blasts from AML with RUNX1 mutations but no pDC expansion. (B) pDC transcriptional program, as evaluated by normalized single sample GSEA scores for each group. Scores are calculated based on expression levels of pDC genes. (C) Upset plot displaying overlap of upregulated genes among blasts from pDC-AML, blasts from AML without RUNX1 mutations or pDC expansion, and blasts from AML with RUNX1 mutations but no pDC expansion, pDCs from pDC-AML, and normal pDCs. All groups are compared with normal marrow CD34+ cells. (D) Heat map showing the 30 upregulated genes shared among blasts from pDC-AML, blasts from AML with RUNX1 mutations but no pDC expansion, and normal pDCs but not with blasts from AML without RUNX1 mutations or pDC expansion. (E) Gene ontology analysis showing upregulated pathways in blasts from pDC-AML compared with normal marrow CD34+ cells. (F) Expression levels of a subset of IFN-related genes upregulated in pDC-AML. These genes are also among the subset of genes depicted in panel D. **P < .01.
Leukemic blasts from pDC-AML upregulate a pDC transcriptional program. (A) Principal component analysis of gene expression in normal marrow CD34+ cells, normal pDCs, pDCs from pDC-AML, blasts from pDC-AML, blasts from AML without RUNX1 mutations or pDC expansion, and blasts from AML with RUNX1 mutations but no pDC expansion. (B) pDC transcriptional program, as evaluated by normalized single sample GSEA scores for each group. Scores are calculated based on expression levels of pDC genes. (C) Upset plot displaying overlap of upregulated genes among blasts from pDC-AML, blasts from AML without RUNX1 mutations or pDC expansion, and blasts from AML with RUNX1 mutations but no pDC expansion, pDCs from pDC-AML, and normal pDCs. All groups are compared with normal marrow CD34+ cells. (D) Heat map showing the 30 upregulated genes shared among blasts from pDC-AML, blasts from AML with RUNX1 mutations but no pDC expansion, and normal pDCs but not with blasts from AML without RUNX1 mutations or pDC expansion. (E) Gene ontology analysis showing upregulated pathways in blasts from pDC-AML compared with normal marrow CD34+ cells. (F) Expression levels of a subset of IFN-related genes upregulated in pDC-AML. These genes are also among the subset of genes depicted in panel D. **P < .01.
Anti-CD123–targeted therapy reduces pDCs and leukemic blasts in vivo
Tagraxofusp, a fusion protein consisting of interleukin-3 fused to a truncated diphtheria toxin payload with high affinity and avidity for the interleukin-3 receptor-α (CD123), has shown substantive therapeutic efficacy in BPDCN and, therefore, is approved by the US Food and Drug Administration for its treatment.50,51 Because pDCs are increased in patients with pDC-AML, and the leukemic blasts also expressed higher levels of CD123 compared with AML with no pDC expansion (median of MFI, 1773 vs 1008; P = .0003) (Figure 1D), we hypothesized that CD123-targeted therapy may have efficacy in pDC-AML. To evaluate tagraxofusp in pDC-AML, unsorted BM cells harvested from primary PDX NSG mice (supplemental Figure 4; supplemental Table 6) were propagated into secondary NSG recipients. After 8 weeks, mice were randomized based on comparable engraftment of human (h)CD45 cells (mean value of hCD45+ cells: 8.4% in phosphate-buffered saline (PBS) cohort, 9.2% in tagraxofusp 0.1 mg/kg per day cohort, and 10.0% in tagraxofusp 0.2 mg/kg per day cohort, supplemental Figure 6A). After 1 cycle of intraperitoneal injection of tagraxofusp (5 days), the cohorts taking 0.1 mg/kg per day or 0.2 mg/kg per day showed >50% reduction in hCD45+ cells (mean: PBS, 62.5%; tagraxofusp 0.1 mg/kg per day, 33.1%; tagraxofusp 0.2 mg/kg per day, 26.8%; P < .001 PBS vs 0.1 mg/kg per day, P < .001 PBS vs 0.2 mg/kg per day) (Figure 6A). Although the proportion of CD34+ blasts in the hCD45+ population was not significantly affected by the treatment (Figure 6B,D-F), the leukemic burden overall (as evaluated by the proportion of CD34+ blasts in total white blood cells) was twofold to threefold lower in tagraxofusp-treated mice (mean: PBS, 30.7%; tagraxofusp 0.1 mg/kg per day, 14.7%; tagraxofusp 0.2 mg/kg per day, 11.7%; P < .0017 PBS vs 0.1 mg/kg per day, P < .0015 PBS vs 0.2 mg/kg per day) (Figure 6C). Consistent with the high efficacy of tagraxofusp in BPDCN, pDCs were almost completely eliminated by tagraxofusp in the cohorts taking 0.1 mg/kg per day or 0.2 mg/kg per day (mean: PBS, 4.8%; 0.1 mg/kg per day, 1.3%; 0.2 mg/kg per day, 1.4%; P < .0001 PBS vs 0.1 mg/kg per day or PBS vs 0.2 mg/kg per day) (Figure 6B, D-G; supplemental Figure 6B). More importantly, there was a significant reduction in leukemic burden in BM with tagraxofusp treatment (total BM cellularity: 17 million cells in PBS vs 2.9 million cells in tagraxofusp 0.1 mg/kg per day; P < .001; Figure 6G). We did not observe a significant difference in overall survival, this is likely attributed to treatment-associated toxicities that limit the duration of therapy in NSG mice (data not shown). Therefore, tagraxofusp is able to effectively eliminate neoplastic pDCs and reduce leukemic burden in an in vivo model of pDC-AML.
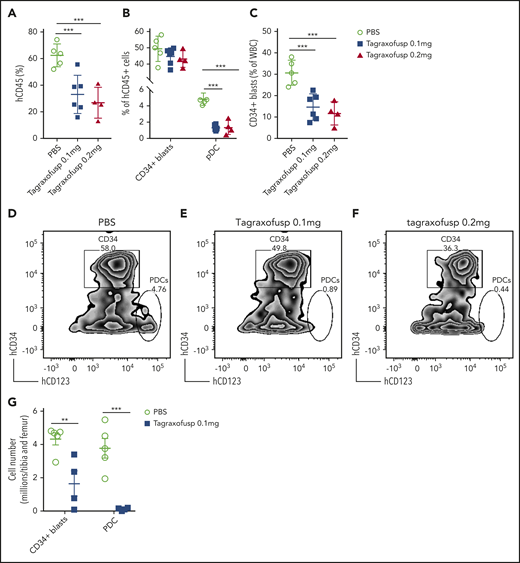
Tagraxofusp treatment results in significant reduction of leukemic blasts and pDCs in vivo. (A-C) BM cells harvested from primary NSG mice were injected IV into secondary NSG mice. The mice were treated by intraperitoneal injection for 1 cycle with PBS, tagraxofusp 0.1 mg/kg per day, or 0.2 mg/kg per day. (A) One week after the last dose, hCD45+ cells were examined in peripheral blood. (B) Leukemic blasts and pDC proportions are shown in hCD45+ compartments. (C) CD34+ leukemic blast proportions in total white blood cells (WBC) were also evaluated. Data are mean ± SD. (D-F) Representative flow plots show leukemic blasts and pDCs after treatment with PBS (D), tagraxofusp 0.1 mg/kg per day (E), or tagraxofusp 0.2 mg/kg per day (F). (G) BM cells were harvested from mice treated with PBS or tagraxofusp 0.1 mg/kg per day. CD34+ leukemic blasts and pDCs were enumerated. **P < .01, ***P < .001.
Tagraxofusp treatment results in significant reduction of leukemic blasts and pDCs in vivo. (A-C) BM cells harvested from primary NSG mice were injected IV into secondary NSG mice. The mice were treated by intraperitoneal injection for 1 cycle with PBS, tagraxofusp 0.1 mg/kg per day, or 0.2 mg/kg per day. (A) One week after the last dose, hCD45+ cells were examined in peripheral blood. (B) Leukemic blasts and pDC proportions are shown in hCD45+ compartments. (C) CD34+ leukemic blast proportions in total white blood cells (WBC) were also evaluated. Data are mean ± SD. (D-F) Representative flow plots show leukemic blasts and pDCs after treatment with PBS (D), tagraxofusp 0.1 mg/kg per day (E), or tagraxofusp 0.2 mg/kg per day (F). (G) BM cells were harvested from mice treated with PBS or tagraxofusp 0.1 mg/kg per day. CD34+ leukemic blasts and pDCs were enumerated. **P < .01, ***P < .001.
Discussion
Our studies show that a subset of patients with AML, most commonly with RUNX1 mutations, have pDC expansion in vivo, pDC differentiation capacity in vitro, and a distinct transcriptional program, suggesting that this represents an AML subtype with distinct genetic, transcriptional, and biologic features. Moreover, our studies suggest that CD123 targeting may have therapeutic importance in AML with pDC expansion, alone or in combination with other antileukemic therapies.52,53
The presence of pDCs in patients with AML raises important diagnostic challenges. Very few patients in our cohort had a history of CMML, and the mutational profiles are largely different from that of CMML with or without pDC expansion,26,54 arguing against a progression from CMML in the majority of patients. On the other hand, a minority of patients had >20% pDCs in the marrow with immature pDC morphology, raising the differential diagnosis of BPDCN. However, they all had RUNX1 mutations, and their pDCs expressed CD34, but not CD56, which is distinct from BPDCN. There are several lines of evidence supporting pDC-AML as an entity distinct from BPDCN.55 First, skin presentation is relatively infrequent (only 14%) in pDC-AML but is typical (70-100%) in BPDCN.42 Second, myeloid blasts are >20% in all patients with pDC-AML. Third, RUNX1 mutations are present in >70% of pDC-AML but are rare (<5%) in BPDCN.56,57 Fourth, pDCs from pDC-AML alone are not leukemogenic, in contrast to studies showing that pDCs from BPDCN can maintain/propagate the diseases.53 These data suggest that pDC-AML is a distinct entity from BPDCN or CMML with pDC expansion and that important shared features can confound diagnostic evaluation and may inform shared insights into disease pathogenesis and therapy. Although the immunophenotype of CD4, CD123, and CD56 coexpression is used to define neoplastic pDCs, it is of paramount importance to note that this immunophenotype is also commonly seen in myeloid blasts with monocytic differentiation, but in the setting of ≥1-log lower expression level of CD123 than pDCs. In this regard, the reports of BPDCN-like AML with NPM-1 mutation (which is exceedingly rare in pDC-AML and BPDCN) may merely represent AML with monocytic differentiation,58 although rare cases of pDC-AML or BPDCN cannot be entirely ruled out based on the reports.
Despite the recognition of BPDCN as a distinct entity,30,42 the role of pDCs in myeloid transformation remains poorly understood. A recent study demonstrated that CMML patients with pDC expansion have a higher transformation risk to AML and that pDCs share genetic mutations with the CMML clone.26 However, the role of pDCs in leukemic transformation and maintenance, as well as in the interaction with malignant cells in different cancer contexts, has not been extensively studied. Our studies suggest that pDCs in AML are derived from the leukemic clone and that there may be interactions between leukemic cells and pDC progeny. Studies have shown that direct contact with E-cadherin and PD-L1–expressing myeloma cells could convert pDCs into tumor-promoting cells by suppressing pDC IFN-α production.59,60 pDCs can also induce regulatory T cells,61 thereby inhibiting the antitumor response mediated by other effector T cells.62-64 Moreover, leukemia-derived pDCs may have aberrant functionalities, including with respect to cytokine signaling and secretion, despite the largely preserved type I IFN program that we and other investigators have observed.26 Second, pDCs may be a surrogate marker for disease aggressiveness. Because pDCs are markedly depleted in the majority of cases of AML and other high-grade myeloid neoplasms,25,65 increased pDC differentiation may implicate an early hematopoietic stem cell or multipotent progenitor as the cell of origin of the myeloid neoplasms, which may correlate with poor outcome.66,67 Consistent with this hypothesis, crosslineage marker expression is much more common in pDC-AML than in AML as a whole. Alternatively, pDC differentiation may be indicative of the presence of adverse risk somatic alterations, such as RUNX1 mutations, which may or may not relate to the cell of origin or the differentiation stage of leukemic blasts.
Our data indicate that leukemic blasts from pDC-AML upregulate an IFN-driven pDC transcriptional program, potentially contributing to the increased pDC output. The enrichment of RUNX1 mutations in pDC-AML implies a crucial role for this genetic event and downstream altered gene regulatory networks in pDC differentiation. Prior studies have shown that pDC-related transcription factors are highly expressed in RUNX1-mutated AML,68-70 which is further supported by our data. Our study also provides direct evidence that the leukemic blasts from RUNX1-mutated AML are primed to differentiate into pDCs. VAV-iCre–inducible Runx1–deficient mice have markedly decreased Flt3+ lymphoid progenitors, including the entire dendritic cell compartment,71 consistent with the indispensable role of Runx1 in lymphoid development.72 Future elucidation of RUNX1 function in dendritic cell development requires novel mouse models that have inducible mutant RUNX1 alleles seen in pDC-AML under the control of pan-hematopoietic–specific vs DC-specific promoters. In addition, whether and how the BM microenvironment, including cytokines and infection responses, contributes to pDC differentiation/expansion remains to be studied.
Based on the clonal origin and possible proleukemic activities of pDCs in AML, we reasoned that targeting pDCs may have therapeutic benefit in pDC-AML. The proof-of-principle experiments demonstrated efficacy of tagraxofusp in eliminating pDCs, consistent with the clinical efficacy in patients with BPDCN.50 Tagraxofusp has previously shown objective responses as a single therapeutic agent in a small subset of patients with AML.73 Consistently, this agent led to a marked reduction in BM cellularity, including CD34+ blasts. Approximately half of the mice obtained complete responses with tagraxofusp monotherapy in our preclinical model of pDC-AML, suggesting that it will be important to combine CD123-targeted therapies with other antileukemic targets to increase therapeutic efficacy in this subset of AML, as is being investigated in a broader suite of tagraxofusp-refractory myeloid neoplasms52,53 (also see ClinicalTrials.gov Identifier: NCT03113643).
In summary, our study identifies a subset of AML patients with pDC expansion, a high frequency of RUNX1 mutations, unique transcriptional profile, and increased CD123 expression that may represent a therapeutic target in this high-risk AML subset. Future studies are warranted to elucidate the role of pDCs in pDC-AML initiation and maintenance and to develop effective combination therapeutic approaches for this unique AML subset with poor clinical outcome.
Presented in abstract form at the 61st annual meeting of the American Society of Hematology, San Diego, CA, 2 December 2018.
Data sharing requests should be sent to Wenbin Xiao (xiaow@mskcc.org) or Ross L. Levine (leviner@mskcc.org).
The online version of this article contains a data supplement.
The publication costs of this article were defrayed in part by page charge payment. Therefore, and solely to indicate this fact, this article is hereby marked “advertisement” in accordance with 18 USC section 1734.
Acknowledgments
This work was supported by the Center for Hematologic Malignancies at MSKCC and, in part, through National Institutes of Health/National Cancer Institute Cancer Center Support grant P30 CA008748. It was also supported by National Institutes of Health/National Cancer Institute grants R01CA173636 and R35197594 (R.L.L.), and by a Leukemia and Lymphoma Society Specialized Center of Research grant. M.S. received funding from the MSKCC Clinical Scholars T32 Program under award 2T32 CA009512-31.
Authorship
Contribution: W.X., M.R., and R.L.L. conceived the study, collected and analyzed data, and wrote the manuscript; A.C. annotated the clinical and flow data; M.R.W., R.L.B., and R.P.K. performed the RNA sequencing analysis; T.M., S.F.C., I.S.C., and N.L.D. performed PDX experiments; Y.L., J.Y., and M.E.A. collected and annotated the mutational data; A. Derkach performed statistical analyses; Q.G. helped with cell sorting; J.B., S.Y., C.A.F., and M.P. coordinated the project; M.S., R.K.R., M.S.T., and A.D.G. provided clinical data; Y.Z. reviewed cytogenetic data; A. Dogan analyzed data; and all authors approved the final version of the manuscript.
Conflict-of-interest disclosure: W.X. has received research support from Stemline Therapeutics. S.F.C. is a consultant for Imago Biosciences and has received honoraria from DAVA Oncology. A.D.G. served on advisory boards or as a consultant for AbbVie, Aptose, Celgene, Daiichi Sanyko, and Genentech; received research funding from AbbVie, ADC Therapeutics, Aprea, AROG, Daiichi Sanyko, and Pfizer; and received honoraria from Dava Oncology. R.K.R has received consulting fees from Constellation, Incyte, Celgene, Promedior, CTI, Jazz Pharmaceuticals, Blueprint, and Stemline Therapeutics and has received research funding from Incyte, Constellation, and Stemline Therapeutics. M.S.T. has received research funding from AbbVie, Cellerant, Orsenix, ADC Therapeutics, Biosight, Glycomimetics, Rafael Pharmaceuticals and Amgen; has served on advisory Boards for AbbVie, BioLineRx, Daiichi-Sankyo, Orsenix, KAHR, Rigel, Nohla, Delta Fly Pharma, Tetraphase, Oncolyze, Jazz Pharma, Roche, Biosight, and Novartis; and has received royalties from UpToDate. A. Dogan has received personal fees from Roche, Corvus Pharmaceuticals, Physicians' Education Resource, Seattle Genetics, Peerview Institute, Oncology Specialty Group, Takeda, and EUSA Pharma and research grants from Roche. R.L.L. is on the supervisory board of QIAGEN and is a scientific advisor to Loxo (until 2019), Auron, Ajax, Mission Bio, Imago, C4 Therapeutics, and Isoplexis, which each include an equity interest; received research support from and consulted for Celgene and Roche; received research support from Prelude Therapeutics; consulted for Incyte, Novartis, and Janssen; and received honoraria from Lilly and Amgen for invited lectures and from Gilead for grant reviews. The remaining authors declare no competing financial interests.
Correspondence: Wenbin Xiao, Memorial Sloan Kettering Cancer Center, 1275 York Ave, New York, NY 10065; e-mail: xiaow@mskcc.org; or Ross L. Levine, Memorial Sloan Kettering Cancer Center, 1275 York Ave, New York, NY 10065; e-mail: leviner@mskcc.org.
