

Key Points
FasL-mediated apoptosis plays an important role in Treg depletion and subpopulation imbalance in AA, leading to immune dysregulation.
Remaining AA Tregs become FasL resistant in response to high concentration of IL-2 and are functional in an inflammatory environment.

Abstract
Idiopathic aplastic anemia (AA) has 2 key characteristics: an autoimmune response against hematopoietic stem/progenitor cells and regulatory T-cells (Tregs) deficiency. We have previously demonstrated reduction in a specific subpopulation of Treg in AA, which predicts response to immunosuppression. The aims of the present study were to define mechanisms of Treg subpopulation imbalance and identify potential for therapeutic intervention. We have identified 2 mechanisms that lead to skewed Treg composition in AA: first, FasL-mediated apoptosis on ligand interaction; and, second, relative interleukin-2 (IL-2) deprivation. We have shown that IL-2 augmentation can overcome these mechanisms. Interestingly, when high concentrations of IL-2 were used for in vitro Treg expansion cultures, AA Tregs were able to expand. The expanded populations expressed a high level of p-BCL-2, which makes them resistant to apoptosis. Using a xenograft mouse model, the function and stability of expanded AA Tregs were tested. We have shown that these Tregs were able to suppress the macroscopic clinical features and tissue manifestations of T-cell–mediated graft-versus-host disease. These Tregs maintained their suppressive properties as well as their phenotype in a highly inflammatory environment. Our findings provide an insight into the mechanisms of Treg reduction in AA. We have identified novel targets with potential for therapeutic interventions. Supplementation of ex vivo expansion cultures of Tregs with high concentrations of IL-2 or delivery of IL-2 directly to patients could improve clinical outcomes in addition to standard immunosuppressive therapy.
Introduction
Severe aplastic anemia (AA) is a rare and potentially fatal form of bone marrow (BM) failure syndrome, characterized by peripheral blood cytopenia and hypocellular BM. Most cases of acquired AA are associated with autoimmunity.1-3 In AA, the expansion of T-effector cells (CD4+ and CD8+ T cells), along with the increased levels of proinflammatory cytokines such as interferon-γ and tumor necrosis factor-α, results in the depletion of hematopoietic stem/progenitor cells (HSPCs).4,5 Immune destruction of HSPCs is also associated with Fas/FasL-dependent apoptotic pathway.6,7
Current first-line treatment options for AA patients include hematopoietic stem cell transplantation for younger patients with HLA-matched sibling donors, as well as immunosuppressive therapy (IST) for older patients and patients without a matched sibling donor.8,9 In hematopoietic stem cell transplant, acute and chronic graft-versus-host disease (GVHD) remain an issue, although occur less frequently using alemtuzumab-based conditioning.10 Standard IST regimen using antithymocyte globulin and cyclosporine A has shown a response rate of 60% to 70% in AA patients. Nevertheless, 35% of patients relapse after responding, and up to 15% of patients undergo clonal evolution to myelodysplastic syndrome and acute myeloid leukemia following IST.3,8,9,11-13 More recently, the addition of thrombopoietin receptor agonist (Eltrombopag) to the standard IST has shown a high rate of complete response among patients with severe AA, but the relapse rate and clonal evolution were comparable to standard IST therapy.14
Regulatory T cells (Tregs) are an integral part of a balance immune response in human,15 and the insufficient number or function of Tregs is the major finding in most autoimmune conditions.16 Our group and others have previously demonstrated that in AA, the number of Tregs are reduced and their function is compromised.4,17-19 We have described 2 subpopulations of human Tregs with distinct immunological phenotypes, known as Treg-A (naive phenotype with low proliferation index) and Treg-B (memory phenotype with moderate/high proliferation index), and shown that the reduced number of Treg-B correlates with inferior response to IST.20
In the present study, we investigated the mechanisms behind the Treg reduction in AA and potential interventions that could overcome this mechanism. We found that Treg-A from AA patients were resistant to FasL-induced apoptosis and do not respond to low concentration of interleukin-2 (IL-2). However, Treg-A and Treg-B isolated from AA patients were able to expand in vitro, and these expanded Tregs were not only functional and stable, but also expressed a high level of p-BCL-2 and were resistant to FasL-induced apoptosis. These findings represent potential targets to overcome AA immune dysregulation in a more targeted way and improve clinical outcome in addition to standard IST.
Methods
Study approval
King's College Hospital Local Research Ethics Committee approved this study for sample collection, and informed written consent was obtained from patients.
Patient samples
A total of 19 AA patients were involved in this study (Table 1). Peripheral blood mononuclear cells (PBMCs) from 19 AA patient samples collected at diagnosis and after IST (5 patients) and 25 healthy donors (HDs) were used for various in vitro functional assays and in vivo experiments.
Patients’ characteristics at diagnosis
| Characteristics | Value |
|---|---|
| Number of patients | 19 |
| Sex | |
| Male | 11 |
| Female | 8 |
| Disease severity at diagnosis | |
| VSAA | 5 |
| SAA | 8 |
| NSAA | 6 |
| PNH clone | |
| Yes | 11 |
| No | 7 |
| Unknown | 1 |
| Size of PNH clone, % | |
| Red cells | 0.02 to 0.15 |
| Granulocytes | 0.003 to 29.3 |
| Monocytes | 0.4 to 25.7 |
| Etiology | |
| Idiopathic | 19 |
| Treatment | |
| IST | 12 |
| Eltrombopag | 2 |
| IST + Eltrombopag | 1 |
| Allogeneic stem cell transplantation | 1 |
| No treatment | 3 |
| Response to IST treatment | |
| CR | 2 |
| PR | 6 |
| NR | 4 |
CR, complete response; NR, no response; NSAA, nonsevere aplastic anemia; PNH, paroxysmal nocturnal hemoglobinuria; PR, partial response; SAA, severe aplastic anemia; VSAA, very severe aplastic anemia.
In vitro Treg expansion
Treg expansion in vitro was performed as previously described.20,21 Total Tregs, Treg-A, and Treg-B were cultured in Prime XV T cell expansion XSFM (Irvine Scientific, Santa Ana, CA), supplemented with 5% human AB serum (Sigma Aldrich, St. Louis, MO) in the presence of 2 μM all-trans-retinoic acid (ATRA; Sigma Aldrich) and 100 nM rapamycin (LC Laboratories, Woburn, MA) for 4 to 6 weeks. Tregs were stimulated with Dynabeads human T-activator CD3/CD28 (cell:bead ratio = 1:1; Thermo Fisher Scientific, Waltham, MA) and 1000 IU/mL of human IL-2 (Proleukin; Novartis, Basel, Switzerland). The culture was replenished every 2 days with human IL-2 and every week with fresh culture media and Dynabeads human T-activator CD3/CD28.
Suppression assay
Suppression assay was performed as previously described.20 Conventional T cells (Tcon cells) were stained with a fluorescent proliferation dye, carboxyfluorescein diacetate succinimidyl ester (CFSE; BioLegend, San Diego, CA) and cocultured with autologous Tregs at different Tcon:Treg ratios (8:1, 4:1, 2:1, and 1:1) for 5 days in the presence of anti-CD3/CD28 beads (Tcon:beads ratio = 20:1). Cells were harvested after 5 days and stained with Fixable Viability Dye eFluor 780 (Thermo Fisher Scientific), anti-human CD3 VioGreen (clone BW264/56; Miltenyi Biotec, Bergish Gladbach, Germany), and anti-human CD4 PerCp Cy5.5 (clone RPA-T4; BioLegend). Stained cells were analyzed on a BD FACSCanto II (BD Biosciences, San Jose, CA). FlowJo Version 7.6.5 software (Tree Star, Ashland, OR) was used to perform data analysis.
FasL-induced apoptosis assay
Treg-A and Treg-B were stimulated with 5 μg/mL of anti-Fas (clone CH11; Millipore, Burlington, MA) for 5 hours and stained with Fixable Viability Dye eFluor 780 (Thermo Fisher Scientific) followed by Annexin V APC (BioLegend) in binding buffer (BioLegend). Stained cells were analyzed on a BD LSR Fortessa (BD Biosciences). Percentages of early (Viability Dye eFluor 780− Annexin V+) and late (Viability Dye eFluor 780+ Annexin V+) apoptotic cells were calculated. For rescue experiment, Treg-A and Treg-B were treated with 5 μg/mL of anti-Fas (clone CH11; Millipore) and 20 IU/mL of human IL-2 (Proleukin; Novartis).
Treg sensitivity to IL-2
Treg-A and Treg-B were treated with 1, 40, 60, or 80 IU/mL of human IL-2 (Proleukin; Novartis) for 15 or 30 minutes. Protein expression level of pSTAT5, a marker for IL-2 response, was measured using western blot.
DNA methylation analysis by deep amplicon bisulfite sequencing
FoxP3 Treg-specific demethylation region (TSDR) methylation analysis using deep amplicon bisulfite sequencing was performed as previously described.20,22 Details of the method and data analysis are included in supplemental methods, available on the Blood Web site.
RNA sequencing
Total RNA was extracted using RNeasy Mini Kit (Qiagen, Hilden, Germany) and sent to Genewiz for RNA sequencing. Details of the data analysis are included in supplemental methods.
Xenotransplantation
NOD/SCID/IL2rγ−/−/IL-3/GMCSF/SCF (NSG-SGM3) mice were obtained from Leonard Shultz (The Jackson Laboratory) and bred at the Francis Crick Institute biological resources facility. All animal experiments were performed in accordance with UK Home Office and Francis Crick guidelines. PBMCs and Tregs were either coinjected or injected alone into the recipient mice via the IV route. PBMCs and Tregs from HDs were coinjected in 1:1 ratio (10 × 106 cells). Due to the limited number of cells available from AA patients, the number of PBMCs injected into recipient mice ranged from 1.75 × 10⁶ to 4.5 × 10⁶, and equal numbers of Tregs were coinjected together. Mice were euthanized either when animals lost 20% of body weight or at week 12. Then, mouse tissues were recovered and analyzed (see supplemental methods for more details).
Multiparameter mass cytometry (CyTOF)
Cytometry by time of flight (CyTOF) was performed as previously described.20 Details of the method and data analysis are included in supplemental methods.
Statistical analysis
Statistical analysis was performed using Prism Version 7 software (GraphPad Software, La Jolla, CA). Statistical significance was calculated by P value using unpaired Student t test. A P value < .05 was considered statistically significant.
Results
Treg-B are sensitive to FasL-induced apoptosis
Treg-B are characterized by high expression of CD95 (Fas); therefore, we hypothesized that these Tregs are more sensitive to FasL and will undergo increased apoptosis following FasL exposure compared with Treg-A. To investigate this, we first performed RNA sequencing on Treg-A and Treg-B isolated from both HD and AA patients to explore whether Treg-B show activation of FasL-mediated apoptosis pathway. By comparing gene expression profiles of AA Treg-B to HD Treg-B using ingenuity pathway analysis (IPA), the top significant upregulated pathway in AA Treg-B was apoptosis-related pathways (−log P value = 4.69; z score = 1.414) (Figure 1A; supplemental Figure 1; supplemental Table 1). In addition, one of the markedly upregulated pathways in AA Treg-B compared with AA Treg-A was death receptor signaling (−log P value = 6.67; z score = 2.646), which includes apoptosis-inducing genes and therefore suggests previous exposure of AA Treg-B to proapoptotic ligands (Figure 1B-C; supplemental Figure 2; supplemental Table 2). Expression of homing receptors, including CCR4, CCR5, CCR6, and CXCR6, were also significantly increased in AA Treg-B as compared with AA Treg-A (Figure 1C). Notably, expression of Fas was significantly increased in 3 out of top 10 upregulated pathways in AA Treg-B (Figure 1B). Therefore, we next assessed whether Treg-B cells are more susceptible to FasL-mediated apoptosis in vitro. We found that both early and late apoptotic rates were markedly increased in Treg-A (P value = .0042) and Treg-B (P value = .0001) (Figure 1D; supplemental Figure 3). However, there was a significantly higher percentage of apoptotic cells in Treg-B compared with Treg-A (P value = .0041), therefore confirming that Treg-B are more sensitive to FasL-induced apoptosis than Treg-A. Interestingly, Treg-B from AA patients remain sensitive to FasL even after response to IST (supplemental Figure 4).

Treg-B are sensitive to FasL-induced apoptosis. (A) IPA comparing Treg-B isolated from AA patients (n = 3) to Treg-B isolated from HD (n = 2) shows the ranking of top 10 significant upregulated canonical pathways by −log (P value). Red indicates positive z score; gray indicates zero z score, and blue indicates negative z score. (B) IPA analysis on the RNA sequencing data shows the ranking of top 10 canonical pathways by −log (P value) in AA Treg-B (n = 3) compared with AA Treg-A (n = 3). Significant upregulation of Fas in 3 out of 10 pathways is indicated. (C) Volcano plot shows the significant differential expressed genes in death receptor signaling (red) and the upregulation of homing receptors (yellow) in Treg-B isolated from AA patients (n = 3) as compared with Treg-A (n = 3). (D) The percentage of early (Viability Dye eFluor 780− Annexin V+) and late (Viability Dye eFluor 780+ Annexin V+) apoptotic cells in Treg-A and Treg-B before and after treatment with 5 μg/mL of anti-Fas. Error bars represent mean ± standard deviation (SD). **P ≤ .01, ***P ≤ .001. IRF, interferon regulatory factor.
Treg-B are sensitive to FasL-induced apoptosis. (A) IPA comparing Treg-B isolated from AA patients (n = 3) to Treg-B isolated from HD (n = 2) shows the ranking of top 10 significant upregulated canonical pathways by −log (P value). Red indicates positive z score; gray indicates zero z score, and blue indicates negative z score. (B) IPA analysis on the RNA sequencing data shows the ranking of top 10 canonical pathways by −log (P value) in AA Treg-B (n = 3) compared with AA Treg-A (n = 3). Significant upregulation of Fas in 3 out of 10 pathways is indicated. (C) Volcano plot shows the significant differential expressed genes in death receptor signaling (red) and the upregulation of homing receptors (yellow) in Treg-B isolated from AA patients (n = 3) as compared with Treg-A (n = 3). (D) The percentage of early (Viability Dye eFluor 780− Annexin V+) and late (Viability Dye eFluor 780+ Annexin V+) apoptotic cells in Treg-A and Treg-B before and after treatment with 5 μg/mL of anti-Fas. Error bars represent mean ± standard deviation (SD). **P ≤ .01, ***P ≤ .001. IRF, interferon regulatory factor.
IL-2 responsiveness and in vitro expandability of Treg-A and Treg-B
Although FasL sensitivity explains Treg-B reduction in AA, it is not clear why Treg-A, which are more resistant to FasL, cannot expand. To address this, we tested the “IL-2 responsiveness” of Treg-A in vitro. When Treg-A and Treg-B were treated with a low concentration of IL-2 (1 IU/mL) for 15 and 30 minutes, lower pSTAT5 protein expression was observed in Treg-A compared with Treg-B (Figure 2A). However, when IL-2 concentration was increased to 40, 60, and 80 IU/mL, protein expression of pSTAT5 in Treg-A increased and was comparable to Treg-B after 30 minutes of IL-2 exposure (Figure 2B). These data suggest that Treg-A do not respond to low concentration of IL-2 but respond to higher concentration of IL-2.

IL-2 responsiveness and in vitro expandability of Treg-A and Treg-B. (A-B) Western blot analysis of STAT5 and pSTAT5 protein expression in Treg-A and Treg-B after treatment with 1, 40, 60, or 80 IU/mL of human IL-2 for 15 or 30 minutes. β-ACTIN protein level is used as a loading control, and numbers represent the densitometric quantification of STAT5 and pSTAT5 protein expression levels normalized to β-ACTIN. (C) The expansion rate of Treg-A and Treg-B from HD (n = 6) and AA patients (n = 3). Treg-A and Treg-B were stimulated with anti-CD3/CD28 beads (1 cell:1 bead ratio) and 1000 IU/mL IL-2 for 4 weeks with 2 μM ATRA and 100 nM rapamycin in Prime XV T-cell expansion XSFM medium. Error bars represent mean ± SD. *P ≤ .05; ns, not significant. (D) GSEA enrichment plot shows the significant enrichment of gene set for cell proliferation in AA-expanded Treg-A compared with Treg-A before expansion. However, gene set of cell proliferation was not enriched in expanded HD Treg-A as compared with preexpansion Treg-A. This finding suggests the higher “expansion potential” of AA Treg-A compared with HD Treg-A. ES, enrichment score; NES, normalized enrichment score. (E) PCA analysis on transcriptional profiles in AA Treg-A as well as Treg-B before and after expansion. (F) Chart shows the median expression of 29 markers measured by CyTOF analysis in HD-expanded Treg-A (n = 3) and Treg-B (n = 3). Error bars represent mean ± SD. (G) Heat map shows the median expression of Treg-B–specific markers (CD45RA, CD45RO, CD95, and CCR4) in HD Treg-A (n = 3) and Treg-B (n = 3) before and after expansion.
IL-2 responsiveness and in vitro expandability of Treg-A and Treg-B. (A-B) Western blot analysis of STAT5 and pSTAT5 protein expression in Treg-A and Treg-B after treatment with 1, 40, 60, or 80 IU/mL of human IL-2 for 15 or 30 minutes. β-ACTIN protein level is used as a loading control, and numbers represent the densitometric quantification of STAT5 and pSTAT5 protein expression levels normalized to β-ACTIN. (C) The expansion rate of Treg-A and Treg-B from HD (n = 6) and AA patients (n = 3). Treg-A and Treg-B were stimulated with anti-CD3/CD28 beads (1 cell:1 bead ratio) and 1000 IU/mL IL-2 for 4 weeks with 2 μM ATRA and 100 nM rapamycin in Prime XV T-cell expansion XSFM medium. Error bars represent mean ± SD. *P ≤ .05; ns, not significant. (D) GSEA enrichment plot shows the significant enrichment of gene set for cell proliferation in AA-expanded Treg-A compared with Treg-A before expansion. However, gene set of cell proliferation was not enriched in expanded HD Treg-A as compared with preexpansion Treg-A. This finding suggests the higher “expansion potential” of AA Treg-A compared with HD Treg-A. ES, enrichment score; NES, normalized enrichment score. (E) PCA analysis on transcriptional profiles in AA Treg-A as well as Treg-B before and after expansion. (F) Chart shows the median expression of 29 markers measured by CyTOF analysis in HD-expanded Treg-A (n = 3) and Treg-B (n = 3). Error bars represent mean ± SD. (G) Heat map shows the median expression of Treg-B–specific markers (CD45RA, CD45RO, CD95, and CCR4) in HD Treg-A (n = 3) and Treg-B (n = 3) before and after expansion.
When we tested the in vitro expandability of Tregs in a Treg-promoting culture condition21 with high concentration of IL-2, both Treg-A and Treg-B isolated from HD and AA patients were able to expand up to 4 weeks. Expansion rates of Treg-A and Treg-B from HD were comparable (P value = .6429) where Treg-A was expanded with an average of 45-fold increase (range, 10.47 to 113.27), whereas Treg-B increased by 33-fold (range, 4.56 to 129.03) (Figure 2C). Surprisingly, for AA patients, Treg-A expanded at a significantly higher rate compared with Treg-B (P value = .0198), with an average increase of 4708-fold (range, 3388.7 to 6027.4) compared with 185-fold increase (range, 32.39 to 374) (Figure 2C). Interestingly, gene set enrichment analysis (GSEA) showed that expanded AA Treg-A were significantly enriched (false discovery rate [FDR] q value = 0.0377) for cell proliferation–related genes as compared with preexpansion Treg-A (Figure 2D), which was not the case for HD Treg-A.
The next question was to understand how the in vitro expansion changes the Treg subpopulations. We performed principal component analysis (PCA) on RNA sequencing data to study differences of transcriptional profiles of Tregs before and after in vitro expansion. PCA analysis showed that prior to expansion, Treg-A and Treg-B isolated from AA patients had distinct gene expression signatures with 127 significantly differential expressed genes (FDR q value < 0.05) between them (Figure 2E; supplemental Table 3). Nevertheless, following in vitro expansion, although there were genes differentially expressed between the 2 groups, the differences were not statistically significant (Figure 2E; supplemental Table 4), suggesting that expanded Treg-A and Treg-B showed similar transcriptional profile. Using mass cytometry, we next investigated the expression of commonly expressed markers following in vitro expansion. Both Treg-A and Treg-B had similar expression of immune signatures where there were no significant differential markers observed between the two (Figure 2F). Interestingly, both expanded Treg-A and Treg-B were characterized by low expression of CD45RA, but high expression of CD45RO, CD95, and CCR4 (Figure 2G; supplemental Figure 5; supplemental Figure 6A), therefore demonstrating that they take on the immune phenotype of Treg-B.20 Similarly, expanded total Tregs isolated from HD and AA patients showed Treg-B phenotype (supplemental Figure 6).
Stability, phenotypic plasticity, and functionality of in vitro expanded Treg-A and Treg-B
To investigate the stability of in vitro expanded Tregs, we examined the methylation status of 15 cytosine guanine dinucleotide sites within the FoxP3 TSDR.22 TSDR cytosine guanine dinucleotide sites in the expanded Treg-A and Treg-B from both HD as well as AA patients were highly unmethylated compared with the non-Treg (CD4+CD25loCD127hi) population (Figure 3A-B). Average methylation percentages were 7.9% for HD-expanded Treg-A, 3.6% for HD-expanded Treg-B, 7.4% for AA-expanded Treg-A, and 12.6% for AA-expanded Treg-B, compared with 89.1% for the non-Treg population (Figure 3B), suggesting that expanded Tregs have stable FoxP3 expression.

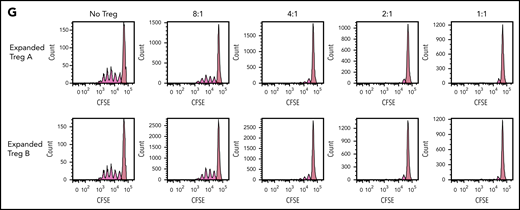
Stability, plasticity, and functionality of in vitro expanded Treg-A and Treg-B. (A) Representative methylation status of TSDR in HD-expanded Treg-A, HD-expanded Treg-B, AA-expanded Treg-A, and AA-expanded Treg-B compared with non-Treg. (B) Bar chart shows the percentage of methylation in HD-expanded Treg-A (n = 2), HD-expanded Treg-B (n = 2), AA-expanded Treg-A (n = 3), AA-expanded Treg-B (n = 3), and non-Treg (n = 2). (C) Representative plots show the percentage of IL-17A+ population in expanded Treg-A and Treg-B cultured with anti-CD3/CD28 beads (Treg:bead ratio = 6.25:1), 10 ng/mL IL-1b, 25 ng/mL IL-6, and 10 IU/mL IL-2 for 5 days and stimulated with Leukocyte Activation Cocktail, with BD GolgiPlug. The x-axis indicates log fluorescence intensity of IL-17A APC. Th17, T-helper 17 cell. (D) Chart shows the mean fluorescence intensity (MFI) quantification of IL-17A staining. Error bars represent mean ± SD. *P ≤ .05. (E) The percentage of proliferation of CFSE-stained Tcon cells when cocultured with autologous HD and AA-expanded total Tregs in 8:1, 4:1, 2:1, and 1:1 Tcon:Treg ratios for 5 days in the presence of anti-CD3/CD28 beads (Treg:beads = 20:1). (F) The proliferation index of CFSE-stained Tcon cells when cocultured with autologous AA-expanded Treg-A or Treg-B in 8:1, 4:1, 2:1, and 1:1 Tcon:, Treg ratios for 5 days in the presence of anti-CD3/CD28 beads (Treg:, beads = 20:1). Error bars represent mean ± SD. **P ≤ .01; ***P ≤ .001. (G) Representative proliferation plots of CFSE-stained Tcon cells when cocultured with autologous AA-expanded Treg-A and Treg-B in different Tcon:Treg ratios (8:1, 4:1, 2:1, and 1:1).
Stability, plasticity, and functionality of in vitro expanded Treg-A and Treg-B. (A) Representative methylation status of TSDR in HD-expanded Treg-A, HD-expanded Treg-B, AA-expanded Treg-A, and AA-expanded Treg-B compared with non-Treg. (B) Bar chart shows the percentage of methylation in HD-expanded Treg-A (n = 2), HD-expanded Treg-B (n = 2), AA-expanded Treg-A (n = 3), AA-expanded Treg-B (n = 3), and non-Treg (n = 2). (C) Representative plots show the percentage of IL-17A+ population in expanded Treg-A and Treg-B cultured with anti-CD3/CD28 beads (Treg:bead ratio = 6.25:1), 10 ng/mL IL-1b, 25 ng/mL IL-6, and 10 IU/mL IL-2 for 5 days and stimulated with Leukocyte Activation Cocktail, with BD GolgiPlug. The x-axis indicates log fluorescence intensity of IL-17A APC. Th17, T-helper 17 cell. (D) Chart shows the mean fluorescence intensity (MFI) quantification of IL-17A staining. Error bars represent mean ± SD. *P ≤ .05. (E) The percentage of proliferation of CFSE-stained Tcon cells when cocultured with autologous HD and AA-expanded total Tregs in 8:1, 4:1, 2:1, and 1:1 Tcon:Treg ratios for 5 days in the presence of anti-CD3/CD28 beads (Treg:beads = 20:1). (F) The proliferation index of CFSE-stained Tcon cells when cocultured with autologous AA-expanded Treg-A or Treg-B in 8:1, 4:1, 2:1, and 1:1 Tcon:, Treg ratios for 5 days in the presence of anti-CD3/CD28 beads (Treg:, beads = 20:1). Error bars represent mean ± SD. **P ≤ .01; ***P ≤ .001. (G) Representative proliferation plots of CFSE-stained Tcon cells when cocultured with autologous AA-expanded Treg-A and Treg-B in different Tcon:Treg ratios (8:1, 4:1, 2:1, and 1:1).
Treg possess some degree of plasticity in which they are able to adapt their phenotypes and functions to changes in the environment and extracellular signals.23-27 Hence, we studied the plasticity of expanded Tregs by culturing them in the presence of IL-1β and IL-6 that promote the secretion of IL-17A.28,29 There were no or negligible increase in IL-17A expression in the expanded Treg-A (P value = .6624) and -B (P value = .5528) as compared with positive control (CD4+CD25+ cells) where a significant increase in IL-17A level (P value = .0346) was observed (Figure 3C-D), suggesting that expanded Tregs have a stable phenotype.
To assess the functionality of expanded Tregs, fluorescent proliferation dye (CFSE)-stained Tcon were cocultured with autologous expanded Tregs. Both HD and AA-expanded total Tregs were able to suppress the proliferation of Tcon cells significantly at Tcon:Treg ratios of 8:1, 4:1, 2:1, and 1:1, with no significant difference in the suppressive activity between HD and AA (Figure 3E). Similarly, both expanded Treg-A and Treg-B from AA patients were able to suppress the proliferation of Tcon cells significantly, and the suppressive activity was comparable between Treg-A and Treg-B (Figure 3F-G).
High-dose IL-2 induces survival of Treg-A and Treg-B by upregulating phosphorylated BCL-2
To study the mechanisms that lead to the survival of Tregs following in vitro expansion, we performed RNA sequencing to compare Tregs before and after expansion. IPA analysis showed that IL-2 signaling was significantly upregulated in expanded AA Treg-B in comparison with preexpansion AA Treg-B (supplemental Figure 7). Thus, we next investigated whether IL-2 was able to rescue FasL-induced apoptosis by adding IL-2 to FasL-treated Tregs. In Treg-B, FasL-induced early and late apoptosis were rescued (P value = .0022), whereas the FasL-mediated apoptosis of Treg-A remained low in the presence or absence of IL-2 (Figure 4A; supplemental Figure 8A). Interestingly, GSEA analysis showed that expanded Treg-A were significantly enriched (FDR q value = 0.0317) for genes associated with negative regulation of extrinsic apoptotic signaling pathway compared with Treg-A before expansion (Figure 4B). Intriguingly, Bcl2 was significantly upregulated in 6 out of 10 enriched biological processes in expanded AA Treg-A compared with preexpansion Treg-A (supplemental Figure 8B). Furthermore, multiplex protein assay quantifying the expression levels of various apoptotic-related proteins showed that the expression of 2 prosurvival proteins, p-BCL-2 and p-AKT, were increased in expanded Treg-A and Treg-B as compared with preexpansion total Treg (supplemental Figure 8C-D). Similarly, western blot results showed that the protein level of p-BCL-2 was significantly increased (P value < .05) in expanded Treg-A and Treg-B as compared with total Treg before expansion, with higher p-BCL-2 expression in AA-expanded Tregs when compared with HD (Figure 4C-D). Taken together, our data suggest that when Treg-A and Treg-B are exposed to a high concentration of IL-2 in in vitro expansion culture, elevated p-BCL-2 protein expression promotes their survival and therefore prevents FasL-derived cell apoptosis.
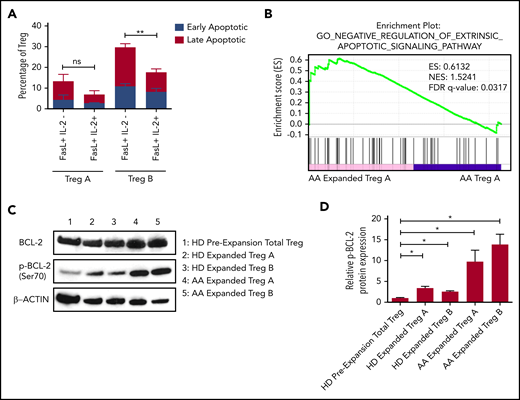
Upregulation of phosphorylated BCL-2 in in vitro expanded Treg-A and Treg-B. (A) The percentage of early (Viability Dye eFluor 780− Annexin V+) and late (Viability Dye eFluor 780+ Annexin V+) apoptotic cells in FasL-induced Treg-A and Treg-B before and after treatment with 20 IU/mL of human IL-2. Error bars represent mean ± SD. **P ≤ .01. (B) GSEA enrichment plot shows the significant enrichment of gene set for negative regulation of extrinsic apoptotic signaling pathway in AA-expanded Treg-A as compared with Treg-A before expansion. (C) Western blots show the BCL-2 and p-BCL-2 (Ser70) protein expression levels in HD and AA-expanded Treg-A and Treg-B in comparison with HD total Treg preexpansion. β-ACTIN protein level is used as a loading control. (D) Densitometric quantification of p-BCL-2 (Ser70) protein expression level normalized to β-ACTIN. Error bars represent mean ± SD. *P ≤ .05.
Upregulation of phosphorylated BCL-2 in in vitro expanded Treg-A and Treg-B. (A) The percentage of early (Viability Dye eFluor 780− Annexin V+) and late (Viability Dye eFluor 780+ Annexin V+) apoptotic cells in FasL-induced Treg-A and Treg-B before and after treatment with 20 IU/mL of human IL-2. Error bars represent mean ± SD. **P ≤ .01. (B) GSEA enrichment plot shows the significant enrichment of gene set for negative regulation of extrinsic apoptotic signaling pathway in AA-expanded Treg-A as compared with Treg-A before expansion. (C) Western blots show the BCL-2 and p-BCL-2 (Ser70) protein expression levels in HD and AA-expanded Treg-A and Treg-B in comparison with HD total Treg preexpansion. β-ACTIN protein level is used as a loading control. (D) Densitometric quantification of p-BCL-2 (Ser70) protein expression level normalized to β-ACTIN. Error bars represent mean ± SD. *P ≤ .05.
In vitro expanded Tregs are able to prevent GVHD in a xenograft mouse model
In order to evaluate the suppressive ability of the expanded Tregs in in vivo, we used our NOD/SCID/IL2rγ−/−/IL-3/GMCSF/SCF (NSG-SGM3) humanized mice (Figure 5A). The NSG-SGM3 mouse model has been previously shown to efficiently support the development and maintenance of human Tregs.30 First, to study the kinetics of human Tregs in in vivo, HD Tregs were transduced with a bicistronic vector coexpressing green fluorescent protein and luciferase, and then coinjected with or without human HD CD3+ cells in NSG-SGM3 mice (supplemental Figure 9A-C). Using whole-body bioluminescence imaging, we detected Tregs for up to 5 weeks in mice that were coinjected with CD3+ T cells (supplemental Figure 9C).
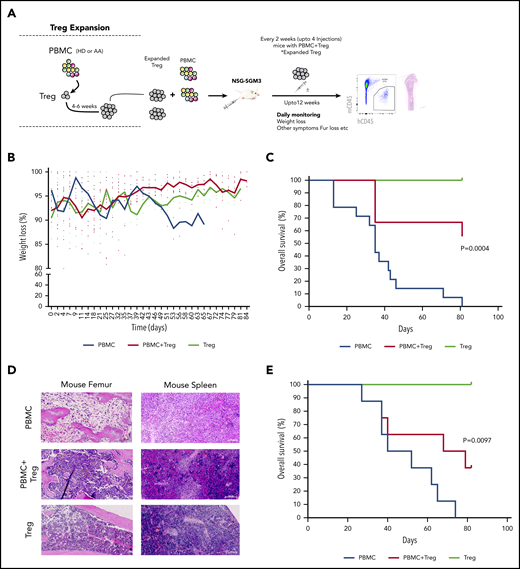
In vitro expanded Tregs suppress GVHD in NSG-SGM3 mice. (A) Schematic representation of isolation of Tregs, followed by xenotransplantation and downstream analysis. (B) Measurement of body weight loss (representing GVHD disease clinical feature) in recipient mice that were injected with HD-derived PBMCs without (n = 14) or with Tregs (autologous or allogenic) (n = 9) or Tregs alone (n = 3). (C) Overall survival of mice that were injected with HD-derived PBMCs without (n = 14) or with Tregs (autologous or allogenic) (n = 9) or Tregs alone (n = 3). (D) Representative histology tissue sections of the mouse femur bone and spleen. Hematoxylin and eosin staining; scale bar, 100 μm. (E) Overall survival of mice that were injected with AA patient-derived PBMCs without (n = 5) or with AA Tregs (autologous or allogenic) (n = 8) or AA Tregs alone (n = 2).
In vitro expanded Tregs suppress GVHD in NSG-SGM3 mice. (A) Schematic representation of isolation of Tregs, followed by xenotransplantation and downstream analysis. (B) Measurement of body weight loss (representing GVHD disease clinical feature) in recipient mice that were injected with HD-derived PBMCs without (n = 14) or with Tregs (autologous or allogenic) (n = 9) or Tregs alone (n = 3). (C) Overall survival of mice that were injected with HD-derived PBMCs without (n = 14) or with Tregs (autologous or allogenic) (n = 9) or Tregs alone (n = 3). (D) Representative histology tissue sections of the mouse femur bone and spleen. Hematoxylin and eosin staining; scale bar, 100 μm. (E) Overall survival of mice that were injected with AA patient-derived PBMCs without (n = 5) or with AA Tregs (autologous or allogenic) (n = 8) or AA Tregs alone (n = 2).
Next, human HD PBMCs were injected into NSG-SGM3 mice with or without expanded Tregs (1:1 ratio; 10 × 106). Then, mice that were injected with PBMC+Tregs also received additional doses of Tregs every 2 weeks postinjection (Figure 5A). These 2 weekly Treg injection doses were chosen based on our earlier experiment showing exhaustion of Tregs after 5 weeks (supplemental Figure 8C) in mice. Tregs or PBMC+Tregs–recipient mice showed no or little clinical disease symptoms associated with xeno-GVHD. Tregs or PBMC+Tregs–recipient mice lost less body weight as compared with mice injected with PBMCs alone (Figure 5B). Notably, mice injected with either Tregs or PBMC+Tregs had a significantly better overall survival compared with mice injected with PBMCs alone (Figure 5C). Following xenotransplantation, male recipient mice had a better survival than female counterparts (data not shown). Histological assessment of mouse femurs and spleen at the time of death illustrated that tissue from PBMC-recipient mice had acellular BM and severe disruption of tissue architecture in the BM as well as spleen (Figure 5D; supplemental Figure 10A; supplemental Figure 11). Morphological assessment of BM sections demonstrates atypical hematopoiesis with prominent fibrotic tissue in mice injected with PBMCs alone. However, mice injected with Tregs with or without PBMCs had normocellular marrow with no or little evidence of marrow fibrosis and Tregs present in BM (Figure 5D; supplemental Figure 12). We next tested expanded Tregs from AA patients in NSG-SGM3 mice. Similar to HD Tregs, AA-expanded Tregs (1:1 ratio; up to 4.5 × 10⁶ cells) provided the protective effect from xeno-GVHD symptoms, and mice with either Tregs or PBMC+Tregs survived significantly longer compared with mice injected with PBMCs alone (Figure 5E; supplemental Figure 10B). It is noteworthy that the GVHD suppressive ability of HD Tregs was better compared with AA Tregs, even though recipient mice with HD cells received higher doses of PBMCs (AA: 1.75 to 4.5 × 10⁶ vs HD: 10 × 106).
Immune signatures and TCR clonality of the expanded Tregs pre- and posttransplanted into NSG-SGM3 mice
To study the possible changes in Tregs’ immune signatures before and after xenotransplantation, we performed multiparameter mass cytometry on expanded Tregs preinjection and Tregs isolated from PBMC+Tregs–recipient mice BM. In vitro expanded Tregs isolated from HD and AA patients had similar immune profiles prior to injection into mice (Figure 6A). Although we observed a significant upregulation of PD-1, Helios, Tbet, and downregulation of CD62L, CD38, GATA3, CCR4, CXCR4, CD177 after xenotransplantation of HD-expanded Tregs (supplemental Figure 13A), Pearson correlation analysis on median expression of 29 parameters showed that the immunological phenotypes of HD-expanded Tregs before and after xenotransplantation were similar (range of r = 0.45 to 0.64) (Figure 6B). Similarly, there was significant downregulation of CXCR4, CCR4, CD45RO, GATA3, FoxP3, CD38, CD7, and CD161 after xenotransplantation of AA-expanded Tregs (supplemental Figure 13B); however, Pearson correlation analysis on median expression of 29 parameters showed similar immunological phenotypes of AA-expanded Tregs before and after xenotransplantation (range of r = 0.04 to 0.47) (Figure 6C). Interestingly, when we compared Treg-B–specific markers between pre- and posttransplanted expanded Tregs, CCR4 expression was markedly reduced after xenotransplantation of both HD (P value = .00017) and AA (P value < .0001) expanded Tregs (Figure 6D-E; supplemental Figure 14; supplemental Figure 15). In addition to CCR4 expression, CD45RO (P value < .0001) expression was also significantly downregulated after AA-expanded Tregs were injected into mice (Figure 6E; supplemental Figure 15). Overall, despite some phenotypic changes following xenotransplantation, expanded Tregs from HD and AA were able to protect mice against GVHD.
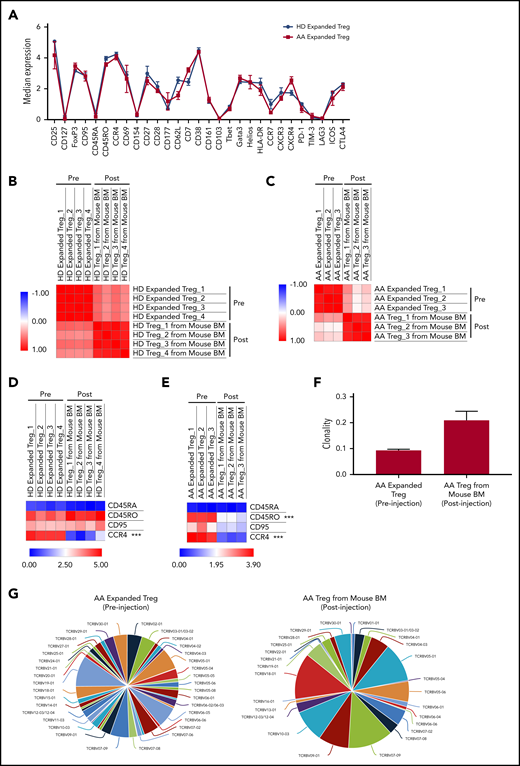
Immune signatures and TCR clonality of the expanded Tregs before and after xenotransplantation into NSG-SGM3 mice. (A) CyTOF analysis shows the relative median expression of the 29 markers in HD (n = 3) and AA (n = 4) expanded total Tregs. (B) Heat map of similarity matrix between pre- (n = 4) and postinjection (n = 4) of HD-expanded Tregs based on 29 parameters, computed as Pearson correlation coefficient. (C) Heat map of similarity matrix between pre- (n = 3) and posttransplantation (n = 3) of AA-expanded Tregs into NSG-SGM3 mice based on 29 parameters, computed as Pearson correlation coefficient. (D) Heat map of CyTOF analysis shows the comparison of the median expression of markers that defined Treg-B (CD45RA, CD45RO, CD95, and CCR4) between pre- (n = 4) and posttransplanted (n = 4) HD-expanded Tregs. ***P ≤ .001. (E) Heat map shows the comparison of the median expression of Treg-B–specific markers (CD45RA, CD45RO, CD95, and CCR4) between pre- (n = 3) and posttransplanted (n = 3) AA-expanded Tregs. ***P ≤ .001. (F) Productive clonality of the TCR repertoires of AA-expanded Tregs before (n = 3) and after (n = 3) xenotransplantation into NSG-SGM3 mice. Values near 1 represent samples with 1 or a few predominant rearrangements (monoclonal or oligoclonal samples) dominating the observed repertoire. Clonality values near 0 represent more polyclonal samples. (G) Representative pie charts show the diversity of TCR Vβ CDR3 in AA-expanded Tregs before and after xenotransplantation into NSG-SGM3 mice.
Immune signatures and TCR clonality of the expanded Tregs before and after xenotransplantation into NSG-SGM3 mice. (A) CyTOF analysis shows the relative median expression of the 29 markers in HD (n = 3) and AA (n = 4) expanded total Tregs. (B) Heat map of similarity matrix between pre- (n = 4) and postinjection (n = 4) of HD-expanded Tregs based on 29 parameters, computed as Pearson correlation coefficient. (C) Heat map of similarity matrix between pre- (n = 3) and posttransplantation (n = 3) of AA-expanded Tregs into NSG-SGM3 mice based on 29 parameters, computed as Pearson correlation coefficient. (D) Heat map of CyTOF analysis shows the comparison of the median expression of markers that defined Treg-B (CD45RA, CD45RO, CD95, and CCR4) between pre- (n = 4) and posttransplanted (n = 4) HD-expanded Tregs. ***P ≤ .001. (E) Heat map shows the comparison of the median expression of Treg-B–specific markers (CD45RA, CD45RO, CD95, and CCR4) between pre- (n = 3) and posttransplanted (n = 3) AA-expanded Tregs. ***P ≤ .001. (F) Productive clonality of the TCR repertoires of AA-expanded Tregs before (n = 3) and after (n = 3) xenotransplantation into NSG-SGM3 mice. Values near 1 represent samples with 1 or a few predominant rearrangements (monoclonal or oligoclonal samples) dominating the observed repertoire. Clonality values near 0 represent more polyclonal samples. (G) Representative pie charts show the diversity of TCR Vβ CDR3 in AA-expanded Tregs before and after xenotransplantation into NSG-SGM3 mice.
To investigate the T-cell receptor (TCR) clonality of the expanded Tregs before and after xenotransplantation, we performed TCR Vβ chain CDR3 high-throughput sequencing on expanded Tregs preinjection and Tregs isolated from PBMC+Tregs–recipient mice BM. The average productive clonalities of the AA-expanded Treg before and after xenotransplantation were 0.093 and 0.209, respectively, indicating that TCR repertoires of Treg cells are less diverse following xenotransplantation after in vivo exposure to inflammatory environment (Figure 6F-G). Similarly, for HD-expanded Tregs, the average productive clonalities before and after xenotransplantation were 0.071 and 0.231, respectively (supplemental Figure 16).
Discussion
The reduction in the number and function of Tregs is a well-known phenomenon in AA,4,17-19 although the exact mechanism is less clear. The expansion of activated T cells as well as an increase in proinflammatory cytokines such as interferon-γ and tumor necrosis factor-α4,5 could play an important role in preventing immunoregulatory function of Tregs and create a vicious circle of immune dysregulation. In addition, expansion of autoreactive T cells in AA results in destruction of HSPC, partly through the Fas/FasL cytotoxic pathway where Fas expression is enhanced on CD34+ cells and FasL is upregulated in the T lymphocytes.7,31-35 The specific subpopulation of suppressive and proliferative Tregs (Treg-B) expresses a higher level of CD95 (Fas) than another less proliferative subpopulation, known as Treg-A.20 In this study, we have demonstrated that FasL induces a higher degree of apoptosis in Treg-B, and these Tregs remain FasL sensitive even after response to IST. Considering the suggested role of FasL-induced progenitor cells’ apoptosis in AA, it could similarly be the reason for the skewed composition of Tregs in AA patients. Although Treg-A is less sensitive to FasL, Treg-A do not expand in AA patients in the presence of low concentration of IL-2. IL-2 is a key cytokine for the Treg differentiation, functional competence, and stability36-38 ; thus, we hypothesized that Treg-A do not respond to the physiological level of IL-2 and cannot expand in AA to compensate for overall reduction in Tregs due to FasL-induced apoptosis. Here we show that indeed Treg-A do not respond to low concentration of IL-2 and thus do not compensate for the decrease in Treg-B observed in AA.
We were able to expand Treg-A and Treg-B using a high concentration of IL-2 and anti-CD3/CD28 activation beads with rapamycin and ATRA in vitro. Surprisingly, we observed a markedly higher in vitro expansion of Treg-A isolated from AA patients compared with Treg-B, which could be due to the removal of inhibitory effects of in vivo inflammatory environment in AA that prevents Tregs function and expansion.
Following in vitro expansion, expanded Tregs show similarities with Treg-B phenotypically and at the gene expression level. One of the main characteristics of Treg-B is high expression of Fas and their sensitivity to FasL-mediated apoptosis. Therefore, it raises the question whether the expanded Tregs, which also express a high level of Fas, remain FasL sensitive and go through apoptosis if exposed to FasL. Nevertheless, we showed that IL-2 was able to rescue FasL-induced apoptosis in expanded Tregs, indicating less sensitivity to FasL. Following expansion, Tregs express a high level of prosurvival protein p-BCL-2, suggesting that expanded Tregs are able to survive in an inflammatory environment. Furthermore, there was a higher p-BCL-2 protein expression in AA-expanded Tregs when compared with HD-expanded Tregs, in line with the finding of higher expansion and proliferation rates in AA Tregs compared with the HD.
Adoptive Treg therapy has shown promising outcomes in several clinical settings, including GVHD,39,40 solid organ transplant rejection,41,42 type 1 diabetes,43-45 as well as autoimmune diseases such as systemic lupus erythematosus46,47 and Crohn disease.48 Although the subtypes of AA patients involved in this study were heterogenous, we hereby demonstrated that in vitro expanded Tregs from AA are functional and stable with minimal plasticity, giving the potential of using these expanded Tregs as an additional strategy to restore the Treg reduction in AA patients, which may improve the clinical outcome of the standard treatment using IST. Indeed, by using the NSG-SGM3 mouse model, we have shown the efficacy of in vitro expanded Tregs in protecting mice against GVHD. Although AA and HD Tregs were able to similarly suppress the proliferation of Tcon cells in vitro, the efficacy of AA-expanded Tregs in suppressing GVHD in vivo was found slightly lower than the HD-expanded Tregs. This differences in the in vivo immunosuppressive ability of AA and HD Tregs might be due to the preactivation of T-effector cells from AA patients who were coinjected with Tregs and which was not the case in HD T-effector cells.4,5 In other words, AA-expanded Tregs were inhibiting less “suppressible” T-effector cells compared with HD counterparts. This could be a less problematic issue in a clinical setting where AA patients would receive IST first (ie, antithymocyte globulin), which will eliminate the activated T-effector cells.
This study, for the first time, delineates the mechanisms behind the skewed Tregs composition in AA, which could be targeted for therapy. In addition, these findings suggest a potential role for therapy with low-dose and/or low-affinity IL-2 in AA as well as the potential clinical use of expanded autologous Tregs to improve patient clinical outcome in addition to the standard IST.
The RNA sequencing data reported in this article have been deposited in the Gene Expression Omnibus database (accession number GSE140844).
For original data, please contact the corresponding author.
The online version of this article contains a data supplement.
The publication costs of this article were defrayed in part by page charge payment. Therefore, and solely to indicate this fact, this article is hereby marked “advertisement” in accordance with 18 USC section 1734.
Acknowledgments
The authors thank the Haematology Department Tissue Bank, and especially Rajani Chelliah, for processing patient samples. The authors also thank The Francis Crick FACS Facility, Histopathology Facility, and Biological resources facility. The authors are grateful to Aytug Kizilors, Thomas Coats,Frederic Toulza,Stephen Orr, and Jamal Anwar for their help with some experiments as well as for their scientific input.
This work is supported by a research program grant from Bloodwise UK and a research grant from the Aplastic Anemia and MDS International Foundation, USA (S.K.) and by a grant from Cancer Research UK (A29283) (S.K.). The authors acknowledge financial support from the Department of Health via the National Institute for Health Research Biomedical Research Centre awarded to Guy’s and St. Thomas’ NHS Foundation Trust in Partnership with King’s College London and King’s College Hospital NHS Foundation Trust.
Authorship
Contribution: S.P.L., B.C., and S.A.M. designed the study, performed experiments, analyzed and interpreted data, and wrote the manuscript; P.P.A., A.A., and L.A.-M. contributed to the experiments; S.G. provided clinical data; M.M.L. analyzed data and contributed to writing the paper; J.J.L., G.A.M.P., and T.P.M. analyzed data; R.A.d.R. performed experiments and analyzed data; S.H. provided mass cytometry data quality control; J.M.I. and G.L. contributed to data interpretation and writing the paper; J.C.W.M. supervised the project and contributed to writing the paper; and D.B., S.K., and G.J.M. designed the study, supervised the project, analyzed and interpreted data, and contributed to writing the paper.
Conflict-of-interest disclosure: J.M.I. is a cofounder and board member at Cytobank Inc. The remaining authors declare no competing financial interests.
Correspondence: Shahram Kordasti, Department of Haematology, School of Cancer and Pharmaceutical Sciences, Faculty of Life Sciences and Medicine, King’s College London, London, United Kingdom; e-mail: shahram.kordasti@kcl.ac.uk; and Ghulam J Mufti; Department of Haematology, School of Cancer and Pharmaceutical Sciences, Faculty of Life Sciences and Medicine, King’s College London, London, United Kingdom; e-mail: ghulam.mufti@kcl.ac.uk.

This feature is available to Subscribers Only
Sign In or Create an Account Close Modal