

Key Points
Impaired HSC self-renewal in β-thalassemia is induced by prolonged residence in an altered BM microenvironment.
Correction of HSC-stromal niche cross talk rescues thalassemic HSC function by in vivo reactivation of PTH signaling.

Abstract
Hematopoietic stem cells (HSCs) are regulated by signals from the bone marrow (BM) niche that tune hematopoiesis at steady state and in hematologic disorders. To understand HSC-niche interactions in altered nonmalignant homeostasis, we selected β-thalassemia, a hemoglobin disorder, as a paradigm. In this severe congenital anemia, alterations secondary to the primary hemoglobin defect have a potential impact on HSC-niche cross talk. We report that HSCs in thalassemic mice (th3) have an impaired function, caused by the interaction with an altered BM niche. The HSC self-renewal defect is rescued after cell transplantation into a normal microenvironment, thus proving the active role of the BM stroma. Consistent with the common finding of osteoporosis in patients, we found reduced bone deposition with decreased levels of parathyroid hormone (PTH), which is a key regulator of bone metabolism but also of HSC activity. In vivo activation of PTH signaling through the reestablished Jagged1 and osteopontin levels correlated with the rescue of the functional pool of th3 HSCs by correcting HSC-niche cross talk. Reduced HSC quiescence was confirmed in thalassemic patients, along with altered features of the BM stromal niche. Our findings reveal a defect in HSCs in β-thalassemia induced by an altered BM microenvironment and provide novel and relevant insight for improving transplantation and gene therapy approaches.
Introduction
In steady-state conditions, the adult hemopoietic system is maintained by hematopoietic stem cells (HSCs), which reside within the bone marrow (BM) in a specialized microenvironment, termed "niche."1 Although HSCs are quiescent and only occasionally enter the cell cycle, they can reversibly exit from dormancy in response to stress conditions.2 Thus, HSC self-renewal is maintained, not only by cell-intrinsic factors, but also by extrinsic elements from the local and systemic environment. Several nonhematopoietic BM stromal cell types participate in the regulation of HSCs in specialized niches, such as osteolineage and endothelial and mesenchymal stromal cells (MSCs), by providing physical support and regulating HSC homeostasis.3-7 In this interactive system, relationships among cellular components are based on molecular stimuli, such as retention factors, trophic molecules, and regulators of quiescence and stress signals.8 Niche composition and function change under different physiological conditions or in response to stress, and studies have mainly been focused on exploring the BM niche in malignancies. However, these aspects are still poorly investigated in pathologies where HSCs are not directly affected, but BM homeostasis is altered.
As a paradigm, β-thalassemia, caused by genetic defects of β-globin production leading to severe anemia, presents a massive expansion of immature erythroid precursor cells prematurely dying within the marrow parenchyma, thus altering BM homeostasis and generating stress signals.9-11 Besides some alterations already described, such as altered bone metabolism, associated with osteopenia and osteoporosis,12,13 the thalassemic BM milieu is still poorly characterized.
Correction of the erythropoietic defect in β-thalassemia is achieved by HSC transplantation (HSCT) from healthy donors or by experimental transplantation of autologous cells genetically modified by gene therapy, and in both settings, the transplanted HSCs and the recipient BM niche are central elements. In comparison with other indications for allogeneic HSCT, there is an unexplained increased risk of graft rejection, including cases of late rejection, and mixed chimerism.14,15 We have recently characterized MSCs from thalassemic patients for their biological and functional properties, showing their impaired capacity for hematopoietic support.16 In this respect, understanding the HSC-niche interaction will offer the possibility of optimizing the clinical approach.
We studied HSC function in the Hbbth3/+ murine model of severe β-thalassemia intermedia, and we discovered an unknown defect in HSC function, caused by interaction with an altered BM niche. We showed that HSC impairment is reversible by exposure to a normal microenvironment and by targeting the stromal BM niche with in vivo restoration of the Jagged1 (JAG1) and osteopontin (OPN) levels. These findings are corroborated by the reduced quiescence of CD34+ hematopoietic stem and progenitor cells (HSPCs) and altered features of the BM stromal niche in patients, thus highlighting the clinical relevance of our results.
Methods
Mouse model and BM transplantation
Male and female C57BL/6 and C57BL/6-CD45.1 (B/6.SJLCD45a-Pep3b) wild-type (WT) mice were purchased from Charles River. C57BL6/Hbbth3/+ mice were purchased from The Jackson Laboratory and bred to maintain the colony in heterozygosity. All animal experiments were performed in accordance with approved protocols of the Institutional Animal Care and Use Committees of San Raffaele Institute. All the analyses were performed on adult 10- to 12-week-old mice, unless differently specified. For competitive bone marrow transplantation (BMT) experiments, a limiting dose of 4 × 10⁴ per mouse WT (CD45.1) and th3 (CD45.2) cells, normalized for HSC content, was injected intravenously into lethally irradiated (932cGy) WT or th3 (CD45.1) recipient mice. At termination, total BM cells were analyzed and injected into lethally irradiated secondary WT or th3 (CD45.1) recipients (dose, 4 × 10⁶ cells per mouse).
Human samples
BM sampling was performed for pretransplantation marrow evaluation in donors and patient candidates for allogeneic BMT.17 For control purposes, normal, uninvolved BM bioptic samples from patients with Hodgkin lymphoma at diagnosis and BM samples from patients with secondary polycythemia were selected. All samples were obtained after informed consent from patients or legal guardians and with the approval of institutional ethics committees. Adult healthy donor CD34+ cells were purchased from Lonza.
Statistical analysis
Data were analyzed by using GraphPad Prism software, version 5 (La Jolla, CA). All data are expressed as means ± SEM. The Mann-Whitney U test was used for comparisons between 2 independent groups, and the Wilcoxon test was performed for comparisons between dependent groups.
Further details on experimental procedures have been included in the supplemental Materials and Methods, available on the Blood Web site.
Results
Reduced frequency and loss of quiescence of HSCs in th3 mice
In the murine Hbbth3/+ mutant strain (th3),18 erythropoiesis is significantly altered, with anemia and massive expansion of the erythroid compartment because of ineffective erythropoiesis, thereby paralleling several aspects of the human pathophysiology of β-thalassemia.
To investigate the impact of altered homeostasis and stress signals on hematopoietic primitive and committed progenitors, we evaluated the composition of this compartment in the BM by immunophenotype analysis. Both total BM nucleated cells and the more primitive lineage negative (Lin−) populations were unaltered in mutant mice, compared with age-matched controls (supplemental Figure 1A). No statistically relevant differences were found in the frequency of committed and multipotent hematopoietic progenitors (supplemental Figure 1B), as evaluated by a multiple gating strategy.19 On the contrary, the proportion and the absolute number of HSCs, defined by the expression of CD48 and CD150 markers within the Lin−Sca-1+c-Kit+ cell compartment4 were significantly lower in th3 mice (P = .006 and P = .014, respectively; Figure 1A).

Reduced frequency and loss of quiescence of HSCs in th3 mice. (A) Representative plots of HSCs gated from BM Lin−Sca-1+c-Kit+ cells. WT and th3 HSC frequency on BM Lin− cells and absolute counts from both femurs and tibiae. WT, n = 8; th3, n = 9. (B) Evaluation of cell cycle distribution among G0/G1, S, and G2/M phases of WT and th3 HSCs by cytofluorimetry after 7-AAD staining. 7-AAD/Ki-67 staining was performed to discriminate between G0 and G1 phases. WT, n = 9; th3, n = 8. (C) Frequency of cycling HSCs expressed as a percentage of LRCs, revealing BrdU+ HSCs by in vivo BrdU pulse-chase assay. Chase fold-decrease, compared with respective pulse labeling is reported. WT pulse, n = 3; WT chase, n = 5; th3 pulse, n = 3; th3 chase, n = 3. (D-E) GSEA enrichment plots of the cell cycle–associated categories from the biological process branch of the GO database, showing the profile of the running enrichment score and the positions of gene set members on the rank-ordered list. Enrichment of th3 HSCs vs WT HSCs is reported. (F) Representative images of γH2AX+ foci in the nuclei of WT and th3 Lin− cells. Analysis of the frequency of cells accumulating DNA damage, shown as a percentage of γH2AX+ cells, is reported. WT, n = 3; th3, n = 3. Immunofluorescence analysis by anti-phospho-H2AX (Ser139) staining was performed. Cell nuclei were stained with Hoechst 33342. (G) GSEA enrichment plot of the cellular response to stress category from the Reactome Pathway database, showing the profile of the running enrichment score and the positions of gene set members on the rank-ordered list. Enrichment in th3 HSCs vs WT HSCs is reported. (H) GSEA enrichment plot showing the profile of the running enrichment score and the positions of gene set members on the rank-ordered list of key genes reported to be associated with HSC stemness. Enrichment in th3 HSCs vs WT HSCs is reported. (I) Methylcellulose CFU replating assay using sorted HSCs from WT and th3 mice. Absolute number of CFUs per plate is shown at different platings. WT, n = 6; th3, n = 6. *P < .05; **P < .01. NES, normalized enriched score.
Reduced frequency and loss of quiescence of HSCs in th3 mice. (A) Representative plots of HSCs gated from BM Lin−Sca-1+c-Kit+ cells. WT and th3 HSC frequency on BM Lin− cells and absolute counts from both femurs and tibiae. WT, n = 8; th3, n = 9. (B) Evaluation of cell cycle distribution among G0/G1, S, and G2/M phases of WT and th3 HSCs by cytofluorimetry after 7-AAD staining. 7-AAD/Ki-67 staining was performed to discriminate between G0 and G1 phases. WT, n = 9; th3, n = 8. (C) Frequency of cycling HSCs expressed as a percentage of LRCs, revealing BrdU+ HSCs by in vivo BrdU pulse-chase assay. Chase fold-decrease, compared with respective pulse labeling is reported. WT pulse, n = 3; WT chase, n = 5; th3 pulse, n = 3; th3 chase, n = 3. (D-E) GSEA enrichment plots of the cell cycle–associated categories from the biological process branch of the GO database, showing the profile of the running enrichment score and the positions of gene set members on the rank-ordered list. Enrichment of th3 HSCs vs WT HSCs is reported. (F) Representative images of γH2AX+ foci in the nuclei of WT and th3 Lin− cells. Analysis of the frequency of cells accumulating DNA damage, shown as a percentage of γH2AX+ cells, is reported. WT, n = 3; th3, n = 3. Immunofluorescence analysis by anti-phospho-H2AX (Ser139) staining was performed. Cell nuclei were stained with Hoechst 33342. (G) GSEA enrichment plot of the cellular response to stress category from the Reactome Pathway database, showing the profile of the running enrichment score and the positions of gene set members on the rank-ordered list. Enrichment in th3 HSCs vs WT HSCs is reported. (H) GSEA enrichment plot showing the profile of the running enrichment score and the positions of gene set members on the rank-ordered list of key genes reported to be associated with HSC stemness. Enrichment in th3 HSCs vs WT HSCs is reported. (I) Methylcellulose CFU replating assay using sorted HSCs from WT and th3 mice. Absolute number of CFUs per plate is shown at different platings. WT, n = 6; th3, n = 6. *P < .05; **P < .01. NES, normalized enriched score.
On the basis of the data, we investigated the HSC cell cycle profile. Cell cycle analysis revealed a loss of quiescence in th3 HSCs, with a significantly lower frequency of cells in the G0/G1 phase and a higher fraction of cells accumulating in the S phase. In particular, the proportion of G0 phase cells decreased in th3 mice (Figure 1B). To assess the presence of in vivo dormant HSCs, we performed a BrdU pulse-chase assay, called a label-retaining assay.2 We observed a 2-fold lower frequency of BrdU label-retaining cells (LRCs) in the th3 group (6.5-fold vs 13.2-fold reduction of LRC BrdU+ HSCs in WT vs th3 mice; Figure 1C). These data show that th3 HSCs divide more frequently than WT cells and thus have a higher cycling rate. Gene set enrichment analysis (GSEA) using the biological process branch of the gene ontology (GO) database of RNA-seq experiments performed on sorted HSCs revealed a statistically significant enrichment of cell cycle–associated categories in th3 HSCs, compared with WT cells (Figure 1D-E), thus showing the molecular basis of our evidence.
We evaluated the accumulation of DNA damage, as a phenomenon intrinsically linked to enhanced cell proliferation and replication stress. A higher proportion of th3 cells accumulated DNA damage, monitored by observing the phosphorylation of histone H2AX (γH2AX) when DNA breaks were sensed (Figure 1F), as previously reported for stressed or aged HSCs.20 Consistently, GSEA using the Reactome Pathway database revealed a significant enrichment of genes associated with cellular responses to stress in the th3 HSC transcriptome profile (Figure 1G).
To investigate the functional association of stemness-related pathways, we further considered the expression profile of th3 HSCs, and we highlighted a negative correlation of key genes reported to be associated with HSC stemness21,22 (Figure 1H). Thus, we examined th3 HSC functional quality by evaluating their in vitro serial replating capacity. A colony-forming unit (CFU) assay of sorted th3 HSCs demonstrated their reduced clonogenic potential at each plating time, compared with WT controls (Figure 1I). This assay provided the first evidence of reduced th3 HSC self-renewal, therefore suggesting impaired function.
Rescue of th3 HSC impaired repopulating potential by transplantation into a normal BM niche
To evaluate the in vivo functional activity of th3 HSCs, we performed long-term BMT experiments. To determine the influence of the recipient BM niche, we injected in a competitive setting an equal number of WT (CD45.1) and th3 (CD45.2) HSCs into WT and th3 CD45.1 recipient mice (Figure 2A). Reconstituted hematopoiesis in primary recipients was observed up to 1 year after BMT. Twelve months after BMT, we observed a competitive disadvantage of thalassemic HSCs, compared with the WT grafted counterpart, when transplanted into th3 recipient animals (Figure 2B). On the other hand, transplantation into WT recipients restored th3 HSC long-term repopulating potential (Figure 2B), suggesting that the BM niche has a corrective role in HSC behavior. These results were substantiated by cell cycle analysis of grafted HSCs at termination, as in th3 mice a lower proportion of thalassemic HSCs were in the G0/G1 phase, compared with the WT ones, but this frequency significantly increased upon transplantation in a WT niche (Figure 2C).
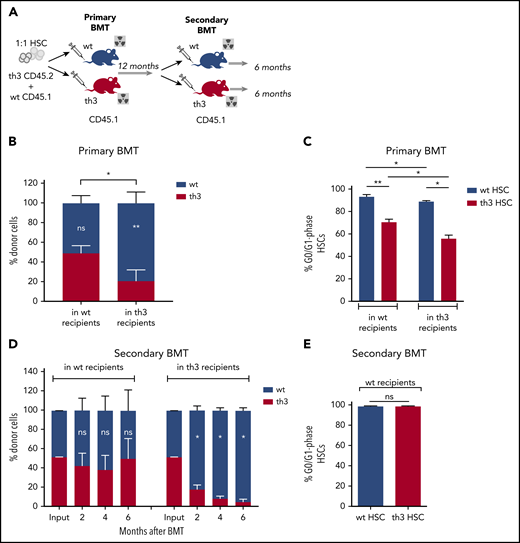
Rescue of th3 HSC impaired repopulating potential by transplantation into a normal BM niche. (A) Experimental scheme of primary and secondary competitive BMT. Transplantation of Lin− BM cells from th3 CD45.2 and WT CD45.1 mice at a 1:1 HSC ratio into lethally irradiated WT and th3 CD45.1 animals. One year after primary BMT, total BM cells from WT mice were transplanted into both WT and th3 lethally irradiated secondary recipients. (B) Peripheral blood (PB) chimerism of th3 and WT cells in WT and th3 recipient mice at 12 months after primary BMT. WT, n = 13; th3, n = 8. Notation inside the bars refers to differences between WT and th3 competitor cells into the same recipient. (C) Cell cycle analysis on th3 and WT grafted HSCs from WT and th3 primary recipients. Frequencies of G0/G1 phase HSCs are reported. WT, n = 5; th3, n = 3. (D) PB chimerism of th3 and WT cells in WT (left) and th3 (right), observed for 6 months after secondary competitive BMT. WT, n = 6; th3, n = 3. (E) Analysis of cell cycles of th3 and WT HSCs transplanted in secondary WT recipients. WT, n = 3; th3, n = 3. *P < .05; **P < .01; NS, nonsignificant.
Rescue of th3 HSC impaired repopulating potential by transplantation into a normal BM niche. (A) Experimental scheme of primary and secondary competitive BMT. Transplantation of Lin− BM cells from th3 CD45.2 and WT CD45.1 mice at a 1:1 HSC ratio into lethally irradiated WT and th3 CD45.1 animals. One year after primary BMT, total BM cells from WT mice were transplanted into both WT and th3 lethally irradiated secondary recipients. (B) Peripheral blood (PB) chimerism of th3 and WT cells in WT and th3 recipient mice at 12 months after primary BMT. WT, n = 13; th3, n = 8. Notation inside the bars refers to differences between WT and th3 competitor cells into the same recipient. (C) Cell cycle analysis on th3 and WT grafted HSCs from WT and th3 primary recipients. Frequencies of G0/G1 phase HSCs are reported. WT, n = 5; th3, n = 3. (D) PB chimerism of th3 and WT cells in WT (left) and th3 (right), observed for 6 months after secondary competitive BMT. WT, n = 6; th3, n = 3. (E) Analysis of cell cycles of th3 and WT HSCs transplanted in secondary WT recipients. WT, n = 3; th3, n = 3. *P < .05; **P < .01; NS, nonsignificant.
To exclude any defect in the homing capacity of th3 HSCs, we first analyzed, at the protein and transcript levels, some of the key molecules involved in stem cell homing and maintenance, and we found them unchanged in th3 mice (supplemental Figure 2A-B). An in vivo homing assay confirmed that th3 HSCs normally home to a WT niche. On the other hand, niche-driven, impaired homing was observed after transplantation of WT cells into thalassemic recipient mice (supplemental Figure 2C), highlighting the negative contribution of the thalassemic niche and the absence of intrinsic homing defects in th3 HSCs.
To test whether the beneficial effect of the normal niche on th3 HSCs is sufficient to maintain long-term self-renewal and to prevent their exhaustion, we performed secondary BMT experiments (Figure 2A). BM cells harvested at 1 year from 50% chimeric primary WT recipients were transplanted into WT and th3 secondary recipient mice. In WT animals, WT and th3 HSCs showed an equal contribution to reconstitution (Figure 2D), with complete normalization of the th3 HSC cycling activity (Figure 2E), suggesting that prolonged nurturing by a normal niche efficiently rescues HSC function. On the contrary, the contribution by th3 cells in thalassemic recipients decreased with time, indicating progressive exhaustion (Figure 2D).
Impaired bone formation and the BM stromal niche in th3 mice
To gain insight into the BM microenvironment, we first analyzed the nurturing of HSCs by the BM stromal niche. Because osteoporosis and osteopenia are secondary defects associated with β-thalassemia12 and the endosteal niche has a role in HSC homeostasis, we first investigated the status of the osteoblastic environment. In histomorphological analysis of the femur metaphysis, a slight decrease in the subchondral trabecular bone network density was detected in th3 mice (Figure 3A). However, no evident alteration in the presence of osteoblasts (OBs) and osteoclasts (OCs) or in their distribution along the bone trabeculae was evident (supplemental Figure 3A). Peripheral quantitative computed tomographic (pQCT) scanning of the proximal metaphysis of the tibiae showed reduced volumetric bone mineral density (BMD) of both the trabecular and cortical bone compartments in th3 mice (Figure 3B; supplemental Figure 3B-C), along with an increased medullary canal area and endosteal circumference (supplemental Figure 3D). In addition, quantitative immunohistochemical (IHC) analysis revealed reduced density of type 1 collagen expression in the subchondral trabecular bone area (Figure 3C).
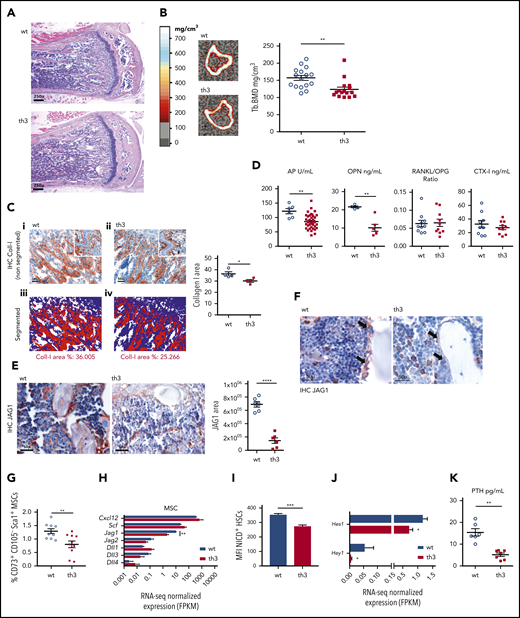
Impaired bone formation and BM stromal niche in th3 mice. (A) Histological analysis of representative BM sections stained with hematoxylin and eosin. Metaphyses from WT and th3 bones are depicted. WT, n = 10; th3, n = 10. Original magnification ×40. (B) Representative sections of the proximal metaphysis of the tibiae, analyzed by pQCT in WT and th3 mice. Trabecular BMD values of mice tibiae. WT, n = 16; th3, n = 16. (C) IHC evaluation of collagen-1 deposition in subchondral trabecular bone area of th3 and control mice. (i-ii) Original magnification ×200, inset ×40; (iii-iv) original magnification ×200. Representative quantitative analysis of collagen-1–stained area by software analysis calculating the IHC-positive area as a percentage of the total nuclear area. WT, n = 4; th3, n = 4. IHC on BM sections by staining with anti-mouse Collagen-I antibody was performed. (D) Evaluation of soluble markers of bone turnover in WT and th3 sera and BM extracellular fluid by enzyme-linked immunosorbent assay. WT, n ≥ 4; th3, n ≥ 6. (E) IHC analysis of JAG1 in BM stromal niche of th3 and control mice (left). Original magnification ×400. Representative quantitative analysis of the JAG1-stained area, calculated with image-analysis software (right). WT, n = 6; th3 n = 6. IHC on BM sections by staining with anti-mouse JAG1 antibody was performed. (F) IHC staining of JAG1 in BM sections of th3 and control mice, highlighting the difference in staining of the endosteal compartment (arrows). Original magnification ×400. (G) Frequencies of ex vivo isolated MSCs expressing the CD73 and Sca-1 markers in WT and th3 BM. Data are represented as the percentage of the Lin−CD45−CD31−CD105− population. WT, n = 10; th3, n = 10. (H) RNA-seq normalized expression of Cxcl12, Scf, and Notch ligands in MSCs from WT and th3 mice. WT, n = 3 pools; th3, n = 3 pools. (I) Median fluorescence intensity (MFI) of NICD+ HSCs in WT and th3 mice. WT, n = 9; th3, n = 8. (J) RNA-seq normalized expression of Hes1 and Hey1 Notch target genes in sorted HSCs from WT and th3 mice. WT, n = 3 pools; th3, n = 3 pools. (K) Evaluation of PTH in WT and th3 sera by enzyme-linked immunosorbent assay. WT, n = 6; th3, n = 7. *P < .05; **P < .01; ***P < .001; ****P < .0001. FPKM, fragments per kilobase million.
Impaired bone formation and BM stromal niche in th3 mice. (A) Histological analysis of representative BM sections stained with hematoxylin and eosin. Metaphyses from WT and th3 bones are depicted. WT, n = 10; th3, n = 10. Original magnification ×40. (B) Representative sections of the proximal metaphysis of the tibiae, analyzed by pQCT in WT and th3 mice. Trabecular BMD values of mice tibiae. WT, n = 16; th3, n = 16. (C) IHC evaluation of collagen-1 deposition in subchondral trabecular bone area of th3 and control mice. (i-ii) Original magnification ×200, inset ×40; (iii-iv) original magnification ×200. Representative quantitative analysis of collagen-1–stained area by software analysis calculating the IHC-positive area as a percentage of the total nuclear area. WT, n = 4; th3, n = 4. IHC on BM sections by staining with anti-mouse Collagen-I antibody was performed. (D) Evaluation of soluble markers of bone turnover in WT and th3 sera and BM extracellular fluid by enzyme-linked immunosorbent assay. WT, n ≥ 4; th3, n ≥ 6. (E) IHC analysis of JAG1 in BM stromal niche of th3 and control mice (left). Original magnification ×400. Representative quantitative analysis of the JAG1-stained area, calculated with image-analysis software (right). WT, n = 6; th3 n = 6. IHC on BM sections by staining with anti-mouse JAG1 antibody was performed. (F) IHC staining of JAG1 in BM sections of th3 and control mice, highlighting the difference in staining of the endosteal compartment (arrows). Original magnification ×400. (G) Frequencies of ex vivo isolated MSCs expressing the CD73 and Sca-1 markers in WT and th3 BM. Data are represented as the percentage of the Lin−CD45−CD31−CD105− population. WT, n = 10; th3, n = 10. (H) RNA-seq normalized expression of Cxcl12, Scf, and Notch ligands in MSCs from WT and th3 mice. WT, n = 3 pools; th3, n = 3 pools. (I) Median fluorescence intensity (MFI) of NICD+ HSCs in WT and th3 mice. WT, n = 9; th3, n = 8. (J) RNA-seq normalized expression of Hes1 and Hey1 Notch target genes in sorted HSCs from WT and th3 mice. WT, n = 3 pools; th3, n = 3 pools. (K) Evaluation of PTH in WT and th3 sera by enzyme-linked immunosorbent assay. WT, n = 6; th3, n = 7. *P < .05; **P < .01; ***P < .001; ****P < .0001. FPKM, fragments per kilobase million.
We also analyzed bone density after reciprocal BMT (supplemental Figure 3E), and we observed that trabecular BMD correlated with the genotype of the recipient niche, with th3 hosts having a lower bone density than the WT hosts, irrespective of the BM donor genotype (supplemental Figure 3F). This setting demonstrates the osteoblastic origin of bone defect in th3 mice.
Furthermore, analysis of molecules involved in bone metabolism revealed a similar receptor activator of nuclear factor-κB ligand (RANKL)/osteoprotegerin (OPG) ratios in the sera from th3 mice and normal controls (Figure 3D), as a sign of normal OC maturation. Moreover, the C-terminal telopeptides of type 1 collagen (CTX-I), a product of bone-related degradation and index of OC activity, were unaltered. Conversely, serum alkaline phosphatase (P < .01), a marker of OB activity, as well as the levels of the BM matrix glycoprotein OPN (P < .01), mainly produced by OBs, were reduced in th3 mice. The effect of the loss of OPN was reported to increase the number of HSCs and induce them toenter the cell cycle,23,24 which is consistent with our data (Figure 1B). This evidence guided further investigation into other molecules involved in the HSC-stromal niche cross talk. We evaluated JAG1, a Notch ligand involved in controlling HSC maintenance,3,25,26 and we found lower overall in situ expression by the BM stroma (Figure 3E), with a more conspicuous variation in the th3 endosteal compartment (Figure 3F). Since other stromal cell subsets, in particular MSCs, produce Jag1, we analyzed in the th3 BM this population, which we recently found altered in frequency and function in patients with β-thalassemia.16 Consistently, immunophenotype characterization of MSCs by CD73 and Sca-1 surface markers27 showed reduced frequency of the more primitive stromal cells, compared with healthy controls (Figure 3G) and a lower expression of Jag1. However, the expression of other Notch ligands involved in HSC regulation, such as Jagged2 (Jag2); Δ-like canonical Notch ligand-1, -3 and -4 (Dll1, Dll3, Dll4)28,29 ; and key HSC niche molecules, such as C-X-C motif chemokine ligand 12 (Cxcl12) and stem cell factor (Scf),19,30 was not deregulated in th3 MSCs (Figure 3H). Moreover, the reduced Notch ligand JAG1 in the th3 BM stroma was associated with a decreased expression of the activated Notch1 intracellular domain (NICD; P < .001; Figure 3I) and a significantly lower expression of the Notch target genes Hes1 and Hey1 in th3 HSCs (Figure 3J). Because of its role in bone homeostasis but also in HSC activity via OPN and JAG1, we measured parathyroid hormone (PTH) in th3 mice serum and found a significantly lower level (Figure 3K). Of note, this finding mirrors the clinical manifestation commonly observed in patients affected by β-thalassemia.31
Rescue of th3 HSC defect by correction of the BM stromal niche
Our findings of a non–cell-autonomous defect suggest the potential rescue of th3 HSC function by restoring a normal niche. To investigate this issue, we evaluated the effect of in vivo administration of PTH, which we found defective in th3 mutants. Mice were injected daily with rat PTH (1-34), and after 4 weeks, a significantly increased trabecular BMD (P < .01) was observed, with levels comparable to normal ones (Figure 4A). PTH administration led to an overall increase in type 1 collagen expression in situ (Figure 4B) and enhanced the frequency of CD73+Sca-1+ MSCs (supplemental Figure 4). We observed a restored JAG1 expression by the BM stroma after PTH treatment (Figure 4C). Immunofluorescence analyses for the OB marker RUNX2 or the vascular endothelial markers CD31 and endomucin, in combination with JAG1, showed the expression of the Notch ligand by the osteolineage compartment and also by the vascular endothelium (supplemental Figure 5A-B). However, we highlighted the induction of JAG1 expression by PTH treatment in th3 mice in association with bone-lining RUNX2+ elements. We observed markedly decreased levels of OPN in th3 mice, and we therefore evaluated OPN after PTH treatment and found a statistically significant increase in OPN levels (Figure 4D). Conversely, the production of other niche molecules such as SCF, CXCL12, and angiopoietin 1 was not affected by PTH (supplemental Figure 6). The expression signal of these factors decreased overall in th3 BM in comparison to WT, suggesting a contribution from the hematopoietic component rather than from MSCs (Figure 3H).
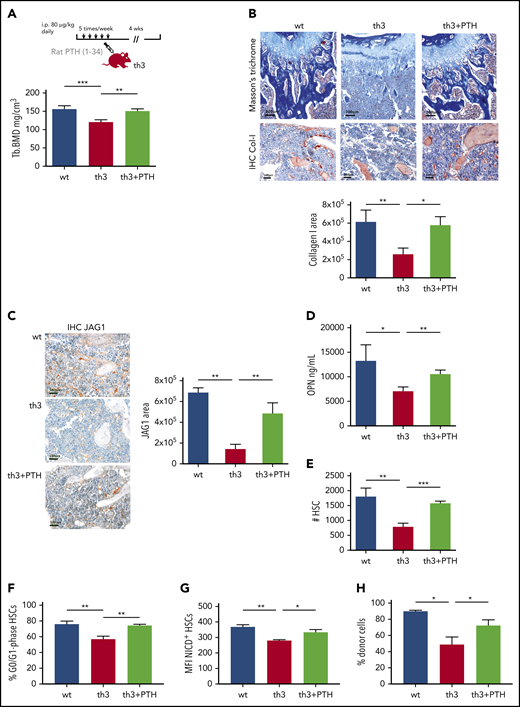
The HSC defect is rescued by PTH administration in th3 mice. (A) Experimental design of in vivo administration of rat PTH (1-34). Trabecular BMD values of mouse tibiae after 4 weeks of treatment. WT, n = 6; th3, n = 6; th3+PTH, n = 6. (B) Masson’s trichrome and IHC evaluation of collagen-1 deposition in WT, th3, and th3+PTH mice. IHC on BM sections by staining with anti-mouse collagen-I antibody was performed. Original magnification: top ×100; bottom ×200. Quantitative analysis of collagen-1 staining, calculating the IHC+ area with image-analysis software. WT, n = 6; th3, n = 6; th3+PTH, n = 6. (C) IHC analysis of JAG1 in BM stromal niche of WT, th3, and th3+PTH mice. Original magnification ×200. Quantitative analysis of JAG1-stained area by image-analysis software. WT, n = 6; th3, n = 6; th3+PTH, n = 6. IHC on BM sections by staining with anti-mouse JAG1 antibody was performed. (D) Evaluation of soluble OPN in BM extracellular fluid of WT, th3 and th3+PTH mice by enzyme-linked immunosorbent assay. WT, n = 4; th3, n = 4; th3+PTH, n = 5. (E) Absolute number of HSCs WT, th3, and PTH-treated th3 mice. WT, n = 14; th3, n = 10; th3+PTH, n = 6. (F) Frequency of quiescent (G0/G1 phase) HSCs in WT, th3, and PTH-treated th3 animals. WT, n = 9; th3, n = 5; th3+PTH, n = 6. (G) Median fluorescence intensity (MFI) of NICD+ HSCs in WT, th3, and th3+PTH mice. WT, n = 5; th3, n = 4; th3+PTH n = 4. (H) Chimerism at 4 months after BMT of WT, th3, and th3+PTH cells injected into lethally irradiated WT recipient animals. WT, n = 5; th3, n = 3; th3+PTH, n = 6. *P < .05; **P < .01; ***P < .001.
The HSC defect is rescued by PTH administration in th3 mice. (A) Experimental design of in vivo administration of rat PTH (1-34). Trabecular BMD values of mouse tibiae after 4 weeks of treatment. WT, n = 6; th3, n = 6; th3+PTH, n = 6. (B) Masson’s trichrome and IHC evaluation of collagen-1 deposition in WT, th3, and th3+PTH mice. IHC on BM sections by staining with anti-mouse collagen-I antibody was performed. Original magnification: top ×100; bottom ×200. Quantitative analysis of collagen-1 staining, calculating the IHC+ area with image-analysis software. WT, n = 6; th3, n = 6; th3+PTH, n = 6. (C) IHC analysis of JAG1 in BM stromal niche of WT, th3, and th3+PTH mice. Original magnification ×200. Quantitative analysis of JAG1-stained area by image-analysis software. WT, n = 6; th3, n = 6; th3+PTH, n = 6. IHC on BM sections by staining with anti-mouse JAG1 antibody was performed. (D) Evaluation of soluble OPN in BM extracellular fluid of WT, th3 and th3+PTH mice by enzyme-linked immunosorbent assay. WT, n = 4; th3, n = 4; th3+PTH, n = 5. (E) Absolute number of HSCs WT, th3, and PTH-treated th3 mice. WT, n = 14; th3, n = 10; th3+PTH, n = 6. (F) Frequency of quiescent (G0/G1 phase) HSCs in WT, th3, and PTH-treated th3 animals. WT, n = 9; th3, n = 5; th3+PTH, n = 6. (G) Median fluorescence intensity (MFI) of NICD+ HSCs in WT, th3, and th3+PTH mice. WT, n = 5; th3, n = 4; th3+PTH n = 4. (H) Chimerism at 4 months after BMT of WT, th3, and th3+PTH cells injected into lethally irradiated WT recipient animals. WT, n = 5; th3, n = 3; th3+PTH, n = 6. *P < .05; **P < .01; ***P < .001.
Notably, PTH administration increased th3 the number of HSCs (P < .001; Figure 4E), expanded the HSC fraction in the G0/G1 phase of the cell cycle (P < .01; Figure 4F), and restored the expression of stemness genes that were altered in the th3 HSCs (supplemental Figure 7A). Particularly, we observed increased levels of Cdkn1c (p57), which is associated with the maintenance of HSC quiescence.32 The rescue of expression of the Notch target gene Hes1 (supplemental Figure 7B) is consistent with the higher levels of NICD expression in HSCs after PTH injection (P = .014; Figure 4G). Furthermore, we tested the functional rescue of th3 HSCs by PTH treatment by transplanting treated cells into WT recipients. Because long-term residence in a normal niche restores the repopulating defect (Figure 2A), we analyzed the transplant-recipient animals at 4 months after BMT, when the impaired th3 HSC function is still evident in untreated mice, and the results showed that PTH treatment rescued the engraftment capacity of the th3 HSCs (Figure 4H).
Overall, these data indicate that pulse dosing of PTH in th3 mice restores the correct BM niche-HSC cross talk and the quiescent HSC pool. As expected, PTH administration did not correct the genetic anemia (supplemental Figure 8A-C).
HSC and BM stroma impairment by disease progression
To further support the notion of acquired HSC defects after prolonged residence in an altered microenvironment, we analyzed HSC frequency in mice at different ages. Newborn animals (10 days old) showed no defect in HSC frequency, but showed a trend toward an expanded HSC pool, while typical signs of dyserythropoiesis were already evident (Figure 5A; supplemental Figure 9A-D). Cell cycle analyses in newborn mice revealed no differences between th3 and WT HSCs (Figure 5B). At this early stage of disease progression, the th3 stromal BM niche was consistently comparable to the WT one in terms of trabecular BMD and serum PTH levels (Figure 5C-D). On the other hand, 4-week-old th3 mice showed a reduced HSC frequency, compared with age-matched WT controls (Figure 5A).
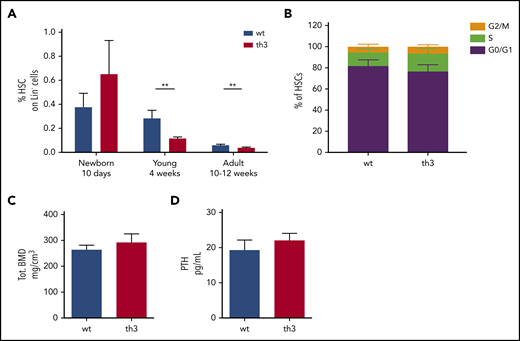
Evaluation of HSCs and bone features in newborn th3 mice. (A) Frequency of HSCs on BM Lin− cells from WT and th3 mice at different ages. WT, n ≥ 5 mice per group; th3, n ≥ 5 mice per group. (B) Analysis of cell cycle distribution among G0/G1, S, and G2/M phases by cytofluorimetry after 7-AAD staining of HSCs from newborn WT and th3 mice. WT, n = 7; th3, n = 7. (C) Total BMD of tibiae from newborn mice analyzed by pQCT. WT, n = 9; th3, n = 6. (D) Evaluation of PTH levels in sera from newborn mice. WT, n = 3; th3, n = 3. **P < .01
Evaluation of HSCs and bone features in newborn th3 mice. (A) Frequency of HSCs on BM Lin− cells from WT and th3 mice at different ages. WT, n ≥ 5 mice per group; th3, n ≥ 5 mice per group. (B) Analysis of cell cycle distribution among G0/G1, S, and G2/M phases by cytofluorimetry after 7-AAD staining of HSCs from newborn WT and th3 mice. WT, n = 7; th3, n = 7. (C) Total BMD of tibiae from newborn mice analyzed by pQCT. WT, n = 9; th3, n = 6. (D) Evaluation of PTH levels in sera from newborn mice. WT, n = 3; th3, n = 3. **P < .01
Altered features of HSPCs and BM niche in patients affected by β-thalassemia
To evaluate the clinical relevance of our results, we considered whether signs of the defective HSC homeostasis, discovered in the murine model, were also present in patients affected by transfusion-dependent β-thalassemia (TDT) (supplemental Table 1). We observed a higher cycling rate of TDT primitive HSPCs, assessed as increased frequency of CD34+CD38− cells in the S/G2/M phases of the cell cycle (P < .05; Figure 6A). Consistent with the molecular signature of fewer quiescent cells, gene expression profile analysis of CD34+ cell samples from pediatric patients (n = 9) and age-matched healthy donors (n = 5)17 revealed a higher response of TDT CD34+ cells to stress stimuli (Figure 6B). Lists of differentially expressed genes were generated with Partek software, by recording transcripts with a greater than twofold change (1-way ANOVA; supplemental Table 2). We identified 735 differentially expressed probe sets, corresponding to 578 genes, with 69.55% significantly upregulated in TDT CD34+ cells (false discovery rate < 0.05). A functional annotation analysis grouped these genes into “biological process” GO categories, with “response to stimulus” having one of the top-ranking scores (enrichment score, 13.75; P < .01; supplemental Figure 10A). Within this GO category, the cellular response to stress, as also highlighted in th3 HSCs (Figure 1H), and in particular, response to oxidative stress and DNA damage, resulted in the most induced genes (enrichment scores, 22.65, 8.13, and 5.27, respectively; P ≤ .01; Figure 6B; supplemental Figure 10B-C). Significantly different upregulated categories also included age-dependent response to oxidative stress and response to reactive oxygen species (supplemental Figure 10D), thus suggesting the exposure of TDT HSPCs to a stressed environment.
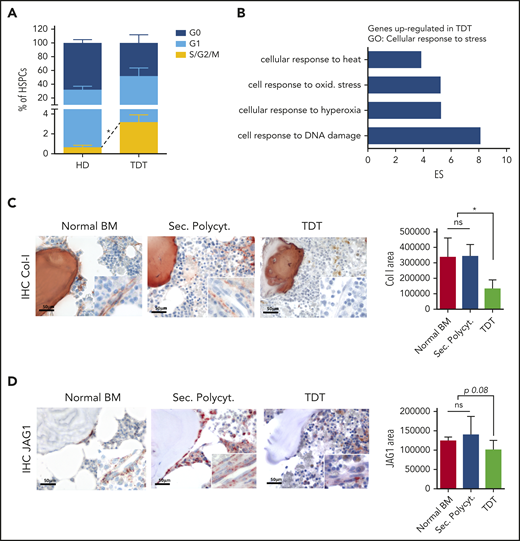
Altered features of HSPCs and BM niche elements in TDT patients. (A) Cell cycle analysis was performed by using Ki67 and 7-AAD staining of CD34+CD38− primitive HSPCs from healthy donors (HD; n = 3) or TDT patients (n = 5). (B) Gene expression profile analysis was performed on CD34+ cells purified from the BM of TDT patients. Functional annotation by Partek software showed that genes could be grouped into a limited number of biological categories. Statistically significant (P < .05) GO categories are reported. In particular, most probe sets upregulated in TDT cells were enriched in response to stress and cell response to DNA damage and oxidative stress. One-way ANOVA was performed. (C-D) Representative images and quantitative IHC evaluation of collagen I deposition and JAG1 in the BM stromal niche of patients with TDT and control biopsies from healthy BM samples and patients affected by secondary polycythemia (Sec. Polycyt.). Original magnification ×400; inset ×630. Normal BM, n = 2; Sec. Polycyt., n = 2; TDT, n = 2. IHC on human BM sections by staining with anti-collagen-I and anti-JAG1 antibodies were performed. *P < .05. ES, enrichment score.
Altered features of HSPCs and BM niche elements in TDT patients. (A) Cell cycle analysis was performed by using Ki67 and 7-AAD staining of CD34+CD38− primitive HSPCs from healthy donors (HD; n = 3) or TDT patients (n = 5). (B) Gene expression profile analysis was performed on CD34+ cells purified from the BM of TDT patients. Functional annotation by Partek software showed that genes could be grouped into a limited number of biological categories. Statistically significant (P < .05) GO categories are reported. In particular, most probe sets upregulated in TDT cells were enriched in response to stress and cell response to DNA damage and oxidative stress. One-way ANOVA was performed. (C-D) Representative images and quantitative IHC evaluation of collagen I deposition and JAG1 in the BM stromal niche of patients with TDT and control biopsies from healthy BM samples and patients affected by secondary polycythemia (Sec. Polycyt.). Original magnification ×400; inset ×630. Normal BM, n = 2; Sec. Polycyt., n = 2; TDT, n = 2. IHC on human BM sections by staining with anti-collagen-I and anti-JAG1 antibodies were performed. *P < .05. ES, enrichment score.
Moreover, we analyzed unique BM bioptic samples from patients and identified signs of a defective BM stromal niche, as observed in the murine model. Quantitative analysis of in situ IHC for collagen-1 and JAG1 expression was suggestive of a less proficient BM stroma in TDT samples, compared with normal BM (ie, uninvolved BM samples from patients with Hodgkin lymphoma at diagnosis) and pathological controls (ie, secondary polycythemia BM samples, as controls for exacerbated erythropoietic activity; Figure 6C-D).
Discussion
In hemoglobinopathies, as β-thalassemia, the interest has been focused mostly on understanding and correcting defective erythropoiesis. However, secondary alterations to the primary hemoglobin defect potentially play a critical role in generating stress conditions affecting primitive progenitors and HSCs. Hematopoiesis can be challenged by different sources of stress, including oxidation, anemia, inflammation, and hypoxia. Both in steady-state and under stress conditions, hematopoiesis and HSC behavior are governed by interactions with the complex local BM microenvironment, defined as "niche".33
In thalassemic th3 mice, HSCs were reduced in number, were more cycling and had a lower capacity for reconstitution after transplantation. The BM stromal niche was defective at the cellular and molecular level. The prolonged nurturing of HSCs by this microenvironment affected their activity and, over time, could have led to a reduced functional stem cell reservoir. After transplantation into a normal environment, th3 HSCs recovered both repopulating capacity and cycling activity. This outcome is reinforced by the concept of reversibility of HSC fate, related to the supportive role of the niche.34
Our evidence of the absence of HSC impairment in th3 newborn mice, when the niche is still normal, endorses the notion of acquired HSC defects during prolonged residence in an altered microenvironment. These results suggest that HSCs in β-thalassemia do not have an intrinsic defect in frequency, cycling activity, and homing, as expected, on the basis of genetic defect, but their behavior is affected by their persistent location in an altered BM microenvironment, which is progressively worsened by the disease.
Our data from reciprocal competitive transplant indicate that in β-thalassemia the stromal BM component has an overriding regulatory role. In patients, osteoporosis and osteopenia are secondary defects with consistent prevalence and morbidity,12 but the mechanism of bone loss is controversial, highlighting a diminished OB function accompanied by comparable or increased OC activity.35 Only 1 report describes bone defect in the th3 strain with a reduced bone turnover.36 In our study, low BMD was caused by reduced OB activity. We can exclude an increased activity of OCs, as the bone-related degradation product CTX-I and RANKL/OPG ratio are similar to that in controls. Our evidence is enforced by results from reciprocal BMT, which demonstrate that the bone defect involves a recipient stroma-derived OB compartment, more than the blood-derived OCs, which originate from transplanted donor cells. The remarkable decrease of OPN in th3 mice is consistent with our data showing increased HSC cycling activity, as this matrix glycoprotein was reported to suppress the proliferation of HSCs and control their homing and engraftment.23,24
The lower bone mass in adult th3 mice is related to the reduced levels of PTH, which have been described also in human pathology.31 We cannot exclude the contribution of other disease-related components, such as iron overload and high levels of serum erythropoietin. Iron toxicity can affect the BM niche37 by directly altering bone microarchitecture or inducing oxidative stress.38 Moreover, high levels of erythropoietin can directly influence the differentiation and mineralization of OB progenitors, resulting in lower bone density.39 Further investigation is needed to understand this effect.
The changes in the BM niche may contribute to an altered support of HSCs through deregulation of the expression of key HSC niche factors. We evaluated Notch signaling, which has been reported to regulate HSC maintenance, suppress myelopoiesis, and promote megakaryocyte and erythroid cell development.40,41 In contrast, other studies have shown the dispensable role of canonical Notch signaling in the function of adult HSCs under physiological conditions.42 Notch receptor and ligand expression has been reported in HSPCs, osteolineage cells, MSCs, and BM endothelial cells7,28,29,41,43,44 . Our evaluation of Notch ligand expression in the th3 BM niche, including Jag1, Jag2, Dll1, Dll3, and Dll4, showed that expression of all those molecules were unaltered, compared with their levels in the WT niche, with the exception of Jag1, which was reduced. Loss of Jag1-induced signaling after OB ablation contributes to loss of HSC quiescence.45 Although other studies have not confirmed an essential role for OBs in HSC maintenance,46,47 recent in vivo imaging results on HSC-niche cross talk highlighted the essential role of bone turnover on HSC localization and function.48 The lower levels of both OPN and JAG1 are consistent with decreased PTH levels in the serum of th3 mice. The PTH axis is a well-defined hormonal system that activates bone remodeling and provides signals for HSC maintenance3,25,26 via its specific receptor expressed by osteolineage cells and MSCs within the BM. Moreover, PTH plays a direct role in MSC fate toward the osteoblastic lineage.49,50 In the current study the activation of PTH signaling in th3 mice rescued bone density, MSC frequency, and expression of OPN and JAG1 by the BM stromal niche. Therapeutic targeting of the HSC niche by PTH stimulation has provided evidence of an effective strategy for stimulating the HSC pool and increasing its engraftment upon transplantation.51 Our results showed that, in β-thalassemia, daily administration of recombinant PTH has an antiosteoporotic effect and rescues the HSC defect by restoring the expression of stemness genes. PTH treatment in th3 mice increased the number of quiescent HSCs and restored the levels of Cdkn1c, which plays an important role in the maintenance of HSCs.32 These data are consistent with those in studies that demonstrated that PTH rescues HSC function through enhanced OPN levels and confirmed the role of OPN as a negative regulator of HSC proliferation.23,24 Conversely, after PTH treatment, NICD levels were modestly elevated and did not parallel the significant increase in JAG1 expression. Thus, we hypothesize that the signaling is close to saturation, probably caused by compensation by the other Notch ligands that are unchanged in th3 mice.
In the complex BM niche scenario, different niche components may have a role in altering th3 HSC function, hypothesizing a multifactorial mechanism in β-thalassemia. We found that the overall levels of other key molecules, such as SCF, CXCL12, and angiopoietin 1, produced by different stromal and hematopoietic niche populations,19,30,52,53 were lower in th3 BM, compared with that of WT controls, and were not affected by PTH administration. Because no difference was present in the MSC population, the defective production could be the effect of differences intrinsic to the hematopoietic parenchyma. Further investigation is needed to elucidate this aspect and identify other potential players.
We simplified a working model, which details the effects of the altered BM stromal niche on HSC function in β-thalassemia (Figure 7). PTH has an overriding role, as demonstrated by our results after PTH administration, without excluding the involvement of additional still unknown cellular and molecular players. In vivo engraftment of cells from th3 donors treated with PTH shows a beneficial rescue of HSC potential, but we cannot exclude the contribution of other niche components.
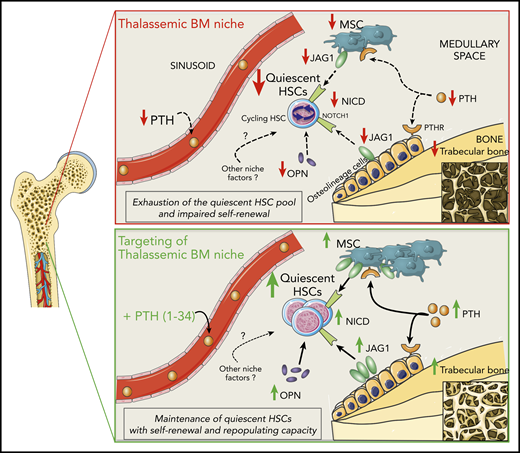
Working model of regulation of HSCs by the BM niche in β-thalassemia and rescue by PTH administration. In β-thalassemia, the lower levels of PTH negatively act via PTH receptors on osteolineage cells and MSCs, resulting in reduced trabecular bone and fewer MSCs. Thalassemic BM stromal cells show lower expression of the Notch-ligand JAG1, which is consistent with the reduced activation of the Notch pathway (activated NICD) in HSCs. Moreover, decreased OPN levels correlate with the increased cycling activity of HSCs, thus affecting their self-renewal capacity and causing the progressive exhaustion of the quiescent HSC pool. In vivo administration of PTH restores thalassemic trabecular bone and MSC frequency, enhancing JAG1 and OPN expression by the BM niche and thus rescuing HSC function.
Working model of regulation of HSCs by the BM niche in β-thalassemia and rescue by PTH administration. In β-thalassemia, the lower levels of PTH negatively act via PTH receptors on osteolineage cells and MSCs, resulting in reduced trabecular bone and fewer MSCs. Thalassemic BM stromal cells show lower expression of the Notch-ligand JAG1, which is consistent with the reduced activation of the Notch pathway (activated NICD) in HSCs. Moreover, decreased OPN levels correlate with the increased cycling activity of HSCs, thus affecting their self-renewal capacity and causing the progressive exhaustion of the quiescent HSC pool. In vivo administration of PTH restores thalassemic trabecular bone and MSC frequency, enhancing JAG1 and OPN expression by the BM niche and thus rescuing HSC function.
Analyses in humans validated our findings in the murine model of the disease. The significantly enhanced cycling activity of primitive HSPCs from thalassemic patients is consistent with their expression profile, highlighting the induction of cellular responses to stress stimuli, in particular to oxidative stress and DNA damage. An altered stromal niche, with lower collagen-1 deposition and JAG1 expression, is also a feature of the human pathology. These results are further supported by our analysis of MSCs derived from patients, which showed evidence of profound defects, compared with those from healthy controls.16 However, specific differences between the murine disease model and human pathology must be considered for a correct data interpretation and extrapolation to the human context. Definitive results require further investigation of a high number of patients, with the possibility of stratifying data according to different factors influencing the clinical status.
Our results point out previously unexplored features of HSPCs and niche components in β-thalassemia and suggest exploring the optimal conditions of the BM niche associated with functional HSCs as key elements for favorable outcomes after HSCT, particularly in the autologous setting of gene therapy.54 In recent thalassemia gene therapy trials, cases of absence of clinical benefit have been reported,55-57 despite the occurrence of early hematopoietic engraftment. Low levels of genetically modified HSPCs in patients with a lack of clinical benefit may suggest impaired HSC function, as well defective supporting activity of niche components. A deep understanding and amelioration of the key mechanisms influencing sustained HSC reconstitution potential will help to improve the outcome for such patients.
Overall, our evidence challenges the paradigm of β-thalassemia as a disorder confined to erythropoiesis, given that the data indicate that whole hematopoiesis is altered as a consequence of effects secondary to the original genetic defect. Moreover, our data emphasize the reversibility of HSC features in stressed conditions and pave the way toward potential combined therapies aimed not only to correct the erythropoietic defect, but also to ameliorate the BM microenvironment and preserve long-term HSC function in β-thalassemia, as well as in other stress conditions associated with dyserythropoiesis.
Gene expression RNA-seq data for this study have been deposited in the European Nucleotide Archive database (accession numbers PRJEB31882 and PRJEB31937). Microarrays of human CD34+ cells are described in Roselli et al (https://www.ebi.ac.uk/arrayexpress/; accession numbers E-MEXP-2757 and E-MEXP-2758).
The online version of this study contains a data supplement.
The publication costs of this article were defrayed in part by page charge payment. Therefore, and solely to indicate this fact, this article is hereby marked “advertisement” in accordance with 18 USC section 1734.
Acknowledgments
The authors thank Clara Camaschella for review of the manuscript; Lev Silberstein for critical discussion of the data; the Flow Cytometry Resource, Advanced Cytometry Technical Applications Laboratory (FRACTAL) at Ospedale San Raffaele for cell sorting; and the University Centre of Statistics in the Biomedical Sciences (CUSSB) at Vita-Salute San Raffaele University for help with the statistical analyses.
This work was supported by Telethon SR-TIGET Core Grant A3 2016 (G.F.), by Associazione Italiana per la Ricerca sul Cancro (AIRC) grant IG15999 (C.T.); Cooley's Anemia Foundation 2018 and 2019 Research Fellowships (A.A.); and a European Hematology Association 2019 Junior Research Grant (A.A.).
Authorship
Contribution: A.A. designed the experimental work, performed the research, analyzed the data, and wrote the paper; A.G., M.P., and C.T. performed the histopathological analysis; M.S. performed the in vivo experiments; I.V. and A.R. performed the peripheral computed tomographic analysis, discussed the data, and contributed to writing the paper; S.B. and I.M. performed bioinformatic analysis on the RNA-seq data; S.M. provided the human thalassemia samples; C.T. discussed the data and contributed to writing and critically reviewing the paper; M.R.L. provided project coordination, contributed to the study design, performed the research, discussed the data, and critically reviewed the paper; G.F. supervised the project, provided coordination, obtained financial support, analyzed the data, and wrote and critically reviewed the paper; and all authors approved the final version of the manuscript.
Conflict-of-interest disclosure: The authors declare no competing financial interests.
Correspondence: Giuliana Ferrari, San Raffaele Scientific Institute, Via Olgettina, 58, Milan, 20132 Italy; e-mail: ferrari.giuliana@hsr.it.

This feature is available to Subscribers Only
Sign In or Create an Account Close Modal