

Key Points
FL-HSCs mainly use oxidative phosphorylation but with normal glycolysis, as indicated by a highly responsive NADH/NAD+ sensor.
FL-HSC activities are tightly regulated by the STAT3/MDH1-mediated malate-aspartate NADH shuttle.

Abstract
The connections between energy metabolism and stemness of hematopoietic stem cells (HSCs) at different developmental stages remain largely unknown. We generated a transgenic mouse line for the genetically encoded NADH/NAD+ sensor (SoNar) and demonstrate that there are 3 distinct fetal liver hematopoietic cell populations according to the ratios of SoNar fluorescence. SoNar-low cells had an enhanced level of mitochondrial respiration but a glycolytic level similar to that of SoNar-high cells. Interestingly, 10% of SoNar-low cells were enriched for 65% of total immunophenotypic fetal liver HSCs (FL-HSCs) and contained approximately fivefold more functional HSCs than their SoNar-high counterparts. SoNar was able to monitor sensitively the dynamic changes of energy metabolism in HSCs both in vitro and in vivo. Mechanistically, STAT3 transactivated MDH1 to sustain the malate-aspartate NADH shuttle activity and HSC self-renewal and differentiation. We reveal an unexpected metabolic program of FL-HSCs and provide a powerful genetic tool for metabolic studies of HSCs or other types of stem cells.
Introduction
Hematopoietic stem cells (HSCs) originate from the aorta-gonad-mesonephros region1 and migrate into the fetal liver (FL) and undergo dramatic expansion,2,3 gradually localizing to and residing in the bone marrow niche after birth.4 HSCs can self-renew to maintain the stem cell pool and generate all downstream progenitors and terminally differentiate into multiple lineages.5,6 Increasing evidence indicates that the metabolic state is tightly connected to HSC activity.7-9 Adult HSCs preferentially undergo glycolysis, rather than oxidative phosphorylation, in the hypoxic niche,7,10,11 which is extensively regulated by several signaling pathways, including HIF1A,12 MYC,13 PDK,14 DLK-GTL2,15 and vitamin A–retinoic acid signaling.16 We have also shown that both murine and human HSCs adopt a glycolytic metabolic profile under certain conditions and that this profile is fine-tuned by MEIS1/PBX1/HOXA9/HIF1A signaling pathways.17-19 Interestingly, recent studies have suggested that adult HSCs also have high mitochondrial mass and enhanced dye efflux but possess limited respiratory and turnover capacity,20 which indicates that mitochondria are likely required for the function of adult HSCs, as evidenced by the fact that FOXO3 serves as a regulator to couple mitochondrial metabolism with HSC homeostasis.21 The metabolic profiles of FL-HSCs and the effects of metabolism on HSC function, however, remain largely unknown.
FL-HSCs undergo rapid division/expansion, conceivably through an increased demand on energy sources compared with that needed by adult HSCs, which are usually maintained in a relatively quiescent state. It is also possible that distinct microenvironments in different hematopoietic organs may affect the metabolism of HSCs. Interestingly, a recent report showed that loss of Rieske iron-sulfur protein, a mitochondrial complex III subunit, impairs the quiescent status of adult HSCs and the differentiation capacity of FL-HSCs.22 FL-HSCs seem to have increased expression levels of many mitochondrial respiration–related genes, although whether metabolic status determines the cell fate of FL-HSCs remains unknown.23 Results from previous studies indicate that mitochondrial activity may play a role in HSCs in the FL stage, although the detailed metabolic profiles and their underlying mechanisms await further investigation.
Because of limitations in the availability of HSCs, most studies related to the nutrient metabolism of HSCs have depended heavily on flow cytometric analysis with MitoTracker dyes, TMRE, and DCFDA to determine mitochondrial mass, membrane potential, and ROS level, respectively. Improved techniques have been used to measure several metabolic features of HSCs, such as oxygen consumption and lactate generation9,24 ; however, these studies may not directly reflect the true extent of glycolysis, oxidative phosphorylation, or other metabolic processes in HSCs. Recent studies have provided interesting evidence showing that it is feasible to perform a metabolomic analysis with fewer than 104 HSCs to explore the metabolic networks of different types of nutrients.25 Nevertheless, it remains difficult to detect all of the metabolites sensitively with a limited number of HSCs using conventional metabolomic analysis. Few tools are available for real-time imaging of metabolic states in live HSCs, either in vitro or in vivo. Therefore, alternative approaches, such as metabolite biosensors, are required for the direct, precise, and real-time detection of subtle changes in nutrient metabolism in HSCs.
Recently, we developed a highly responsive NADH/NAD+ sensor, called SoNar,26 which was designed by inserting cpYFP into the NAD(H)-binding domain of T-Rex. SoNar shows distinct fluorescence responses to NADH and NAD+. Inside the cell under physiological conditions, the total intracellular pool of NAD+ and NADH in the range of hundreds of micromolars27-30 far exceeds the dissociation constants of SoNar for NAD+ (Kd, 5.0 μM) and NADH (Kd, 0.2 μM); thus, the sensor would be occupied by either NAD+ or NADH molecules, and its steady-state fluorescence would report the NAD+/NADH ratio rather than the absolute concentrations of either of the 2 nucleotides according to equilibrium thermodynamics.26 In addition, SoNar fluorescence is intrinsically ratiometric, with 2 excitation wavelengths, and its fluorescence excited at 420 (or 405) and 485 nm shows opposing responses to ligand binding.26,31 This ratiometric property of a sensor is highly desired for quantitative imaging in live cells and in vivo,32,33 because it eliminates the differences in instrumental efficiency, environmental effects, and probe concentration, enabling it to be widely used in different biological samples. The SoNar sensor has a 15-fold (or 1500%) dynamic range, enabling us to measure the cytosolic NAD+/NADH ratio from 0.8 to 2000.26,31,34 Interestingly, SoNar has many desirable properties that make it an ideal sensor; it has a rapid response, high sensitivity, intense fluorescence, and large dynamic range, and it is capable of reporting subtle perturbations in many pathways affecting energy metabolism, including glycolysis and mitochondrial respiration. We generated SoNar transgenic mice and examined the metabolic profiles of FL-HSCs and their contributions/connections to cell fate determinations, as well as the underlying mechanisms governing FL-HSC function.
Methods
Mice
SoNar DNA consists of the sequence of cpYFP, truncated T-Rex (78-211), and the linkers between them.26 Its coding gene (1.2 kbp) is much smaller than those of the first-generation NADH sensors Peredox (2.8 kbp) and Frex35 (1.8 kbp). For transgenic studies, smaller is better for the expression of the sensor in cells and in vivo.31 To generate SoNar transgenic mice, SoNar DNA was cloned into the pCAG vector with chicken β-actin promoter. The targeting construct was linearized, purified, and microinjected into FVB blastocysts. SoNar DNA was randomly incorporated into the genome and determined by polymerase chain reaction (PCR) assay. Messenger RNA (mRNA) and protein expressions of SoNar in different tissues of SoNar mice were further evaluated by both reverse transcription PCR (RT-PCR) and fluorescence microscopy. The resulting chimeric mice were bred with FVB mice to obtain germ line transmission. These mice were next backcrossed with a C57BL/6 CD45.2 background, and germ line transmission was checked by PCR and flow cytometry. Heterozygote transgenic SoNar mice were used for most of the experiments in the current study. C57BL/6 CD45.2 mice were purchased from the Shanghai SLAC Laboratory Animal Co., Ltd. CD45.1 mice were provided by Dr Jiang Zhu at Shanghai Jiao Tong University School of Medicine. All animal experiments were conducted according to the Guidelines for Animal Care at Shanghai Jiao Tong University School of Medicine. All these materials, including SoNar sensor, are available upon request.
In vivo imaging of SoNar transgenic mice
In vivo imaging of SoNar transgenic suckling mice and wild-type (WT) mice was obtained by a Kodak Multispectral FX imaging system (Carestream Molecular Imaging) with excitation filters of 420 and 480 BP 20 nm and an emission filter 535 BP 50 nm (for both excitation wavelengths). The fluorescence photo of SoNar transgenic suckling mice under 40-W 395-nm LED light source illumination was taken by iPhone 8 Plus with an emission >450 nm filter.
Genotyping, mRNA expression, and histology of SoNar transgenic mice
For genotyping SoNar mice, the DNA of peripheral blood cells was extracted using a standard kit (Generay #GK0122), followed by PCR analysis with primers specific for SoNar genomic DNA (supplemental Table 1). For the analysis of SoNar mRNA levels, the RNAs of different tissues from SoNar mice, including skeletal muscle, myocardium, liver, spleen, lung, kidney, bone marrow (BM), brain, intestine, testis, and ovary, were extracted using TRI reagent (Molecular Research Center), followed by RT-PCR (supplemental Table 1). For tissue analysis, SoNar transgenic mice were sequentially perfused with phosphate-buffered saline (PBS) and 4% (weight/volume [vol]) paraformaldehyde diluted in PBS. The tissues (eg, liver, spleen, heart, lung, kidney) were separated, fixed for 24 hours in 4% paraformaldehyde, and then dehydrated by incubation in 30% sucrose (Sigma). The fixed tissues were embedded in optimal cutting temperature compound and quickly frozen with liquid nitrogen. The samples were next sliced into sections (50 μm) by using a Leica CM1950 clinical cryostat. Image stacks were recorded using the Leica TCS SP8 SMD confocal laser scanning microscope system with an HC Plan Apo 40×/0.85 NA objective and super-sensitive HyD hybrid detectors. Hematoxylin and eosin staining was performed in different tissues of 8-week-old WT and SoNar transgenic mice.
Competitive reconstitution assay
All FL hematopoietic cells were isolated from SoNar C57BL/6 embryos at embryonic day (E) 14.5 unless indicated elsewhere. For the primary competitive transplantation with total FL SoNar-high and -low cells, SoNar FL cells were stained with CD45.2-APC antibodies, and CD45.2+ SoNar-high and -low cells were sorted by flow cytometry according to the ratios of SoNar fluorescence with excitation at 405 and 488 nm. One hundred thousand CD45.2+ SoNar-high or -low FL hematopoietic cells were mixed with 2.5 × 10⁵ freshly isolated CD45.1 competitor cells, followed by retroorbital injection into lethally irradiated (10 Gy) CD45.1 mice. For the primary competitive transplantation with SoNar-high and -low FL-HSCs, 20 SoNar-high and -low Lin−Sca-1+c-Kit+CD150+CD48− HSCs together with 3 × 10⁵ CD45.1 competitors were transplanted into lethally irradiated (10 Gy) CD45.1 mice. One million BM cells from primary recipients were further infused into recipient mice for secondary transplantation. For the primary competitive transplantation with adult BM cells, 200 000 CD45.2+ SoNar-high, -middle (mid), or -low BM cells mixed with the same number CD45.1 competitors were transplanted into lethally irradiated (10 Gy) CD45.1 mice. For the limiting dilution analysis, the indicated numbers of CD45.2+ SoNar-high and -low FL hematopoietic cells were injected into lethally irradiated recipients. Mice were defined as reconstituted with transplanted SoNar FL hematopoietic cells if >1% contribution at 16 weeks, and HSC frequencies were calculated using the L-Calc software provided by Stemcell Technologies. In some cases, Lin−Sca-1+c-Kit+CD150+CD48− SoNar-high, -mid, and -low FL-HSCs or adult HSCs were also purified and evaluated for their repopulation abilities. For the function comparison of FL-HSCs in SoNar mice and WT mice, 20 SoNar adult HSCs or WT adult HSCs together with 3 × 10⁵ CD45.1 competitors were transplanted into lethally irradiated (10 Gy) CD45.1 mice. Meanwhile, FL hematopoietic cells were cultured in basic medium (Stemcell Technologies) supplemented with 10 ng/mL of stem cell factor (SCF), 10 ng/mL of thrombopoietin (TPO), and 10 ng/mL of Flt3-L (Peprotech) for cell proliferation comparison.
For the evaluation of MDH1 function in FL-HSCs and adult HSCs or MDH2 in adult HSCs, pMKO.1-shMdh1-GFP, pMKO.1-shMdh2-GFP, or pMKO.1-Scramble-GFP was cotransfected with pCL-ECO packaging plasmids (2:1) into 293T cells, respectively. The resulting virus supernatant was collected for the infection of FL or adult BM Lin− cells, followed by injection into recipients. For aminooxyacetate (AOA) treatment in FL hematopoietic cells, 100 000 CD45.2+ SoNar-high or -low FL hematopoietic cells were harvested 24 h after AOA (0.4 mM) treatment, followed by retroorbital injection into lethally irradiated recipients together with 2.5 × 10⁵ competitor cells. The reconstitution of donor cells in peripheral blood was evaluated at 4, 8, 12, or 16 weeks.
Metabolic imaging and quantification of cytosolic NAD+/NADH ratio in living cells
Freshly isolated CD45.2+ SoNar+ BM cells, FL hematopoietic cells, FL-HSCs, or adult HSCs were seeded onto a 35-mm poly-D-lysine hydrobromide-coated glass-bottom dish (Cellvis) and supplemented with Stemspan serum-free medium (Stemcell Technologies) containing 10 ng/mL of murine SCF and 10 ng/mL of murine TPO (Peprotech), followed by measurement of cytoplasmic NADH/NAD+ levels as detected by the ratios of SoNar fluorescence with excitation at 405 and 488 nm with or without pyruvate (1 mM), oxamate (5 mM), AOA (0.4 mM), or rotenone (5 μM) incubation using a Nikon A1 confocal microscope living cell imaging system. In some cases, CD45.2+ SoNar FL cells were sequentially treated with PBS, pyruvate, and oxamate. Images were captured every minute for a total 15 to 45 minutes, and raw data were analyzed by Image J software. To evaluate the effects of MDH1 or STAT3 on the metabolic status of FL-HSCs, pMKO.1-shMdh1-mCherry, pMKO.1-scramble-mCherry, MSCV-Stat3-IRES-mCherry, or MSCV-IRES-mCherry was used to produce the lentivirus or retrovirus for the infection in SoNar+ FL-HSCs, followed by examination of the ratios of SoNar fluorescence of FL-HSCs with or without AOA (0.4 mM) treatment 72 hours after infection.
For quantification of SoNar sensors, the cytosolic NAD+/NADH ratio was calculated as previously described31 : briefly, NAD+/NADH = Kd(Rmax − R)/(R − Rmin), where, NAD+ is the free concentration of NAD+, and NADH is the free concentration of NADH. Kd represents the ratio of NAD+ and NADH at which the response of the sensor is half-maximal. SoNar has an apparent Kd of 40.
Real-time metabolic imaging in the BM niche
One hundred thousand SoNar FL-HSCs from 20 FLs or SoNar adult HSCs from 25 mice were transplanted into lethally irradiated mice. Mice were euthanized 16 hours after transplantation, and the calvarium was obtained and embedded horizontally in a 35-mm glass-bottom dish with Iscove modified Dulbecco medium containing 2% fetal bovine serum. In some cases, 8- to 10-week-old SoNar transgenic mice were directly used to obtain the calvarium for real-time metabolic imaging. To monitor SoNar responsiveness ex vivo, oxamate (25 mM) or AOA (2 mM) was directly added to the medium, and SoNar fluorescence was captured every 2 minutes for a total of 40 minutes with excitation at 405 or 488 nm. Autofluorescence from bone collagen was used to indicate the bone area. All images were captured by a Nikon A1 confocal system followed with image analysis using Image J software; videos were produced similarly as well.
Flow cytometry
The ratios of SoNar fluorescence were measured in CD45.2+ SoNar-high and -low FL hematopoietic cells with excitation at 405 and 488 nm with or without incubation with oxamate (5 mM), pyruvate (1 mM), rotenone (5 μM), or AOA (0.4 mM). In some cases, SoNar fluorescence ratios were also measured in the repopulated hematopoietic cells in peripheral blood derived from donor SoNar-high and -low FL-HSCs at 8 or 12 weeks posttransplantation. For the analysis of multilineages, SoNar FL hematopoietic cells were stained with anti-mouse CD45.2-PE/Cy5.5, Gr-1-PE, CD3-APC, B220-PE, Ter119-biotin, and streptavidin-APC monoclonal antibodies (eBioscience), followed by flow cytometric analysis. For evaluation of the frequency of immunophenotypic Lin−Sca-1+c-Kit+CD150+CD48− long-term HSCs, SoNar FL cells were incubated with a lineage cocktail (CD3-biotin, B220-biotin, Ter119-biotin, Gr-1-biotiin, CD48-biotin), followed by staining with streptavidin-PE/Cy5.5, Sca-1-PE-Cy7, c-Kit-APC, or CD150-PE. For the measurement of HSC reconstitution, peripheral blood cells of recipient CD45.1 mice were stained with anti-CD45.2-APC and anti-CD45.1-PE antibodies (eBioscience) as well as antibodies for all the related multilienages.
The apoptotic status of SoNar FL hematopoietic cells was determined with anti–annexin V–APC antibodies and 7-AAD (BD Pharmingen) according to the manufacturer’s instructions. For the homing assay, a total of 6 × 10⁶ CD45.2+ SoNar-high and -low FL hematopoietic cells were injected into lethally irradiated mice. SoNar+ cells were measured in the BM, spleen, and liver 16 hours after transplantation by flow cytometric analysis. For the detection of intracellular phosphorylated STAT3 (pSTAT3) level, total CD45.2+ FL hematopoietic cells, long-term HSCs, and SoNar-high and -low HSCs were fixed and permeabilized using a intracellular staining kit (BD), followed by staining with anti-pSTAT3 (Y705) antibodies (CST) for flow cytometric analysis. In other experiment, Stat3-overexpressing SoNar-high FL-HSCs were also subjected to measurement of pSTAT3 level. Cell-cycle status was measured in SoNar-high and -low FL-HSCs (Lin−Sca-1+c-Kit+CD150+CD48−) with Pyronin Y/Hoechst33342 staining, as previously described.36
Ultrahigh-performance LC–qTOF–MS analysis
For metabolite extraction, CD45.2+ SoNar-high and -low FL hematopoietic cells were collected (∼5 × 10⁶ cells per sample) in 2-mL Eppendorf tubes with 1.6 mL of 80% (vol/vol) methanol solution. The sample was then processed by 7 cycles of a 2-minute ultrasonication and 2-minute interval in an ice bath. The cell lysates were kept at 4°C for 1 hour before centrifugation at 14 000 g and 4°C for 15 minutes. The supernatant was evaporated to dryness in a vacuum centrifuge. The extracts were reconstituted with 200 μL of 50% (vol/vol) acetonitrile solution and kept at −20°C for 30 minutes. The extracts were then vortexed for 30 seconds before centrifugation at 12 000 g for 10 minutes at 4°C, and 3 μL of the supernatants were injected into the liquid chromatography (LC)–mass spectrometry (MS) for measurement.
For glycolytic metabolite measurement, LC-MS analyses were performed using an Agilent 1290 Infinity II HPLC/Agilent 6545 Jet Stream electrospray ionization (ESI)–quadruple time-of-flight (qTOF)–MS system. A 5-μL sample was injected for each analysis. The Waters BEH Amide column (2.1 × 100 mm; 1.7 μm) was used for separation at 40°C. Mobile phase A contained 15 mM of ammonium acetate and 0.3% (weight/vol) ammonium hydroxide in water. Mobile phase B was composed of acetonitrile and water (vol/vol, 90:10). The gradient program began with 90% B to 50% B for 8 minutes and held at 50% B for 2 minutes. Negative ionization mode was used for metabolite detection. Gas temperature, gas flow, nebulizer, sheath gas temperature, and sheath gas flow were set at 300°C, 8 L per minute, 45 ψ, 325°C, and 10 L per minute, respectively.
For TCA cycle intermediate metabolite measurement, LC-MS analyses were performed using an Agilent 1290 Infinity II HPLC/Agilent 6545 Jet Stream ESI-qTOF-MS system. A 5-μL sample was injected for each analysis. The ROA-Organic acid H+ column (ROA-Organic acid H+ [8%] column, 150 × 4.6 mm; Phenomenex, Torrance, CA) was used for separation at 40°C. Mobile phase was 0.1% formic acid in water, and the flow rate was 0.25 mL per minute with isocratic separation. Negative ionization mode was used for metabolite detection. Gas temperature, gas flow, nebulizer, sheath gas temperature, and sheath gas flow were set at 285°C, 9 L per minute, 40 ψ, 325°C, and 10 L per minute, respectively.
Microarray and quantitative RT-PCR
Five hundred thousand CD45.2+ SoNar-high and -low FL hematopoietic cells were purified by flow cytometry for the extraction of total RNA, subjected to microarray analysis. A gene ontology enrichment analysis was performed using the Bioconductor package topGo. A Kyoto Encyclopedia of Genes and Genomes pathway enrichment analysis was conducted using the Bioconductor package GSEABase (http://www.r-project.org). For quantitative RT-PCR, first-strand complementary DNA was reverse transcribed using AMV reverse transcriptase (TakaRa) in different cell types as indicated, such as FL-HSCs and adult HSCs. PCR reactions were performed according to the manufacturer’s instruction. In brief, 10-μL reactions with FastStart Universal SYBR Green Master (ROX), primers, and complementary DNA were used for the analysis of mRNA expression levels with the Applied Biosystems 7900HT. The mRNA levels were normalized to the level of β-actin RNA transcripts. The primer sequences are shown in supplemental Table 1.
Metabolic analysis
Oxygen consumption rate (OCR) and extracellular acidification rate were determined in CD45.2+ SoNar-high and -low FL hematopoietic cells with the XF Cell Mito Stress Test Kit (Seahorse #103015-100) and XF Glycolysis Stress Test Kit (Seahorse #103020-100) according to the manufacturer’s instructions using a Seahorse XF96 analyzer. In brief, for the OCR analysis, 3 × 10⁵ SoNar-high and -low FL hematopoietic cells were incubated in the 37°C carbon dioxide–free incubator in 175 μL of assay medium (XF Base Medium with 2 mM of glutamine, 1 mM of pyruvate, and 10 mM of glucose [pH, 7.4]; 37°C); 1.5 μM of oligomycin, 2 μM of FCCP, and 0.5 μM of rotenone/antimycin A were loaded in injection ports A, B, and C, respectively. For the detection of extracellular acidification rate, 3 × 10⁵ CD45.2+ SoNar-high and -low FL hematopoietic cells were incubated in the 37°C carbon dioxide–free incubator in 175 μL of assay medium (XF Base Medium with 1 mM of glutamine [pH, 7.4]; 37°C); 10 mM of glucose, 1.5 μM of oligomycin, and 100 mM of 2-DG were loaded into injection ports A, B, and C, respectively. ATP level was analyzed using the ATP Bioluminescence Assay Kit HS II (Roche) according to the manufacturer’s protocol, and data were normalized to cell count. To analyze the mitochondrial DNA (mtDNA) copy numbers, total genomic DNA was extracted from the indicated cells for comparing the copies of the mitochondrial-specific mt-ND4 gene with those of the nuclear B2m gene. The primer sequences used are shown in supplemental Table 1.
For intracellular and extracellular pyruvate and lactate assays, the extracts were prepared from 5 × 10⁶ CD45.2+ FL hematopoietic cells using 300 μL of ice-cold 0.5-M perchloric acid for each sample. Extracts were centrifuged at 10 000 g for 5 minutes at 4°C, and the supernatant was neutralized with 5 M of KOH and centrifuged at 10 000 g for 5 minutes at 4°C. The supernatant was removed for assay. For the pyruvate assay, 180 μL of assay buffer (100 mM of potassium chloride [pH, 6.7], 1 mM of EDTA, 0.1% bovine serum albumin, 10 μM of flavin adenine dinucleotide, 0.2 mM of thiamine pyrophosphate, 0.5 U of pyruvate oxidase, 0.2 U of horseradish peroxidase, and 50 μM of AmplexRed) was added to a 96-well plate containing 20 μL of the cell extract or medium containing extracellular pyruvate. Changes in fluorescence were measured every 30 seconds for 15 minutes at 37°C by a Synergy 2 Multi-Mode Microplate Reader with an excitation filter of 530 BP 40 nm and emission filter of 590 BP 35 nm at 37°C. Calibration experiments were performed with 20 μL of pyruvate standards (0, 10, 20, 40, 60, 100, and 200 μM per well). For the lactate assay, 180 μL of assay buffer (PBS [pH, 7.4], 0.1% bovine serum albumin, 500 μM of NAD+, 0.5 U of lactate dehydrogenase (LDH), 0.2 U of diaphorase, and 10 μM of resazurin) was added to a 96-well plate containing 20 μL of the cell extract or medium containing extracellular lactate. Changes in fluorescence were measured every 30 seconds for 15 minutes at 37°C by a Synergy 2 Multi-Mode Microplate Reader with an excitation filter of 540 BP 25 nm and emission filter of 590 BP 35 nm at 37°C. Calibration experiments were performed with 20 μL of lactate standards (0, 10, 20, 40, 60, 100, and 200 μM per well). All samples were diluted to fit within the range of the standard curve and run in triplicate. For the evaluation of NADH/NAD+ ratios by a biochemical assay, 1 million SoNar-high and -low FL hematopoietic cells were sorted from E14.5 FLs and subjected to measurement of NADH/NAD+ level using a commercially available NADH/NAD+ assay kit (Sigma #MAK037) according to the manufacturer’s instructions.
Immunoblot analysis
For immunoblot analysis, whole-cell lysates were electrophoresed on 10% sodium dodecyl sulfate-polyacrylamide gels and transferred to nitrocellulose membranes (Millipore). The membranes were incubated with primary antibodies overnight at 4°C, followed by incubation with appropriate horseradish peroxidase–conjugated secondary antibodies. The following primary antibodies were used: anti-MDH1 (Proteintech), anti-STAT3 (CST), anti-pSTAT3 (CST), and anti–β-actin (MBL). To test the effect of STAT3 inhibitor on MDH1 expression, purified Lin−Sca-1+c-Kit+ FL-HSCs and adult HSCs were treated with 10 or 20 μM of STAT3 inhibitor C188-9 (TargetMol) for 24 hours according to the previous study37 and subjected to determination of pSTAT3, STAT3, or MDH1 level by western blot.
Single cell colony forming
The single CD45.2+ SoNar-high or -low FL hematopoietic cell was freshly isolated and plated onto a 35-mm poly-D-lysine hydrobromide-coated glass-bottom dish (Cellvis) and cultured in Stemspan serum-free medium (Stemcell Technologies) containing 10 ng/mL of murine SCF and 10 ng/mL of murine TPO (Peprotech) for 96 hours. The ratios of daughter cells derived from a single parent cell were recorded with excitation at 405 and 488 nm using Nikon A1 confocal microscopy and analyzed with Image J software.
Luciferase reporter assays
The luciferase reporter vector pGL4.27 containing the Mdh1 promoter was constructed to identify transcriptional activation of Mdh1 by STAT3. Indicated doses of pLVX-Stat3 (or negative control vector) plasmid along with pGL4.27-mdh1 promoter vector were cotransfected into 293T cells. Luciferase activities were measured according to the manufacturer’s instructions (Promega #E1910) by using a luciferase reporter system (GloMax Multi Instrument) 24 hours after transfection.
ChIP assays
Chromatin immunoprecipitation (ChIP) assays were performed using the ChIP Assay Kit (Beyotime #P2078). Briefly, 293T cells were overexpressed with pGL4.27-mdh1 promoter vector and STAT3 (with Strep II tag) crosslinked with 1% formaldehyde (Sigma) at 37°C for 10 minutes, and precleared DNA was then used for immunoprecipitation with 4 mL of anti–Strep II antibody (Genescript) or rabbit control immunoglobulin G (CST) at 4°C overnight. For the sample input, 1% of the sonicated pre-cleared DNA was purified at the same time with the precipitated immune complex. The ChIP samples were purified by the Gel and PCR Clean Up Kit (Necleospin). The STAT3-binding sequence was amplified by semiquantitative PCR using primers specific for the Mdh1 promoter region as listed in supplemental Table 1.
Methylation-specific PCR assay
Genomic DNA was extracted from 500 000 CD45.2+ SoNar-high and -low FL hematopoietic cells using a DNA extraction kit (Generay Biotech #GK0122). The promoter methylation status of MDH1 was determined by sodium bisulfate to convert unmethylated (but not methylated) cytosine to uracil, followed by analysis by methylation-specific PCR to amplify specifically either methylated or unmethylated DNA using the Zymoresearch kit (EZ DNA Methylation-Direct Kit D5020) according to the manufacturer’s instruction. The methylation-specific PCR primers are listed in supplemental Table 1.
Statistical analysis
Statistical analysis was performed using GraphPad and SPSS software (version 19.0). Data are represented as mean ± standard error of the mean. n represents the number of independent experiments or the number of cells or mice per group from independent experiments. All experiments were performed independently 3 to 5 times. Data were analyzed with a Student t test (2 tailed), 1-way analysis of variance with Tukey’s multiple comparison test, or 2-way analysis of variance with Sidak’s multiple comparison test according to the experimental design, and statistical significance was set at P < .05.
Results
Establishment of pan-tissue SoNar transgenic mice
To examine metabolic status and its potential relationship to the physiological activity of FL-HSCs in vivo, we first generated a transgenic mouse line expressing SoNar driven by the cytomegalovirus early enhancer/chicken β-actin promoter (Figure 1A-B). Briefly, the pCAG vector carrying SoNar DNA was linearized, purified, and microinjected into fertilized eggs of FVB mice. Random integration of SoNar may result in either single- or multiple-copy transgenes, and transgenic SoNar heterozygote mice were used for most of the experiments in the current study. SoNar mice were further characterized at the DNA and mRNA levels by PCR and quantitative RT-PCR, respectively, the results of which showed that most of the tissues and organs highly expressed the SoNar sensor (Figure 1C-D). SoNar fluorescence was also stably imaged by microscopy in hematopoietic organs (BM, liver, and spleen) and other tested tissues (skeletal muscle, myocardium, lung, and kidney; Figure 1E). No obvious pathological abnormalities were observed in SoNar transgenic mice, as evidenced by hematoxylin and eosin staining, body weight, and overall survival and fertility (supplemental Figure 1A-B; data not shown). More importantly, we also performed competitive transplantation with FL-HSCs from both SoNar mice and WT mice and found that there was no significant difference in the repopulation ability of the FL-HSCs from SoNar mice and WT mice (supplemental Figure 1C-E).
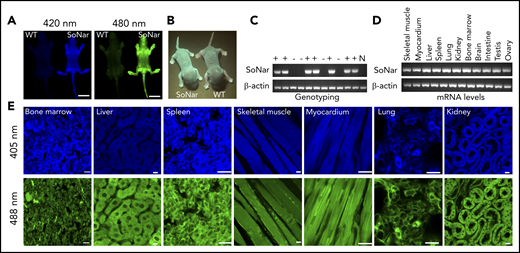
Establishment of pan-tissue SoNar transgenic mice. (A) In vivo fluorescence imaging of neonatal SoNar transgenic mouse and WT mouse excited at 420 and 480 nm. Scale bar, 10 mm. (B) Comparison of the neonatal SoNar transgenic mouse and WT mouse under UV illumination (395 nm). (C) Representative electrophoresis images for the genotype of SoNar transgenic mice. + indicates transgenic mice; − indicates WT littermate transgenic mice; N indicates C57BL/6 WT mice. (D) mRNA levels of SoNar in different tissues/organs from the transgenic mice determined by RT-PCR. (E) SoNar fluorescence was examined in different tissues/organs of either WT or SoNar transgenic mice by confocal microscopy. Scale bar, 10 μm. See also supplemental Figure 1.
Establishment of pan-tissue SoNar transgenic mice. (A) In vivo fluorescence imaging of neonatal SoNar transgenic mouse and WT mouse excited at 420 and 480 nm. Scale bar, 10 mm. (B) Comparison of the neonatal SoNar transgenic mouse and WT mouse under UV illumination (395 nm). (C) Representative electrophoresis images for the genotype of SoNar transgenic mice. + indicates transgenic mice; − indicates WT littermate transgenic mice; N indicates C57BL/6 WT mice. (D) mRNA levels of SoNar in different tissues/organs from the transgenic mice determined by RT-PCR. (E) SoNar fluorescence was examined in different tissues/organs of either WT or SoNar transgenic mice by confocal microscopy. Scale bar, 10 μm. See also supplemental Figure 1.
SoNar indicates metabolically distinct populations of FL hematopoietic cells
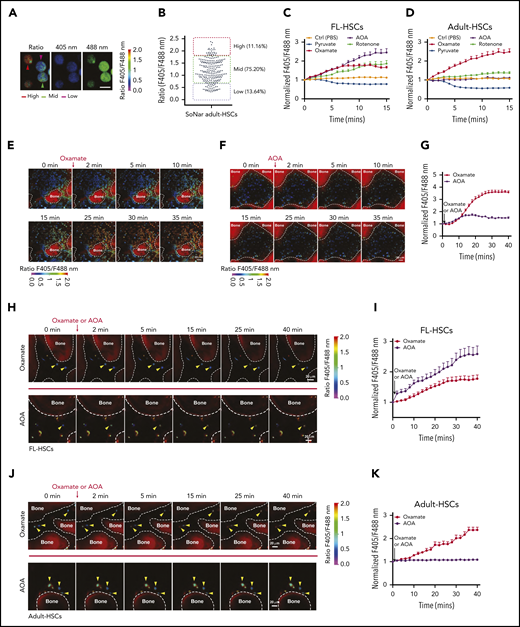
SoNar fluorescence was then extensively characterized in the hematopoietic system. Interestingly, SoNar was expressed in the bulk CD45+ hematopoietic cells from both peripheral blood and BM of adult mice. Signals could be detected in different cell populations by either fluorescence microscopy (supplemental Figure 2A) or flow cytometric analysis (supplemental Figure 2B), as indicated by the ratio of fluorescence intensity measured at excitation set at 405 and 488 nm (reflecting the NADH/NAD+ ratio). We then measured the fluorescence ratio of SoNar emissions in FL hematopoietic cells from mouse E14.5 embryos by microscopy and found that all CD45+ hematopoietic cells expressed different SoNar levels, which were divided into 3 distinct cell populations, defined as SoNar-high (10.3%), SoNar-mid (75.0%), and SoNar-low (14.7%) cells, according to the ratio of SoNar fluorescence (Figure 2A-B). As shown in Figure 2B, the dynamic range of SoNar in FL hematopoietic cells was ∼4 (typically, 0.5-2.0). On the basis of the equation previously described31 and the SoNar fluorescence ratio of the cells, we estimated the cytosolic NAD+/NADH ratio was ∼65 for SoNar-high FL hematopoietic cells and ∼1120 for SoNar-low cells, respectively. These data are consistent with previous reports.31,38,39 The biochemical assay also showed that the NAD+/NADH ratio in SoNar-low cells was several-fold higher than that in SoNar-high cells (supplemental Figure 2C). It should be noted that such an assay measures the total pool of both bound and free nicotinamide adenine dinucleotides.40 In addition, it is not able to differentiate nicotinamide adenine dinucleotides originating from cytosolic or mitochondrial pools. SoNar instead measures the cytosolic free NAD+/NADH ratio, which is a better indicator of cellular redox potential compared with the ratio of total NAD+/NADH.31
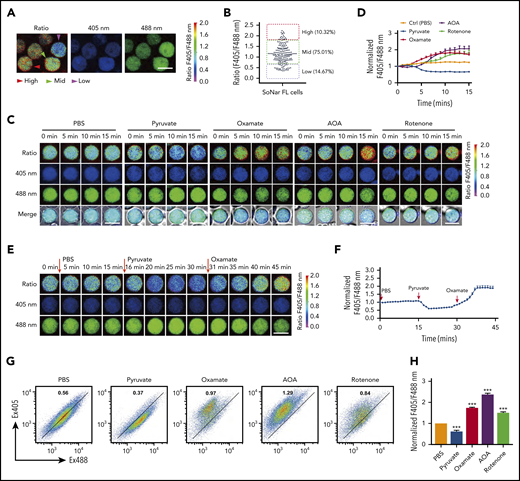
SoNar indicates metabolically distinct populations of FL hematopoietic cells. (A) The ratios of SoNar fluorescence (F405/F488 nm) were determined in CD45+SoNar+ FL hematopoietic cells by confocal microscopy, and representative images are shown. (B) Quantification of the ratios of SoNar fluorescence in panel A (n = 184). SoNar-low (ratio <0.6), SoNar-mid (ratio 0.6-1.8), and SoNar-high cells (ratio >1.8) were defined accordingly. (C) Representative images of the ratios of SoNar fluorescence with excitation at 405 and 488 nm (F405/F488 nm) in CD45+SoNar+ FL hematopoietic cells at indicated time points upon PBS, pyruvate, oxamate, AOA, or rotenone incubation. (D) Quantification of the ratios of SoNar fluorescence in panel C. A total of 25-55 CD45+SoNar+ FL hematopoietic cells were analyzed (n = 3). (E) Representative images of the ratios of SoNar fluorescence in CD45+ SoNar FL hematopoietic cells (E12.5) at indicated time points upon sequential treatments with PBS, pyruvate, and oxamate. (F) Quantification of the ratios of SoNar fluorescence in panel E. A total of 22 SoNar FL hematopoietic cells were analyzed (n = 3). (G) Representative flow cytometric analyses of the changes of the ratios of SoNar fluorescence in CD45+SoNar+ FL hematopoietic cells upon PBS, pyruvate, oxamate, AOA, or rotenone treatment. (H) Quantification of the ratios of SoNar fluorescence in panel G (n = 3). Scale bar, 10 μm. Data are represented as mean ± standard error of the mean. One-way analysis of variance with Tukey’s multiple comparison test was used for the comparison of statistical significance. See also supplemental Figure 2. ***P < .001.
SoNar indicates metabolically distinct populations of FL hematopoietic cells. (A) The ratios of SoNar fluorescence (F405/F488 nm) were determined in CD45+SoNar+ FL hematopoietic cells by confocal microscopy, and representative images are shown. (B) Quantification of the ratios of SoNar fluorescence in panel A (n = 184). SoNar-low (ratio <0.6), SoNar-mid (ratio 0.6-1.8), and SoNar-high cells (ratio >1.8) were defined accordingly. (C) Representative images of the ratios of SoNar fluorescence with excitation at 405 and 488 nm (F405/F488 nm) in CD45+SoNar+ FL hematopoietic cells at indicated time points upon PBS, pyruvate, oxamate, AOA, or rotenone incubation. (D) Quantification of the ratios of SoNar fluorescence in panel C. A total of 25-55 CD45+SoNar+ FL hematopoietic cells were analyzed (n = 3). (E) Representative images of the ratios of SoNar fluorescence in CD45+ SoNar FL hematopoietic cells (E12.5) at indicated time points upon sequential treatments with PBS, pyruvate, and oxamate. (F) Quantification of the ratios of SoNar fluorescence in panel E. A total of 22 SoNar FL hematopoietic cells were analyzed (n = 3). (G) Representative flow cytometric analyses of the changes of the ratios of SoNar fluorescence in CD45+SoNar+ FL hematopoietic cells upon PBS, pyruvate, oxamate, AOA, or rotenone treatment. (H) Quantification of the ratios of SoNar fluorescence in panel G (n = 3). Scale bar, 10 μm. Data are represented as mean ± standard error of the mean. One-way analysis of variance with Tukey’s multiple comparison test was used for the comparison of statistical significance. See also supplemental Figure 2. ***P < .001.
The flow cytometric analysis results further showed that FL hematopoietic cells contained 3 similar populations with different SoNar ratios (supplemental Figure 2D). Although the ratios of fluorescence seemed greatly varied within different types of cells (supplemental Figure 2E), their cellular SoNar mRNA levels were largely similar, as determined by quantitative RT-PCR (supplemental Figure 2F). SoNar-expressing FL hematopoietic cells responded well to conventional metabolic perturbations, such as extraneous pyruvate supplementation, and to the inhibition of key energy metabolism pathways, such as inhibition of LDH (oxamate), mitochondrial NADH shuttle (AOA), and mitochondrial respiration (rotenone; Figure 2C-D). Among these perturbations, pyruvate treatment induced a 1.5-fold decrease in the ratio of SoNar fluorescence measured with excitation at 405 and 488 nm; however, oxamate, AOA, and rotenone stimulation significantly increased the ratio of SoNar fluorescence, ∼1.5- to twofold that in the untreated cells; interestingly, AOA had the strongest effect among these inhibitors (Figure 2D). Sequential treatments with pyruvate and oxamate in the FL hematopoietic cells further revealed that SoNar precisely responded to extracellular metabolic manipulation and might be useful for real-time imaging both in vitro and in vivo (Figure 2E-F; supplemental Video 1).
Alternatively, changes in the ratio of SoNar fluorescence in the FL hematopoietic cells could be sensitively detected by flow cytometric analysis upon pyruvate, oxamate, AOA, or rotenone incubation (Figure 2G). These ex vivo experiments also showed that AOA had the strongest effect in boosting the ratio of SoNar fluorescence (Figure 2H). These results suggest that SoNar is a multitargeted and reliable sensor for monitoring the metabolic state of live FL hematopoietic cells or HSCs. The difference in response to the different metabolic inhibitors of the FL hematopoietic cells also prompted us to investigate their metabolic features and underlying regulatory mechanisms.
SoNar-low FL hematopoietic cells exhibit similar glycolytic activity but enhanced mitochondrial activity compared with those in SoNar-high FL cells
To define the 3 FL hematopoietic cell populations with distinct cytosolic NADH/NAD+ ratios further, we purified SoNar-high and -low FL hematopoietic cells from E14.5 embryos and demonstrated that SoNar-high FL hematopoietic cells had an approximately threefold higher ratio than SoNar-low cells, as determined by either confocal microscopy or flow cytometry (Figure 3A-B; supplemental Figure 3A). The conventional biochemical analysis results consistently showed that SoNar-high FL hematopoietic cells had a much higher intracellular lactate/pyruvate ratio (similar to the NADH/NAD+ level) than SoNar-low cells (supplemental Figure 3B). As expected, exogenous pyruvate decreased the cytosolic NADH/NAD+ ratio in both SoNar-high and -low FL hematopoietic cells, as indicated by SoNar fluorescence ratios (Figure 3C-F; supplemental Figure 3C). In SoNar-high FL hematopoietic cells, the LDH inhibitor (oxamate) was more potent in increasing the NADH/NAD+ ratio than the mitochondrial NADH oxidase inhibition (rotenone), and the malate-aspartate shuttle inhibitor (AOA) had an effect similar to that of rotenone in increasing the NADH/NAD+ ratio (Figure 3C,E; supplemental Figure 3C). In contrast, in SoNar-low FL hematopoietic cells, AOA treatment resulted in as much as a threefold increase in the SoNar fluorescence ratio and was more effective than either rotenone or oxamate (Figure 3D,F; supplemental Figure 3C). This observation suggests that the pathways contributing to the levels of NADH/NAD+ are intrinsically different in these cells, and the malate-aspartate shuttle and glycolysis may be important for SoNar-low and -high cell activity, respectively. Importantly, the intracellular lactate/pyruvate ratios were consistent with the SoNar level in response to pyruvate, oxamate, AOA, or rotenone treatment, as determined by biochemical analysis (supplemental Figure 3D-E).
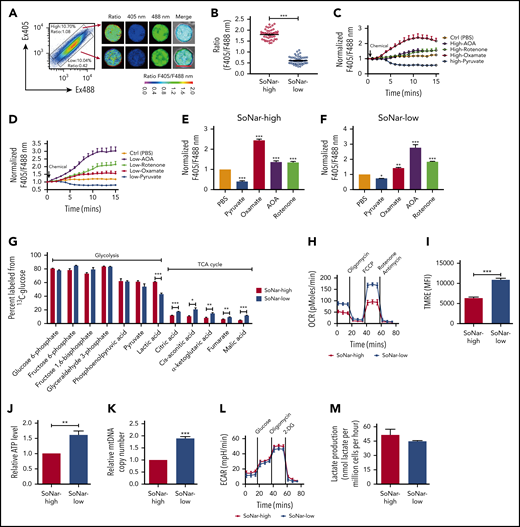
SoNar-low FL hematopoietic cells exhibit similar glycolytic but enhanced mitochondrial activity compared with SoNar-high cells. (A) Fluorescence-activated cell sorting–purified CD45+ SoNar-high and -low FL hematopoietic cells were evaluated for the ratios of SoNar fluorescence with excitation at 405 and 488 nm by confocal microscopy, and representative images are shown. Scale bar, 10 μm. (B) Quantification of the ratios of SoNar fluorescence (F405/F488 nm) in panel A as measured by confocal microscopy. A total of 50 to 60 CD45+ SoNar-high and -low FL hematopoietic cells were analyzed (n = 3). (C-D) CD45+ SoNar-high (C) and -low FL (D) hematopoietic cells were incubated with PBS, pyruvate, oxamate, AOA, or rotenone, followed by the measurement of the ratios of SoNar fluorescence at indicated time points. A total of 20 to 34 CD45+ SoNar-high and -low FL hematopoietic cells were analyzed (n = 3). (E-F) Quantification of the ratios of SoNar fluorescence in CD45+ SoNar-high (E) and -low (F) FL hematopoietic cells upon PBS, pyruvate, oxamate, AOA or rotenone treatment (n = 3). (G) CD45+ SoNar-high and -low FL hematopoietic cells were cultured with carbon 13–labeled glucose for 2 hours, followed by the determination of intermetabolites derived from glycolysis or TCA cycle (n = 3). (H) OCR levels were examined in CD45+ SoNar-high and -low FL hematopoietic cells using a Seahorse XF96 analyzer (n = 3). (I) Quantification of the mean fluorescence intensities (MFIs) of mitochondrial membrane potential in CD45+ SoNar-high and -low FL hematopoietic cells by staining with TMRE probe (n = 5). (J) ATP levels were examined in CD45+ SoNar-high and -low FL hematopoietic cells (n = 3). (K) mtDNA copies were measured in CD45+ SoNar-high and -low FL hematopoietic cells by PCR (n = 3). (L) Plots of the extracellular acidification rate (ECAR) as a parameter of time were examined in CD45+ SoNar-high and -low FL hematopoietic cells using a Seahorse XF96 extracellular flux analyzer (n = 3). (M) Extracellular lactate production was measured in the supernatant of the cultured CD45+ SoNar-high and -low FL hematopoietic cells 1 hour after culture (n = 3). Data are represented as mean ± standard error of the mean. Student 2-tailed unpaired t test (B,I,J,K,M), 1-way analysis of variance (ANOVA) with Tukey’s multiple comparison test (E,F), and 2-way ANOVA with Sidak’s multiple comparison test (G) were used for the comparison of statistical significance. See also supplemental Figure 3. *P < .05, **P < .01, ***P < .001.
SoNar-low FL hematopoietic cells exhibit similar glycolytic but enhanced mitochondrial activity compared with SoNar-high cells. (A) Fluorescence-activated cell sorting–purified CD45+ SoNar-high and -low FL hematopoietic cells were evaluated for the ratios of SoNar fluorescence with excitation at 405 and 488 nm by confocal microscopy, and representative images are shown. Scale bar, 10 μm. (B) Quantification of the ratios of SoNar fluorescence (F405/F488 nm) in panel A as measured by confocal microscopy. A total of 50 to 60 CD45+ SoNar-high and -low FL hematopoietic cells were analyzed (n = 3). (C-D) CD45+ SoNar-high (C) and -low FL (D) hematopoietic cells were incubated with PBS, pyruvate, oxamate, AOA, or rotenone, followed by the measurement of the ratios of SoNar fluorescence at indicated time points. A total of 20 to 34 CD45+ SoNar-high and -low FL hematopoietic cells were analyzed (n = 3). (E-F) Quantification of the ratios of SoNar fluorescence in CD45+ SoNar-high (E) and -low (F) FL hematopoietic cells upon PBS, pyruvate, oxamate, AOA or rotenone treatment (n = 3). (G) CD45+ SoNar-high and -low FL hematopoietic cells were cultured with carbon 13–labeled glucose for 2 hours, followed by the determination of intermetabolites derived from glycolysis or TCA cycle (n = 3). (H) OCR levels were examined in CD45+ SoNar-high and -low FL hematopoietic cells using a Seahorse XF96 analyzer (n = 3). (I) Quantification of the mean fluorescence intensities (MFIs) of mitochondrial membrane potential in CD45+ SoNar-high and -low FL hematopoietic cells by staining with TMRE probe (n = 5). (J) ATP levels were examined in CD45+ SoNar-high and -low FL hematopoietic cells (n = 3). (K) mtDNA copies were measured in CD45+ SoNar-high and -low FL hematopoietic cells by PCR (n = 3). (L) Plots of the extracellular acidification rate (ECAR) as a parameter of time were examined in CD45+ SoNar-high and -low FL hematopoietic cells using a Seahorse XF96 extracellular flux analyzer (n = 3). (M) Extracellular lactate production was measured in the supernatant of the cultured CD45+ SoNar-high and -low FL hematopoietic cells 1 hour after culture (n = 3). Data are represented as mean ± standard error of the mean. Student 2-tailed unpaired t test (B,I,J,K,M), 1-way analysis of variance (ANOVA) with Tukey’s multiple comparison test (E,F), and 2-way ANOVA with Sidak’s multiple comparison test (G) were used for the comparison of statistical significance. See also supplemental Figure 3. *P < .05, **P < .01, ***P < .001.
To evaluate the metabolic status of SoNar-high and -low FL hematopoietic cells further, we performed a metabolic flux analysis induced by glycolysis or oxidative phosphorylation using carbon 13–labeled glucose, and the findings demonstrated that the E14.5 SoNar-low FL hematopoietic cells had a significantly enhanced TCA cycle flux compared with that of SoNar-high FL hematopoietic cells (Figure 3G). More interestingly, the glycolytic level in SoNar-low FL hematopoietic cells was comparable to that in their SoNar-high counterparts (Figure 3G), a finding that counters the general supposition that high mitochondrial activity is typically accompanied by level glycolysis activity. Consistently, SoNar-low FL hematopoietic cells had higher OCRs, mitochondrial membrane potential, and ATP levels than the SoNar-high FL hematopoietic cells (Figure 3H-J; supplemental Figure 3F). A very high mtDNA copy number was also detected in SoNar-low FL hematopoietic cells (Figure 3K). We also observed that the extracellular lactate level was only slightly decreased, as indicated by the extracellular acidification rate (Figure 3L) or absolute lactate level measurement (Figure 3M). Taken together, these unexpected findings suggest that SoNar-low FL hematopoietic cells have enhanced mitochondrial activity, although the demands they place on glycolysis are similar to those of SoNar-high FL hematopoietic cells.
Functional HSCs are enriched in the SoNar-low FL hematopoietic cell population
To determine the cell population in which functional FL-HSCs are enriched, we examined the frequency of immunophenotypic Lin−Sca-1+c-Kit+ CD150+CD48− HSCs in 2 cell fractions and found that there was an approximately sevenfold greater HSC frequency in the E14.5 SoNar-low FL hematopoietic cells than in SoNar-high FL hematopoietic cells (0.21% vs 0.03%; Figure 4A-B). The flow cytometric data also showed that FL-HSCs fell within the 103 or 104 range in the 2-dimensional dot plot of Ex405/Ex488 (supplemental Figure 4A), suggesting that SoNar expression level heterogeneity did not affect the interpretation of NAD+/NADH ratios of these cells (supplemental Figure 4B). SoNar-low FL hematopoietic cells also had a 6.3-fold greater number of immunophenotypic HSCs than SoNar-high FL hematopoietic cells, which represented ∼64.6% of the total number of FL-HSCs (Figure 4C). Although the SoNar-mid fraction was deeply depleted of FL-HSCs (Figure 4A-B), ∼25% of the total number of FL-HSCs resided in the SoNar-mid cell population, because the SoNar-mid fraction made up ∼80% of all the FL cells (Figure 4C). Consistently, 54.3% of the immunophenotypic Lin−Sca-1+c-Kit+CD150+CD48− FL-HSCs had a very low SoNar fluorescence ratio, as determined by microscopy (Figure 4D-E), which is much lower than that of all the FL hematopoietic cells (Figure 4F). Consistently, the flow cytometric analysis results indicated that FL-HSCs existed in a cell population with a relatively low SoNar ratio compared with the ratio of all the FL hematopoietic cells (Figure 4G; supplemental Figure 4C). These data suggest that FL-HSCs may depend mainly on mitochondrial respiration. To confirm this supposition, the metabolic status of the Lin−Sca-1+c-Kit+CD150+CD48− FL-HSCs and that of the total FL hematopoietic cells were compared. Consistently, FL-HSCs had a much higher number of ATP and mtDNA copies than the FL hematopoietic cells in total (Figure 4H-I).
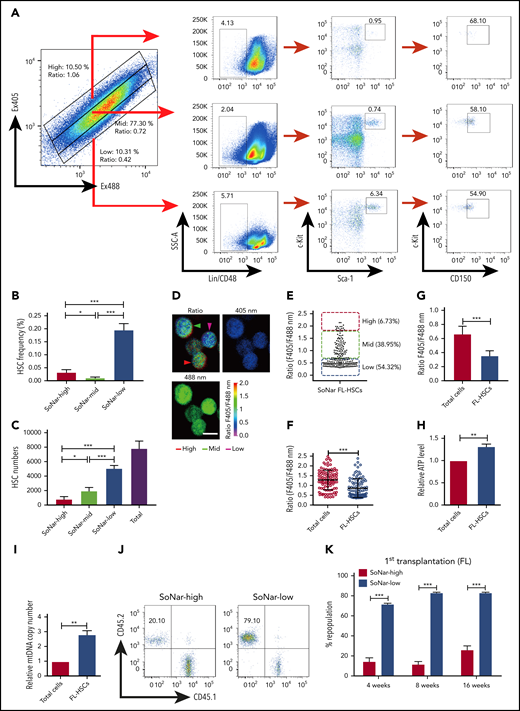
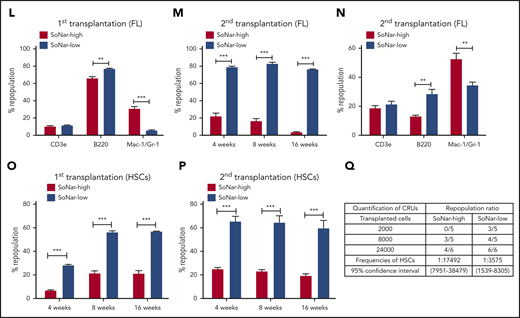
Functional HSCs are enriched in SoNar-low FL hematopoietic cells. (A-B) Representative flow cytometric analyses (A) and quantification (B) of frequencies of long-term HSCs (Lin−Sca-1+c-Kit+CD150+CD48−) in SoNar-high, -mid, and -low FL hematopoietic cells (n = 5). (C) Cell numbers of immunophenotypic HSCs were counted in SoNar-high, -mid, and -low and total FL hematopoietic cells (n = 5). (D-E) Representative images of the ratios of SoNar fluorescence of FL-HSCs (D); a total of 208 FL-HSCs were examined, and quantitative data are shown (E; n = 3). Scale bar, 10 μm. (F) Quantification of the ratios of SoNar fluorescence (F405/F488 nm) in total FL hematopoietic cells and FL-HSCs as measured by flow cytometric analysis (n = 3). (G) Quantification of ratios of SoNar fluorescence (F405/F488 nm) in total CD45+ FL hematopoietic cells and FL-HSCs (n = 5). (H-I) ATP levels and mtDNA copies were examined in total CD45+ FL hematopoietic cells and FL-HSCs, respectively (n = 3). (J) Representative flow cytometric plots of the frequencies of repopulated cells in the peripheral blood of recipients transplanted with CD45+ SoNar-high or -low FL donor cells (CD45.2) or competitive cells (CD45.1). (K) Repopulated donor cells were analyzed in recipients transplanted with CD45+ SoNar-high or -low FL donor cells at 4, 8, and 16 weeks posttransplantation (n = 5). (L) Multilineage contribution of donor cells in the primary recipients at 16 weeks posttransplantation in panel K (n = 5). (M) Secondary transplantation was performed with donor BM cells of primary recipients in panel L. Percentages of repopulated cells were analyzed at 4, 8, and 16 weeks posttransplantation (n = 5). (N) Multilineage contribution of donor cells in the secondary recipients at 16 weeks posttransplantation (n = 5). Repopulated donor cells were analyzed in recipients transplanted with CD45+ SoNar-high or -low FL donor cells at 4, 8, and 16 weeks posttransplantation (n = 5). (O-P) Repopulated donor cells were analyzed in recipients transplanted with SoNar-high or -low FL-HSCs cells at 4, 8, and 16 weeks after either primary (O) or secondary transplantation (P; n = 5). (Q) Different cell numbers of CD45+ SoNar-high and -low FL donor cells were injected into lethally irradiated recipients, and the competitive repopulating units (CRUs) were determined using L-Calc software. Data are represented as mean ± standard error of the mean. Student 2-tailed unpaired t test (G-I), 1-way analysis of variance (ANOVA) with Tukey’s multiple comparison test (B-C), and 2-way ANOVA with Sidak’s multiple comparison test (K-P) were used for the comparison of statistical significance. See also supplemental Figure 4. *P < .05, **P < .01, ***P < .001.
Functional HSCs are enriched in SoNar-low FL hematopoietic cells. (A-B) Representative flow cytometric analyses (A) and quantification (B) of frequencies of long-term HSCs (Lin−Sca-1+c-Kit+CD150+CD48−) in SoNar-high, -mid, and -low FL hematopoietic cells (n = 5). (C) Cell numbers of immunophenotypic HSCs were counted in SoNar-high, -mid, and -low and total FL hematopoietic cells (n = 5). (D-E) Representative images of the ratios of SoNar fluorescence of FL-HSCs (D); a total of 208 FL-HSCs were examined, and quantitative data are shown (E; n = 3). Scale bar, 10 μm. (F) Quantification of the ratios of SoNar fluorescence (F405/F488 nm) in total FL hematopoietic cells and FL-HSCs as measured by flow cytometric analysis (n = 3). (G) Quantification of ratios of SoNar fluorescence (F405/F488 nm) in total CD45+ FL hematopoietic cells and FL-HSCs (n = 5). (H-I) ATP levels and mtDNA copies were examined in total CD45+ FL hematopoietic cells and FL-HSCs, respectively (n = 3). (J) Representative flow cytometric plots of the frequencies of repopulated cells in the peripheral blood of recipients transplanted with CD45+ SoNar-high or -low FL donor cells (CD45.2) or competitive cells (CD45.1). (K) Repopulated donor cells were analyzed in recipients transplanted with CD45+ SoNar-high or -low FL donor cells at 4, 8, and 16 weeks posttransplantation (n = 5). (L) Multilineage contribution of donor cells in the primary recipients at 16 weeks posttransplantation in panel K (n = 5). (M) Secondary transplantation was performed with donor BM cells of primary recipients in panel L. Percentages of repopulated cells were analyzed at 4, 8, and 16 weeks posttransplantation (n = 5). (N) Multilineage contribution of donor cells in the secondary recipients at 16 weeks posttransplantation (n = 5). Repopulated donor cells were analyzed in recipients transplanted with CD45+ SoNar-high or -low FL donor cells at 4, 8, and 16 weeks posttransplantation (n = 5). (O-P) Repopulated donor cells were analyzed in recipients transplanted with SoNar-high or -low FL-HSCs cells at 4, 8, and 16 weeks after either primary (O) or secondary transplantation (P; n = 5). (Q) Different cell numbers of CD45+ SoNar-high and -low FL donor cells were injected into lethally irradiated recipients, and the competitive repopulating units (CRUs) were determined using L-Calc software. Data are represented as mean ± standard error of the mean. Student 2-tailed unpaired t test (G-I), 1-way analysis of variance (ANOVA) with Tukey’s multiple comparison test (B-C), and 2-way ANOVA with Sidak’s multiple comparison test (K-P) were used for the comparison of statistical significance. See also supplemental Figure 4. *P < .05, **P < .01, ***P < .001.
By using an in vitro functional colony-forming assay, we also demonstrated that SoNar-low FL hematopoietic cells contained more primitive hematopoietic progenitors, as evidenced by the fact that SoNar-low FL hematopoietic cells produced more colonies, including colony-forming unit (CFU) granulocyte, erythroid, macrophage, and megakaryocyte; CFU granulocyte macrophage; and CFU erythroid colonies, than SoNar-high FL hematopoietic cells (supplemental Figure 4D). SoNar-low FL hematopoietic cells contained a much higher percentage of B220+ B cells than were found in SoNar-high FL hematopoietic cells (38.1% vs 2.2%) but a lower frequency of Gr-1+ myeloid cells (12.3% vs 49.3%; supplemental Figure 4E-F), indicating that metabolic status may also regulate HSC differentiation capacity. We then cultured single SoNar-high and -low FL hematopoietic cells to evaluate their proliferation capacity in vitro and found that SoNar-low FL hematopoietic cells grew much faster and formed larger colonies than SoNar-high FL hematopoietic cells (supplemental Figure 4G-H). Moreover, the larger colonies derived from SoNar-low FL hematopoietic cells had a much lower ratio of SoNar fluorescence than those consisting of SoNar-high FL hematopoietic cells (supplemental Figure 4I).
More interestingly, the results from subsequent competitive BM transplantation experiments revealed that E14.5 SoNar-low FL hematopoietic cells had an approximately threefold higher repopulation rate than their SoNar-high FL counterparts (82.5% vs 25.5% at 16 weeks posttransplantation; Figure 4J-K). The lineage analysis in these repopulated cells showed that SoNar-low FL hematopoietic cells tended to generate more B cells than myeloid cells (Figure 4L; supplemental Figure 4J). We performed secondary transplantation with the primary repopulated donor cells to evaluate altered self-renewal capacity. The frequency of the repopulated cells derived from SoNar-low donor cells was 25-fold higher than that of the controls upon secondary transplantation (76.1% vs 3.1% at 16 weeks posttransplantation; Figure 4M), with changes in lineages similar to those observed after primary transplantation (Figure 4N). To further evaluate whether SoNar level can indicate HSC activity level, we isolated SoNar-high and -low cell populations from immunophenotypic Lin−Sca-1+c-Kit+CD150+CD48− E14.5 FL-HSCs (Figure 4D-E) and performed competitive BM transplantation. Consistently, SoNar-low FL-HSCs contributed many more donor cells than SoNar-high cells during both the first and second transplantations (Figure 4O-P; supplemental Figure 4K-L). Intriguingly, the SoNar ratio of the repopulated hematopoietic cells from SoNar-low FL-HSCs was still a little lower than that of SoNar-high FL-HSCs, indicating that SoNar-low FL-HSCs may generate at least some SoNar-high cells (supplemental Figure 4M-N). These results also indicate that SoNar-low FL-HSCs may have a higher place than SoNar-high FL-HSCs in the hierarchy. Although our repopulation data indicate it may be not reversible between SoNar-low and -high FL-HSCs, we noticed that there was 1 population of SoNar-high cells that may have been derived from SoNar-low FL-HSCs that had reverted because of their heterogeneity.
Interestingly, functional HSCs were relatively rare in SoNar-mid populations, as evidenced by the similarity between the donor contribution in the reconstituted recipient mice and that in the SoNar-high FL population (supplemental Figure 4O-Q). The exact frequency of functional FL-HSCs was determined by a limiting dilution assay with multiple doses of SoNar-high and -low FL hematopoietic cells, which showed that there was an approximately fivefold greater number of functional FL-HSCs in the SoNar-low FL hematopoietic cell population than in the SoNar-high FL hematopoietic cell population (1 in 3575 vs 1 in 17 492; Figure 4Q). SoNar-low FL-HSCs had cell frequencies in G0, G1, and SG2M phases similar to those of SoNar-high FL-HSCs (supplemental Figure 4R-S), indicating that cell-cycle status may not contribute to the increased reconstitution capacities of SoNar-low FL-HSCs. In addition, we found that the enhanced repopulating ability of SoNar-low FL hematopoietic cells might not be due to changes in homing ability (supplemental Figure 4T) or apoptotic status (supplemental Figure 4U-V).
FL-HSCs and adult HSCs respond differently to NADH shuttle inhibition in the BM niche
Results from previous work have shown that adult HSCs mainly use glycolysis to generate energy, as evaluated by MitoTracker staining and functional analyses results.17 To validate the metabolic status of the adult HSCs by the SoNar sensor, we analyzed the HSC frequencies in different cell populations according to their ratios of SoNar fluorescence. Interestingly, most immunophenotypic Lin−Sca-1+c-Kit+CD150+CD48− adult HSCs were in the SoNar-mid cell population, as determined by flow cytometric analysis (supplemental Figure 5A-C). Because high SoNar ratios may represent greater glycolysis, as evidenced by a related biochemical analysis (Figure 3) and our previous study,41 these results indicate that adult HSCs may have a metabolic profile that differs from that of FL-HSCs. In addition, differentiated BM cells displayed a multilineage pattern that differed from that presented by the FL hematopoietic cells (supplemental Figure 5D). SoNar-mid adult BM cells generated ∼10- and sevenfold increases in repopulated cells compared with those observed in SoNar-low and -high control cells, respectively (supplemental Figure 5E). Repopulated SoNar-mid cells also showed a trend toward an increased B220+ cell population but a decreased Mac-1+/Gr-1+ myeloid cell population (supplemental Figure 5F).
To understand the metabolic characterization of FL-HSCs and adult HSCs further, we analyzed the distribution of SoNar fluorescence ratios in both the immunophenotypic Lin−Sca-1+c-Kit+CD150+CD48− FL-HSCs and adult HSCs. Although >50% of the FL-HSCs had a very low SoNar fluorescence ratio (Figure 4D-E), 75.2% of the adult HSCs had a mid-range SoNar fluorescence ratio (Figure 5A-B), a finding that was consistent with findings from the flow cytometric analysis (Figure 4A-B,F-G; supplemental Figure 5A-B). An increase in the overall ratio of SoNar fluorescence, as high as 2.5-fold, was detected in SoNar FL-HSCs upon AOA treatment, and this level was much greater than that after incubation with other agents, including rotenone (1.8-fold), pyruvate (1.3-fold), and oxamate (1.8-fold; Figure 5C). In contrast, the highest increase in the overall ratio of SoNar fluorescence in SoNar adult HSCs was observed upon oxamate treatment (Figure 5D). Consistently, rotenone effects on the increase in the ratio of SoNar fluorescence were similar to those of oxamate in FL-HSCs (Figure 5C) but were not similar to those of the adult HSCs (Figure 5D). Functionally, the in vivo transplantation data also showed that E14.5 SoNar-low FL-HSCs generated the highest percentage of repopulated cells among SoNar-high, -mid, and -low FL-HSCs, whereas SoNar-mid FL-HSCs had a donor contribution similar to that of SoNar-high cells (supplemental Figure 5G). In contrast, SoNar-mid adult HSCs had the highest repopulation ability among SoNar-high, -mid, and -low adult HSCs, whereas SoNar-high adult HSCs had a contribution similar to that of SoNar-low adult HSCs (supplemental Figure 5H).
FL-HSCs respond differently to AOA stimulation in the BM niche compared with adult HSCs. (A-B) Representative images of the ratios of SoNar fluorescence of BM adult HSCs (A); a total of 242 adult HSCs were examined, and quantitative data are shown (B; n = 3). Scale bar, 10 μm. (C-D) Dynamic changes of the ratios of SoNar fluorescence in FL-HSCs and adult HSCs at indicated time points upon metabolic stimulations. A total of 25 to 30 FL-HSCs (C) or adult HSCs (D) were examined (n = 3). (E-G) Representative images of the ratios of SoNar fluorescence of total BM cells in the cranium at indicated time points upon oxamate (E) or AOA (F) incubation; a total of 30 SoNar BM cells were examined, and quantitative data are shown (G; n = 3). (H-I) Representative images of the changes of the ratios of SoNar fluorescence upon oxamate or AOA incubation in the cranium of recipients receiving FL-HSCs (yellow arrowheads) 16 hours after transplantation (H); a total of 20 to 22 SoNar FL-HSCs were examined, and quantitative data are shown (I; n = 3). (J-K) Representative images of the changes of the ratios of SoNar fluorescence upon oxamate or AOA incubation in the cranium of recipients receiving adult HSCs (yellow arrowheads) 16 hours after transplantation (J); a total of 22 to 24 SoNar adult HSCs were examined, and quantitative data are shown (K; n = 3). Data are represented as mean ± standard error of the mean. Scale bar, 20 μm. See also supplemental Figure 5.
FL-HSCs respond differently to AOA stimulation in the BM niche compared with adult HSCs. (A-B) Representative images of the ratios of SoNar fluorescence of BM adult HSCs (A); a total of 242 adult HSCs were examined, and quantitative data are shown (B; n = 3). Scale bar, 10 μm. (C-D) Dynamic changes of the ratios of SoNar fluorescence in FL-HSCs and adult HSCs at indicated time points upon metabolic stimulations. A total of 25 to 30 FL-HSCs (C) or adult HSCs (D) were examined (n = 3). (E-G) Representative images of the ratios of SoNar fluorescence of total BM cells in the cranium at indicated time points upon oxamate (E) or AOA (F) incubation; a total of 30 SoNar BM cells were examined, and quantitative data are shown (G; n = 3). (H-I) Representative images of the changes of the ratios of SoNar fluorescence upon oxamate or AOA incubation in the cranium of recipients receiving FL-HSCs (yellow arrowheads) 16 hours after transplantation (H); a total of 20 to 22 SoNar FL-HSCs were examined, and quantitative data are shown (I; n = 3). (J-K) Representative images of the changes of the ratios of SoNar fluorescence upon oxamate or AOA incubation in the cranium of recipients receiving adult HSCs (yellow arrowheads) 16 hours after transplantation (J); a total of 22 to 24 SoNar adult HSCs were examined, and quantitative data are shown (K; n = 3). Data are represented as mean ± standard error of the mean. Scale bar, 20 μm. See also supplemental Figure 5.
To test whether the FL-HSCs responded differently to metabolic stimulation than the adult HSCs in vivo, we developed a useful method for the real-time imaging of SoNar ratios in mouse cranium, which may be used to mimic the exact in vivo treatment of IV injected AOA or oxamate. As shown in Figure 5E-F and supplemental Videos 2 and 3, using transgenic SoNar mice, we easily monitored the changes in the ratios of SoNar fluorescence in different types of hematopoietic cells within the cranial BM upon oxamate or AOA treatment (Figure 5E-G). We then injected purified 100 000 immunophenotypic Lin−Sca-1+c-Kit+CD150+CD48− E14.5 FL-HSCs and adult HSCs into lethally irradiated mice and scrutinized the dynamics of the ratios of SoNar fluorescence 16 hours after transplantation. Strikingly, we observed that FL-HSCs mainly responded to AOA stimulation, as evidenced by the 2.6-fold increase in the ratio of SoNar fluorescence after AOA treatment compared with a 1.5-fold increase in the SoNar ratio upon oxamate stimulation (Figure 5H-I; supplemental Videos 4 and 5). In contrast, adult HSCs had ∼2.3-fold increase in the ratio of SoNar fluorescence after oxamate treatment but a negligible response to AOA treatment (Figure 5J-K; supplemental Videos 6 and 7). Although some of the transplanted HSCs may differentiate into progenitor cells within 16 hours, these results provide direct evidence that FL-HSCs may respond differently than adult HSCs to metabolic modulation in vivo.
MDH1 enhances the malate-aspartate NADH shuttle and decreases the NADH/NAD+ redox state in SoNar-low FL-HSCs
To understand the underlying mechanisms related to the metabolic program of FL-HSCs, we performed a microarray analysis with E14.5 SoNar-high and -low FL hematopoietic cells. Gene ontology analysis revealed that multiple metabolically related biological processes were significantly upregulated in SoNar-low FL hematopoietic cells (Figure 6A). Consistently, Kyoto Encyclopedia of Genes and Genomes analysis showed that the oxidative phosphorylation pathway was dramatically upregulated in SoNar-low FL hematopoietic cells (Figure 6B). We also examined the potential downstream candidates related to glycolysis (Glut1-4, Hk1, Pfkl, Pfkm, Gapdh, Pkm2, and Ldha), the malate-aspartate shuttle (Mdh1 and Mdh2), oxidative phosphorylation (Pdhx, Idh1, Idh2, Idh3, Aco2, Fh1, Cox18, Cox6b1, Ndufb5, Atp5o, and Atp5l), the pentose phosphate pathway (G6pd and Pgd), and glutamine and serine metabolism (Gls, Gdh, and Phgdh) using quantitative RT-PCR. Interestingly, several genes important for malate-aspartate shuttle function and oxidative phosphorylation were notably upregulated in the SoNar-low cell population (Figure 6C). In contrast, most regulators critical for glycolysis were not changed in SoNar-low cells except for Glut2, a finding consistent with those from the biochemical analysis (Figure 3G,L-M). Together with evidence from the in vitro biochemical analysis (Figure 3) and in vivo functional repopulation assay (Figure 4), these results suggest that FL-HSCs may depend on both an enhanced malate-aspartate shuttle and mitochondrial oxidation to meet their energy requirements and that they simultaneously sustain levels of glycolysis that are similar to those maintained by the differentiated bulk cells to satisfy their energy needs during expansion in the FL stage.
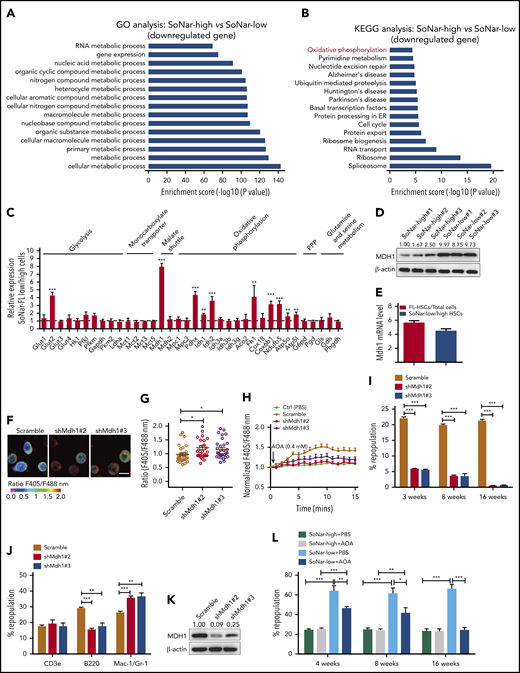
MDH1 enhances the malate-aspartate NADH shuttle and decreases NADH/NAD+ level in SoNar-low FL-HSCs. (A-B) Gene ontology (GO; biological process; A) and Kyoto Encyclopedia of Genes and Genomes (KEGG; pathway; B) analyses of the microarray data of CD45+ SoNar-high vs -low FL hematopoietic cells. Candidate changes (downregulated genes) are highlighted in red. (C) Potential candidates related to glycolysis, monocarboxylate transporter, malate-aspartate shuttle, oxidative phosphorylation, pentose phosphate pathway (PPP), and glutamine and serine metabolism were evaluated in CD45+ SoNar-high vs -low FL hematopoietic cells by quantitative RT-PCR (n = 3). (D) Protein levels of MDH1 in CD45+ SoNar-high and -low FL hematopoietic cells were measured by immunoblotting (n = 3). Ratio of MDH1/actin was quantified and normalized against SoNar-high#1 cells. (E) Mdh1 expression levels in total CD45+ FL hematopoietic cells, FL-HSCs, SoNar-high FL-HSCs, and SoNar-low FL-HSCs were determined by quantitative RT-PCR (n = 3). (F) Representative images for the ratios of SoNar fluorescence of Mdh1-knockdown and scrambled SoNar 32D cells. (G) Quantification of the ratios of SoNar in panel F. A total of 30 SoNar 32D cells were analyzed (n = 3). (H) Quantification of the ratios of SoNar fluorescence in SoNar 32D cells at indicated time points upon AOA incubation. A total of 22 to 25 SoNar 32D cells were analyzed (n = 3). (I) Mdh1 was silenced in CD45+ FL hematopoietic cells by short-hairpin RNA (shRNA) targeting Mdh1 (shMdh1#2 or shMdh1#3) followed by transplantation into recipients. The repopulation was analyzed at 4, 8, and 16 weeks posttransplantation (n = 5). (J-K) Multilineage contribution of donor cells in the recipients at 16 weeks posttransplantation (J; n = 5). MDH1 levels were measured in BM cells of recipients by immunoblotting (K). Ratio of MDH1/actin was quantified and normalized against scrambled cells. (L) CD45+ SoNar-high and -low FL hematopoietic cells were treated with AOA for 24 hours, followed by transplantation into recipients (n = 5). Repopulation was analyzed at 4, 8, and 16 weeks posttransplantation. Scale bar, 10 μm. Data are represented as mean ± standard error of the mean. One-way analysis of variance (ANOVA) with Tukey’s multiple comparison test (C,G) and 2-way ANOVA with Sidak’s multiple comparison test (I-J,L) were used for the comparison. See also supplemental Figure 6. *P < .05, **P < .01, ***P < .001. ER, endoplasmic reticulum.
MDH1 enhances the malate-aspartate NADH shuttle and decreases NADH/NAD+ level in SoNar-low FL-HSCs. (A-B) Gene ontology (GO; biological process; A) and Kyoto Encyclopedia of Genes and Genomes (KEGG; pathway; B) analyses of the microarray data of CD45+ SoNar-high vs -low FL hematopoietic cells. Candidate changes (downregulated genes) are highlighted in red. (C) Potential candidates related to glycolysis, monocarboxylate transporter, malate-aspartate shuttle, oxidative phosphorylation, pentose phosphate pathway (PPP), and glutamine and serine metabolism were evaluated in CD45+ SoNar-high vs -low FL hematopoietic cells by quantitative RT-PCR (n = 3). (D) Protein levels of MDH1 in CD45+ SoNar-high and -low FL hematopoietic cells were measured by immunoblotting (n = 3). Ratio of MDH1/actin was quantified and normalized against SoNar-high#1 cells. (E) Mdh1 expression levels in total CD45+ FL hematopoietic cells, FL-HSCs, SoNar-high FL-HSCs, and SoNar-low FL-HSCs were determined by quantitative RT-PCR (n = 3). (F) Representative images for the ratios of SoNar fluorescence of Mdh1-knockdown and scrambled SoNar 32D cells. (G) Quantification of the ratios of SoNar in panel F. A total of 30 SoNar 32D cells were analyzed (n = 3). (H) Quantification of the ratios of SoNar fluorescence in SoNar 32D cells at indicated time points upon AOA incubation. A total of 22 to 25 SoNar 32D cells were analyzed (n = 3). (I) Mdh1 was silenced in CD45+ FL hematopoietic cells by short-hairpin RNA (shRNA) targeting Mdh1 (shMdh1#2 or shMdh1#3) followed by transplantation into recipients. The repopulation was analyzed at 4, 8, and 16 weeks posttransplantation (n = 5). (J-K) Multilineage contribution of donor cells in the recipients at 16 weeks posttransplantation (J; n = 5). MDH1 levels were measured in BM cells of recipients by immunoblotting (K). Ratio of MDH1/actin was quantified and normalized against scrambled cells. (L) CD45+ SoNar-high and -low FL hematopoietic cells were treated with AOA for 24 hours, followed by transplantation into recipients (n = 5). Repopulation was analyzed at 4, 8, and 16 weeks posttransplantation. Scale bar, 10 μm. Data are represented as mean ± standard error of the mean. One-way analysis of variance (ANOVA) with Tukey’s multiple comparison test (C,G) and 2-way ANOVA with Sidak’s multiple comparison test (I-J,L) were used for the comparison. See also supplemental Figure 6. *P < .05, **P < .01, ***P < .001. ER, endoplasmic reticulum.
Consistently, a much higher level of MDH1 protein was observed in SoNar-low FL hematopoietic cells than in SoNar-high FL hematopoietic cells (Figure 6D). Moreover, FL-HSCs and SoNar-low FL-HSCs had much higher levels of Mdh1 mRNA expression than total FL hematopoietic cells and SoNar-high FL-HSCs, respectively (Figure 6E). MDH1 is a key enzyme involved in the malate-aspartate shuttle, which enhances the transport of NADH from the cytoplasm into mitochondria, where it accesses the electron transport chain.42,43 We speculate, therefore, that MDH1 may serve as 1 of the main regulators of the metabolic program in the SoNar-low population. To test this hypothesis, we generated Mdh1-knockdown 32D cells (a murine myeloid progenitor cell line) using short hairpin RNA (supplemental Figure 6A). These Mdh1-knockdown 32D cells had a significantly increased ratio of SoNar fluorescence (Figure 6F-G) and a reduced sensitivity level to AOA inhibition than scrambled controls (Figure 6H). Consistently, knockdown of Mdh1 in FL-HSCs also led to an increase in the SoNar ratio (supplemental Figure 6B-C). In addition, Mdh1-knockdown FL-HSCs had lower sensitivity to AOA treatment compared with their counterparts (supplemental Figure 6D).
To evaluate the function of MDH1 in FL-HSCs further, Mdh1-knockdown E14.5 WT FL hematopoietic cells were transplanted into lethally irradiated mice. Strikingly, knocking down Mdh1 in FL-HSCs resulted in a dramatic reduction in repopulation ability (Figure 6I), as well as the B220+ B cell lineage trending toward differentiation to a myeloid lineage (Figure 6J), indicating that MDH1 also controls HSC differentiation ability. The knockdown efficiency of MDH1 was determined in scrambled cells and Mdh1-knockdown donor hematopoietic cells (Figure 6K). To test whether MDH1 also plays a role in adult HSC activity, we examined the mRNA level of Mdh1 and revealed that adult HSCs had much lower mRNA levels of Mdh1 than FL-HSCs (supplemental Figure 6E). Interestingly, knockdown of Mdh1 in adult HSCs did not affect their activity, indicating that MDH1 may be more important for the stemness maintenance of FL-HSCs than for the stemness of adult HSCs (supplemental Figure 6F-G). We also noticed that adult HSCs had levels of Mdh2 expression similar to those of FL-HSCs (supplemental Figure 6H). However, knockdown of Mdh2 in adult HSCs resulted in a slight decrease in repopulated cells without affecting the lineage differentiation in recipient mice, indicating that MDH2 may play a role in the maintenance of adult HSC activities (supplemental Figure 6I-K). Alternatively, we further treated SoNar-low and -high FL hematopoietic cells with AOA for 24 hours and transplanted them into recipient mice to test the MDH1 function in FL-HSCs. Interestingly, only SoNar-low FL hematopoietic cells, but not SoNar-high FL hematopoietic cells, had a remarkable decrease in repopulating ability and differentiation skewness upon AOA stimulation (Figure 6L; supplemental Figure 6L). These results indicate that MDH1 controls the metabolic status and cell fate determination (eg, self-renewal and differentiation) of SoNar-low FL-HSCs.
STAT3 transactivates Mdh1 expression to maintain FL-HSC activity
To understand how MDH1 is upregulated in SoNar-low cells, we screened several potential candidate transcription factors that may bind to the Mdh1 promoter based on the altered pathways indicated in the microarray data, including the FoxO signaling pathway, adipocytokine signaling pathway, acute myeloid leukemia signaling pathway, and chemokine signaling pathway (data not shown). Interestingly, an increase, as high as 4.7-fold, in luciferase level was observed when different doses of Stat3 were cotransfected with a luciferase vector containing the Mdh1 promoter (Figure 7A). The subsequent ChIP assay also showed that the Mdh1 promoter could be detected in DNA samples immunoprecipitated by STAT3 antibodies (Figure 7B). Consistently, there was a notable decreased level of methylation at the Mdh1 promoter in SoNar-low FL hematopoietic cells, which may have facilitated transactivation by STAT3 (Figure 7C-D).
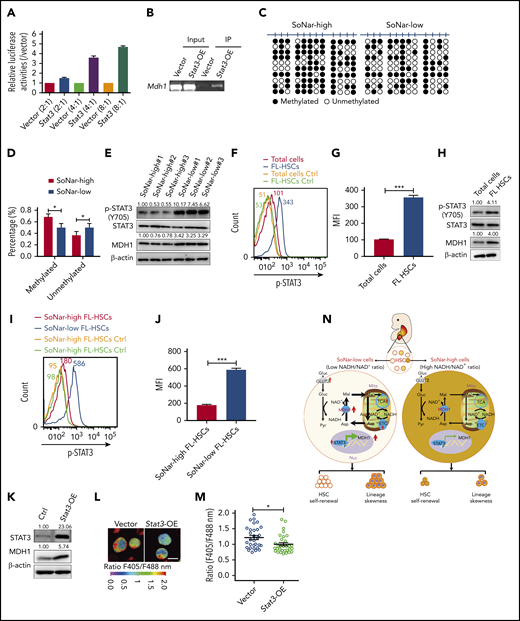
STAT3 transactivates Mdh1 expression to maintain FL-HSC activities. (A) Mdh1 luciferase reporter and different doses of Stat3 were cotransfected into 293T cells, followed by the determination of luciferase activities (n = 3). (B) ChIP assays were analyzed with 293T cells cotransfected with pGL4.27-mdh1 promoter vector and Stat3 plasmid or control plasmid. Input control and amplification of the Stat3-binding sequence of Mdh1 were determined by semiquantitative PCR. (C) Bisulfite sequencing analysis of the methylation patterns of the CpG islands in the Mdh1 promoter in CD45+ SoNar-high and -low FL hematopoietic cell fractions is shown. Each row represents a unique DNA clone; filled and open circles represent methylated and unmethylated CpGs, respectively. (D) Quantification data of methylated and unmethylated CpGs (n = 3). (E) Protein levels of pSTAT3, STAT3, and MDH1 were measured in CD45+ SoNar-high and -low FL cells. Ratios of pSTAT3/STAT3 and MDH1/actin were quantified and normalized against SoNar-high#1 cells. (F) Representative flow cytometric analysis of intracellular level of pSTAT3 of total CD45+ FL hematopoietic cells and FL-HSCs. Mean fluorescence intensity (MFI) of each group was shown (isotype control, yellow and green lines). (G) Quantification of MFI of intracellular level of pSTAT3 in panel F (n = 3). (H) Immunoblotting assay showed protein levels of pSTAT3, STAT3, and MDH1 in total CD45+ FL hematopoietic cells and FL-HSCs. Ratios of pSTAT3/STAT3 and MDH1/actin were quantified and normalized against total cells. (I) Representative flow cytometric analysis of intracellular level of pSTAT3 of CD45+ SoNar-high and -low FL-HSCs. MFI of each group is shown (isotype control, yellow and green lines). (J) Quantification of MFI of intracellular level of pSTAT3 in panel I (n = 3). (K) Protein level of MDH1 was measured in Stat3-overexpressed SoNar 32D cells and control cells by immunoblotting. Ratios of STAT3/actin and MDH1/actin were quantified and normalized against control cells. (L) Stat3-overexpressed SoNar 32D cells and control cells were evaluated for the ratios of SoNar fluorescence, and representative images are shown. Scale bar, 10 μm. (M) Quantification of the ratios of SoNar fluorescence in panel L. A total of 30 SoNar 32D cells were analyzed (n = 3). (N) Working model for the connections between FL-HSC activities and Mdh1-mediated malate-aspartate shuttle as indicated by SoNar. Data are represented as mean ± standard error of the mean. Student 2-tailed unpaired t test (G,J,M) and 2-way analysis of variance with Sidak’s multiple comparison test (D) were used for the comparison. *P < .05, ***P < .001.
STAT3 transactivates Mdh1 expression to maintain FL-HSC activities. (A) Mdh1 luciferase reporter and different doses of Stat3 were cotransfected into 293T cells, followed by the determination of luciferase activities (n = 3). (B) ChIP assays were analyzed with 293T cells cotransfected with pGL4.27-mdh1 promoter vector and Stat3 plasmid or control plasmid. Input control and amplification of the Stat3-binding sequence of Mdh1 were determined by semiquantitative PCR. (C) Bisulfite sequencing analysis of the methylation patterns of the CpG islands in the Mdh1 promoter in CD45+ SoNar-high and -low FL hematopoietic cell fractions is shown. Each row represents a unique DNA clone; filled and open circles represent methylated and unmethylated CpGs, respectively. (D) Quantification data of methylated and unmethylated CpGs (n = 3). (E) Protein levels of pSTAT3, STAT3, and MDH1 were measured in CD45+ SoNar-high and -low FL cells. Ratios of pSTAT3/STAT3 and MDH1/actin were quantified and normalized against SoNar-high#1 cells. (F) Representative flow cytometric analysis of intracellular level of pSTAT3 of total CD45+ FL hematopoietic cells and FL-HSCs. Mean fluorescence intensity (MFI) of each group was shown (isotype control, yellow and green lines). (G) Quantification of MFI of intracellular level of pSTAT3 in panel F (n = 3). (H) Immunoblotting assay showed protein levels of pSTAT3, STAT3, and MDH1 in total CD45+ FL hematopoietic cells and FL-HSCs. Ratios of pSTAT3/STAT3 and MDH1/actin were quantified and normalized against total cells. (I) Representative flow cytometric analysis of intracellular level of pSTAT3 of CD45+ SoNar-high and -low FL-HSCs. MFI of each group is shown (isotype control, yellow and green lines). (J) Quantification of MFI of intracellular level of pSTAT3 in panel I (n = 3). (K) Protein level of MDH1 was measured in Stat3-overexpressed SoNar 32D cells and control cells by immunoblotting. Ratios of STAT3/actin and MDH1/actin were quantified and normalized against control cells. (L) Stat3-overexpressed SoNar 32D cells and control cells were evaluated for the ratios of SoNar fluorescence, and representative images are shown. Scale bar, 10 μm. (M) Quantification of the ratios of SoNar fluorescence in panel L. A total of 30 SoNar 32D cells were analyzed (n = 3). (N) Working model for the connections between FL-HSC activities and Mdh1-mediated malate-aspartate shuttle as indicated by SoNar. Data are represented as mean ± standard error of the mean. Student 2-tailed unpaired t test (G,J,M) and 2-way analysis of variance with Sidak’s multiple comparison test (D) were used for the comparison. *P < .05, ***P < .001.
STAT3 has also been reported to fine-tune the stemness of adult HSCs and FL-HSCs.44,45 STAT3 is phosphorylated and translocated to the nucleus, where it acts as a transcription activator.46 Consistently, results from immunoblotting analyses revealed that the phosphorylation of STAT3 (Y705) was markedly increased in SoNar-low FL hematopoietic cells compared with their counterparts (Figure 7E). Moreover, FL-HSCs and SoNar-low FL-HSCs also had a significant increase in pSTAT3 level compared with total FL hematopoietic cells and SoNar-high FL-HSCs, respectively (Figure 7F-J). Consistently, overexpression of STAT3 in SoNar-high FL-HSCs also increased the level of STAT3 phosphorylation (supplemental Figure 7A-B). We also treated FL-HSCs with STAT3 inhibitors for 24 hours and demonstrated that both pSTAT3 and MDH1 were efficiently reduced (supplemental Figure 7C). In addition, it seemed that the effect of STAT3 inhibitors was similar in FL-HSCs and adult HSCs (supplemental Figure 7C). Overexpression of Stat3 in 32D cells significantly increased MDH1 levels, as determined by western blotting (Figure 7K). Stat3 overexpression in 32D cells decreased the ratio of SoNar fluorescence, as evaluated by confocal microscopy (Figure 7L-M). Consistently, overexpression of Stat3 in FL-HSCs also resulted in a notable decrease in the SoNar ratio (supplemental Figure 7D-F). In summary, we showed that FL-HSCs depended mainly on heightened malate-aspartate shuttle activity and oxidative phosphorylation but had a glycolytic level, for energy procurement, similar to that of differentiated bulk cells, as indicated by a sensitive and specific intracellular sensor, SoNar, in a process that was fine-tuned by the STAT3/MDH1 pathways (Figure 7N). We also provide a powerful tool for monitoring the dynamics of metabolic changes in FL-HSCs, both in vitro and in vivo, which may open a new avenue for studying the metabolism of HSCs and other types of stem cells with a relatively rare population frequency.
Discussion
How metabolic status is regulated at different developmental stages remains largely unknown because of the low population frequency of HSCs and a lack of suitable tools for the analysis of the detailed metabolic programs induced by different nutrients. In this study, we used the newly developed NADH/NAD+ sensor SoNar to generate a SoNar-expressing transgenic mouse and developed a novel in vivo imaging tool that enabled real-time investigation of metabolic events in different microenvironments and tissues. We demonstrated that SoNar can sensitively indicate dynamic changes in energy metabolism both in vitro and in vivo and showed that FL-HSCs use mitochondrial respiration as a main energy source. This energetics program was fine-tuned by the MDH1-mediated malate-aspartate NADH shuttle. We also provided consistent data showing that the metabolic profiles of FL-HSCs are very different from those of adult HSCs (mainly depending on glycolysis12,14,17 ), indicating a metabolic switch that may be important for the maintenance of HSC stemness during development.
Although studies from other groups and our group have shown that adult HSCs have relatively high glycolytic levels, recent studies have also revealed that depletion of 1 of the important genes required for oxidative phosphorylation, Rieske iron-sulfur protein, leads to a loss of stemness of adult HSCs and abnormal differentiation of FL-HSCs.22 However, the extreme enhancement of mitochondrial activity resulting from SRC-3 loss also leads to cell-cycle exit and adult HSC exhaustion.47 These results indicate that mitochondrial respiration plays a critical role during the developmental stages of HSCs and that orchestrated regulatory networks may be involved in the metabolism of both FL-HSCs and adult HSCs. It is also very likely that both glycolysis and mitochondrial respiration are required for the maintenance of HSC activity, although HSCs may differentially depend on these 2 metabolic processes to a certain extent during the stages of origination, maturation, expansion, homeostasis, and aging. Interestingly, single-cell mRNA sequencing also indicated that HSCs derived from the aorta-gonad-mesonephros region have markedly enhanced mitochondrial respiration compared with adult HSCs.48 More efforts are required to determine the underlying mechanisms related to these metabolic profiles of HSCs.
We also observed that SoNar-low FL hematopoietic cells had moderate or maximal responsiveness to oxamate and AOA treatment, respectively (Figure 3D), indicating that NADH from glycolysis may be sustained at a relatively high rate of production and that it can be transported into mitochondria through the MDH1-mediated malate-aspartate shuttle. These observations are consistent with findings showing that glycolytic levels in SoNar-low FL hematopoietic cells were similar to those in SoNar-high FL hematopoietic cells, as indicated by the flux analysis results (Figure 3G). Because no specific MDH1 inhibitor is currently available, we used AOA to treat FL-HSCs in vitro, followed by BM transplantation, which efficiently suppressed FL-HSC activity. Moreover, we also showed that Mdh1 knockdown efficiently inhibited FL-HSC activity in a BM transplantation model. Although a recent report indicated that adult HSCs seem to highly express the MDH1 protein, as indicated through an assay of quantitative proteomics, no functional assay was evaluated in this study to define the functional role of MDH1 in HSC activity.49 Interestingly, our results showed that knocking down Mdh1 in adult HSCs did not impair their repopulation abilities (supplemental Figure 6F-G), a finding that is consistent with evidence of their metabolic preference for using glycolysis as their main energy source. Taken together, these data show that MDH1 may indeed be important mainly for FL-HSC stemness maintenance but not for adult HSC stemness. However, considering that AOA is a general transaminase inhibitor, it is possible that other transaminases may also play a role in sustaining FL-HSC activity. A determination of whether MDH1 is also required in HSCs under physiological conditions during normal development awaits further investigation.
These results also indicate that FL-HSCs may have enhanced mitochondrial respiration without reducing glycolysis, which contradicts the prevailing idea that glycolysis and mitochondrial respiration levels are usually maintained in an antiparallel balance during glucose metabolism within a cell.12,15 Consistently, we also observed only a slight decrease or negligible change in the lactate level in SoNar-low FL hematopoietic cells (Figure 3G,L-M). These results suggest that lactate may not be a sensitive indicator of glycolysis, as commonly thought and subsequently used in many situations. Our studies provide intriguing evidence supporting an HSC requirement for a level of glycolysis and increased mitochondrial respiration similar to those of differentiated hematopoietic cells at different developmental stages. Moreover, it is also possible that rapidly proliferating cells expend substantial energy to maintain the redox state ratio, at all costs, for their optimal growth, an explanation that accounts for these findings. However, how the balance between glycolysis and oxidative phosphorylation in these cell types (especially in stem cells) is sustained or switched at different developmental stages or during malignant transformation remains largely unknown.
Currently, whether these metabolic changes are essential for the maintenance of stemness of HSCs or are a consequence of their existence in unique niches continues to be debated. However, increasing evidence indicates that intrinsic metabolism may be a key factor determining HSC fate. For example, both FL-HSCs and adult HSCs reside mainly in vascular niches3,50,51 and preferentially use mitochondrial respiration (as we showed in this report) and glycolysis, respectively, suggesting that niches may have no substantive impact on HSC metabolism; mobilized peripheral blood HSCs also depend on glycolysis for energy via the MEIS1/PBX1/HOXA9 complex–mediated pathways, indicating that intrinsic factors, but not extrinsic niche components, determine HSC metabolic properties and activity levels. Consistently, several other cell-intrinsic regulators have been reported to be involved in the metabolic control of HSC function, including FoxOs, LKB1, and MFN2.8,52-54
In this study, we also demonstrated that STAT3 efficiently binds the Mdh1 promoter region to transcriptionally activate Mdh1 expression and thus sustain FL-HSC stemness, which further supports a causal role of metabolic regulation in HSC commitment; however, how STAT3 is regulated in FL-HSCs is still not clear. We also cannot exclude the possibility that the niche may differentially exert its effects on the intrinsic metabolic status of HSCs because of the dynamic changes in niche components at different developmental stages. It is possible that there is much higher oxygen tension in the FL niche than in the adult BM niche because of their differing anatomical structures, which may further enhance the mitochondrial respiration of FL-HSCs. A determination of whether niche components or intermediary metabolites regulate the intrinsic regulatory networks to remodel the metabolism of HSCs awaits further investigation.
Compared with traditional biochemical analysis, SoNar is especially suitable for stem cell research given the limitations of stem cell availability. In addition, SoNar is multitargeted, because it is capable of reporting subtle perturbations in many pathways affecting energy metabolism, including glycolysis and mitochondrial respiration.26,31,55 We recently also showed that SoNar-high leukemia cells are more glycolytic and highly enriched for leukemia-initiating cells, indicating SoNar is a reliable tool for monitoring metabolic status in live cells.41 Our data show that SoNar fluorescence can be precisely detected in HSCs or differentiated hematopoietic cells in the BM upon metabolic perturbation, which may be useful for the real-time imaging needed to unravel the dynamics of HSC metabolism. We also show that SoNar is stably expressed in many tissues of transgenic mice, which may be a potent system for studies of physiological or pathological metabolic changes of many tissues and organs. In summary, by using SoNar transgenic mice, we provide direct evidence showing that FL-HSCs have enhanced mitochondrial respiration and a glycolytic level similar to that of bulk hematopoietic cells to maintain their stemness through activation of the MDH1-mediated malate-aspartate NADH shuttle, which is fine-tuned by STAT3 activities/phosphorylation level. These results may shed new light on studies of stem cell metabolism for both hematopoietic and other systems in either physiological or pathological situations and may facilitate the development of novel strategies for drug screening or cancer treatment by regulating these metabolic pathways.
Contact the corresponding author regarding data sharing requests for renewable materials, data sets, and protocols.
The microarray data reported in this article have been deposited in the Gene Expression Omnibus database (accession number GSE110109).
The online version of this article contains a data supplement.
The publication costs of this article were defrayed in part by page charge payment. Therefore, and solely to indicate this fact, this article is hereby marked “advertisement” in accordance with 18 USC section 1734.
Acknowledgments
The authors thank Yue Song for help in metabolic flux analysis, Weijun Pan for constructive suggestions in real-time imaging in vivo, and Stephanie Tribuna (Brigham and Women's Hospital) for secretarial assistance.
This work was supported by grants from the National Natural Science Foundation of China (81825001, 81570093, 31971052, 31722033, 91649123, 31671484, and 91857202); National Basic Research Program of China (2019YFA0801800, 2018YFA0107000, 2019YFA0904800, and 2017YFA050400); Innovative Group of the National Natural Science Foundation of China (81721004; G.Q.-C.); Chinese Universities Scientific Fund; Research Unit of New Techniques for Live-cell Metabolic Imaging, Chinese Academy of Medical Sciences (2019RU01, 2019-I2M-5-013); Major Program of the Development Fund for Shanghai Zhangjiang National Innovation Demonstration Zone (Stem Cell Strategic Biobank and Stem Cell Clinical Technology Transformation Platform; ZJ2018-ZD-004); Innovative Research Team of High-Level Local Universities in Shanghai, Natural Science Foundation of Shanghai (17ZR1415500); Shanghai Science and Technology Commission (19XD1422100 and 18JC1411900); Interdisciplinary Program of Shanghai Jiao Tong University (YG2016MS82); National Postdoctoral Program for Innovative Talents (BX201700157); US National Institutes of Health, National Heart, Lung, and Blood Institute (HL061795, Hl119145) (J.L.) and National Human Genome Research Institute (HG007690) (J.L.); and US National Institutes of Health, National Institute of General Medical Sciences (GM107618) (J.L.).
Authorship
Contribution: H.G., C.C., X. Hao, N.S., Y. Zhao, Y.Y., and J.Z. designed the experiments, performed the experiments, analyzed data, and wrote the paper; D.H., Y. Zou, S.-H.L., X.C., D.Z., L.L., Z.Y., L.X., Y. Zhang, X. He, X.L., and X.Z. performed the experiments; and G.-Q.C. and J.L. helped with the design of experiments and writing.
Conflict-of-interest disclosure: The authors declare no competing financial interests.
Correspondence: Junke Zheng, 280 South Chongqing Rd, Shanghai 200025, China; e-mail: zhengjunke@shsmu.edu.cn; Yuzheng Zhao, 130 Meilong Rd, Shanghai 200237, China; e-mail: yuzhengzhao@ecust.edu.cn; and Yi Yang, 130 Meilong Rd, Shanghai 200237, China; e-mail: yiyang@ecust.edu.cn.

This feature is available to Subscribers Only
Sign In or Create an Account Close Modal