

Key Points
Aging-related inflammation promotes HSC aging through TNF-α→ERK→ETS1→IL27Ra pathway.
Deletion of IL27Ra rescues the functional decline and myeloid-bias of HSCs and also reverses the inhibitory effect of TNF-α on HSCs.

Abstract
Hematopoietic stem cell (HSC) aging correlates with an increasing risk of myeloproliferative disease and immunosenescence. In this study, we show that aging-related inflammation promotes HSC aging through tumor necrosis factor-α (TNF-α)→ERK→ETS1→interleukin27Ra (IL27Ra) pathway. TNF-α, a well-known biomarker of inflammation, increases during aging and induces the expression of IL27Ra on HSCs via ERK-ETS1 signaling. Deletion of IL27Ra rescues the functional decline and myeloid bias of HSCs and also reverses the inhibitory effect of TNF-α on HSCs. Aged IL27Ra−/− mice had a reduced proportion of myeloid-biased HSCs and did not display the biased myeloid differentiation that occurs in aged wild-type mice. IL27Ra+ HSCs exhibit impaired reconstitution capacity and myeloid-bias compared with IL27Ra− HSCs and serve as a myeloid-recovery pool upon inflammatory insult. Inflammation-related genes were enriched in IL27Ra+ HSCs and this enrichment increases with aging. Our study demonstrates that age-induced IL27Ra signaling impairs HSCs and raises the possibility that interfering with IL27Ra signaling can counter the physiologically deleterious effect of aging on hematopoietic capacity.
Introduction
Aging is a complex process in animals characterized by the gradual loss of homeostasis in many tissues. Defects in the function of tissue-specific stem cells during aging is considered to be the pivotal factor underlying this complex process.1,2 Hematopoietic stem cells (HSCs), quiescently located in bone marrow, are responsible for generating all of the blood cells throughout the mammalian life-span.3 During aging, the reconstitution capacity of HSCs declines, and their propensity to differentiate into myeloid lineage cells rather than lymphoid lineage cells is strengthened,4,5 which is considered as the main factor resulting in immunosenescence.6
Previous studies have largely speculated that the HSC-intrinsic mechanisms are the main factors driving HSC aging7-12 ; however, recent studies have highlighted that the extrinsic factors play important roles in this process.13-15 A study in which young HSCs were transplanted into elderly recipient mice and subsequently exhibited aging-related phenotypes established that increased levels of the aging-related protein CCL5 triggers a shift in HSC differentiation toward myeloid lineage.13 A later study comparing differential expression of cytokines in young and aged bone marrow showed that osteopontin is reduced in aged bone marrow samples and treatment of aged HSCs with osteopontin attenuated HSC aging.14 Taken together, these studies indicated that the bone marrow microenvironment plays a significant role in the aging process of HSCs.
It has been known for several decades that aging is frequently accompanied by chronic inflammation (inflamm-aging), characterized by increased systemic levels of several pro-inflammatory cytokines, including tumor necrosis factor-α (TNF-α) and interleukin-1β (IL-1β).14,16 Further, a growing body of evidence suggests that inflammation modulates both the aging process and age-related diseases.17 It is well-established that, even in the absence of overt diseases, chronic, low-grade, systemic inflammation is a common feature of aging.18,19 Several studies focused on HSCs have shown that inflammatory signaling, which is activated by inflammatory factors, induces the differentiation of the myeloid progenitor cells required to withstand harmful stimuli.20-22 Specifically, recent studies have shown that interferon-α (IFN-α) and IFN-γ activate HSCs entry into the cell cycle and that bacterial evasion boosts the myeloid-biased differentiation of HSCs.23,24 TNF-α impairs HSC function in a manner mediated by its receptor, and, consistently, TNF-α–receptor-deficient HSCs display enhanced reconstitution capacity.25 Furthermore, constitutive application of IL-1β promotes myeloid lineage biased differentiation of HSCs, a trend that has also been observed in aging HSCs.26
Overall, these studies indicate that the administration of pro-inflammatory factors to HSCs mimic some biological processes that occur during normal aging; however, it is not clear how aging-related inflammation coordinates the intrinsic mechanism to finely regulate HSC function and differentiation. Therefore, elucidating how HSCs respond to the inflammatory signals present in their immediate microenvironment that occur during aging process may shed light on the mechanism(s) underlying myeloid bias and/or the decreased self-renewal potential of aging HSCs.
Here, we demonstrate that the pro-inflammatory environment induces the expression of interleukin 27 receptor α (IL27Ra) on the surface of HSCs via a TNF-α→ERK→ETS1 pathway. HSCs from young and aged mice were fractionated into 2 subpopulations: IL27Ra+ and IL27Ra−. We demonstrate that IL27Ra+ HSCs display a compromised capacity in reconstituting the blood system, a bias toward myeloid lineage differentiation, a burst of inflammatory gene expression, and show that these HSCs serve as a myeloid-recovery pool in response to inflammatory insult. In contrast, IL27Ra− HSCs exhibited significantly improved reconstitution capacity and enhanced the differentiation potential to lymphoid lineage compared with IL27Ra+ HSCs. Targeted deletion of IL27Ra enhanced the reconstitution capacity of HSCs and reversed the differentiation bias toward myeloid lineage. Consistently, aged IL27Ra−/− mice exhibited a reduced proportion of myeloid-biased HSCs and did not display the biased myeloid differentiation of aged wild-type (WT) mice. Furthermore, our data revealed that the cytotoxic effect of TNF-α on HSCs is mediated by IL27Ra. Lipopolysaccharides (LPS) challenge significantly boosts HSCs in WT mice, whereas IL27Ra−/− mice exhibits less pronounced expansion, suggesting that IL27Ra is sensor of HSCs in response to inflammatory stimuli. Taken together, our study revealed that aging-induced IL27Ra directs HSCs differentiation into myeloid lineage to satisfy the inflammatory stress-driven demand for myeloid cells, a process that promotes HSC aging, and defines a previously unknown molecular mechanism through which immunosenescence is directly linked to inflamm-aging that can potentially be exploited for the development of novel therapies against aging-related hematopoietic diseases.
Methods
Mice
C57BL/6 mice (CD45.2), C57BL/6-SJL (CD45.1) mice, and IL27Ra−/− mice were from the Jackson Laboratory. All of these strains were maintained on C57BL/6 background. All genotyping primers are listed in supplemental Table 2 on the Blood Web site. The recipients used in the competitive transplantation assays were CD45.1/2 that were the first generation of C57BL/6 (CD45.2) and B6.SJL (CD45.1) mice. All mice were kept in specific pathogen-free conditions. All procedures were approved by the Institutional Animal Care and Use Committee of Tsinghua University.
Blood cell counts
Mice were bled and analyzed using an Auto Hematology Analyzer BC-5000 (MINDRAY).
Transplantations and peripheral blood analysis
Freshly isolated HSCs (CD45.2) were injected into lethally irradiated recipient mice (CD45.1/2) together with 2 × 10⁵ total bone marrow cells (CD45.1) as competitor. Recipient mice were administered a lethal dose of radiation (10 Gy) using X-ray irradiator (RS-2000, Rad Source Technologies) before transplantation. Regarding the secondary transplantation, 2 × 10⁶ chimeric bone marrow cells from the primary recipients were transplanted into the secondary recipient mice. Recipient mice were administered with antibiotic water for 2 to 3 weeks following transplantation, and analyzed for donor-derived chimerism (including myeloid, B, and T cells) every 4 weeks. The antibodies used to analyze peripheral blood chimerism were listed in supplemental Table 3.
Flow cytometric analysis and cell sorting
Bone marrow cells were harvested by crushing the bones (femur, tibia, and pelvis) with pestle and mortal in Hanks balanced salt solution (HBSS) with 2% fetal bovine serum and 1% N-2-hydroxyethylpiperazine-N′-2-ethanesulfonic acid buffer (HBSS+). Viable cells were counted by Vi-CELL XR Cell Viability Analyzer (Beckman Coulter). Cells were stained with antibodies labeled with fluorochromes (supplemental Table 3). Hematopoietic populations (supplemental Table 3) were identified by flow cytometry using BD LSRFortessa (BD Biosciences, San Jose, CA). Data were analyzed using FlowJo software (TreeStar, Ashland, OR).
For hematopoietic stem and progenitor cells (c-Kit+ or lineage− cells) enrichment, bone marrow cells were stained with c-Kit-APC or lineage-biotin antibody followed by magnetic bead enrichment (Miltenyi Biotec). For HSCs sorting, c-Kit+ or lineage− cells were stained with combinations of antibodies against the following surface markers: Sca1, c-Kit, CD150, CD34, IL27Ra, and the lineage markers Gr-1, CD11b, Ter-119, B220, CD3, CD4, and CD8a. 4′,6-diamidino-2-phenylindole (Sigma-Aldrich, D8417) was used to exclude dead cells. Further details regarding flow cytometry reagents are provided in supplemental Table 3. The cells were isolated by BD Influx (BD Biosciences).
Intracellular staining
An initial enrichment of c-Kit+ or lineage− cells were using for intracellular staining using FIX & PERM Cell Permeabilization Kit (Thermo Fisher Scientific). Briefly, cells were stained with surface markers, fixed in Medium A, washed, permeabilized with Medium B, and stained with antibody against an intracellular target. After washing, cells were analyzed by LSR Fortessa Flow Cytometer (BD Biosciences).
HSCs in vitro cultures
HSCs were directly sorted into 96-well plate containing StemSpan serum-free medium (Stem Cell Technologies, #09650 Vancouver, Canada) supplemented with 20 μg/mL mSCF (PeproTech), 20 μg/mL mTPO (PeproTech), and 50 U/mL penicillin/streptomycin (Hyclone). For cytokines treatment, cells were cultured for indicated timepoints with the flowing recombinant murine cytokines: 50 ng/mL TNF-α (PeproTech), 10 ng/mL IL-27 (R&D Systems), 25 ng/mL IL-1β (PeproTech), IL-6 (PeproTech), CCL5 (PeproTech), MIG (Sino Biological), ANGPTL2 (Sino Biological), Frizzled-1 (Sino Biological), TIMP-1(BioLegend), MIP1-α (PeproTech), MIP1-β (PeproTech), MIP1-γ (PeproTech), CXCL11 (PeproTech), vascular endothelial growth factor (PeproTech), IFN-α (BioLegend), or IFN-γ (PeproTech). For pathway blockade assays, cells were treated with either dimethyl sulfoxide or 2 μM TPCA-1 (IKKβ inhibitor; Sigma-Aldrich, T1452) and 10 μM PD98059 (MEK/ERK inhibitor; Selleck, S1177). All cultures were performed at 37°C in a 5% CO2 water jacket incubator (Thermo Scientific).
Lentivirus production and transduction
The mouse NF-κB p65 and Ets1 were cloned into SF-LV-cDNA-EGFP vector. The Ets1 short hairpin RNAs (shRNAs) were cloned into pLKD-CMV-G&PR-U6-shRNA vector. Lentivirus was produced in 293T cells and was concentrated according to standard procedures.11 For lentiviral transduction, c-Kit+ Sca1+ Lineage− (KSL) cells were sorted and plated in 100 μL SFEM medium (Stem Cell Technology, 09650) with 20 μg/mL mSCF, 20 μg/mL mTPO, and 1% penicillin/streptomycin in 96-well plate (∼1 × 10⁵ per well).
Quantitative real-time PCR
Total RNA was extracted using TRIzol (Thermo Fisher Scientific) according to the manufacturer’s instructions. Total RNA was subjected to reverse transcription using StarScript II First-strand cDNA Synthesis Kit (Genestar, Beijing, China). Quantitative real-time polymerase chain reaction (PCR) was performed on QuantStudio-3 Real-time PCR System (Applied Biosystems) using the 2× SYBR Green master mix (Applied Biosystems). The primer information is listed in supplemental Table 2.
Enzyme-linked immunosorbent assay and cytokine array
Femurs and tibiae were flushed with 150 μL phosphate-buffered saline (PBS) using an insulin syringe with a 29G needle. Bone marrow cells were removed by centrifuge at 500g for 6 minutes. Supernatants were further clarified by centrifuge at 14 000g for 5 minutes. Samples were subsequently stored at −80°C until use. Amounts of TNF-α in bone marrow plasma were determined by Mouse QuantiCyto TNF-α ELISA Kit (Neobioscience, #EMC102a) according to the manufacturer’s instruction. Amounts of inflammatory cytokines and chemokines in bone marrow plasma were determined by Antibody Arrays Kit (Mouse L308 Array, AAM-BLG-1-2, Raybiotech) according to the manufacturer’s instruction.
RNA sequencing analysis
The transcriptome sequencing was performed by ANNOROAD Gene Technology Company. In brief, 50 HSCs were sorted directly into lysis buffer. The Smart-seq2 method was used to prepare transcriptome libraries. After the library construction, assess the insertion size by Agilent Bioanalyzer 2100 system (Agilent Technologies), and quantify the accurate insertion size by Taqman fluorescence probe of AB Step One Plus Real-Time PCR system. Perform the clustering of the index-coded samples using HiSeq PE Cluster Kit v4-cBot-HS (Illumina) following the manufacturer’s instructions. The libraries were sequenced by an Illumina Hiseq platform with 150-bp paired-end (GENOME, China).
Quality control of all samples was performed using the FastQC software v0.11.5. Samples were mapped to the mouse reference genome NCBI m37 by Tophat v2.1.1 and gene read counts were obtained with HTSeq. R-package DESeq2 was performed to normalize gene counts and infer the differential expression levels of samples between 2 different groups. Genes with both adjusted P < .05 and fold change >1.5 were defined as differential expressed genes. Enriched KEGG Pathways and Gene Ontology terms of the differentially expressed genes in each group were obtained by using the online tool DAVID. Gene Set Enrichment Analysis (GSEA) was performed using GSEA software (http://software.broadinstitute.org/gsea/) with PreRanked weighted mode. Functional gene sets of mice were downloaded from GSKB, a gene set database for mice (http://ge-lab.org/gskb/). Inflammation-associated gene signature was composed of the union of related gene sets, including gene sets of brain inflammation, intestinal inflammation, lung inflammation, peritoneal inflammation, and kidney inflammation. Genes targeted by Rela and Est1 were downloaded from database TRRUST of version 2 (https://www.grnpedia.org/trrust/).27 For the gene signature of inflammation, GSEA was performed to the absolute values of the normalized fold changes between 2 different groups, which was used to evaluate gene expression alterations instead of up- or downregulation. Meanwhile, GSEA of other gene sets was applied to the normalized fold changes between 2 different groups. GSEA results of gene sets with both false discovery rate (FDR) adjusted q value <0.05 and |NES| >0.3 were considered as significant enrichment. To assess the similarity of all samples in 4 groups (young IL27Ra− HSCs [YN], young IL27Ra+ HSC [YP], old IL27Ra− HSC [ON], and old IL27Ra+ HSC [OP]) on the transcriptomic level, we performed hierarchical clustering and principal component analysis (PCA) of all genes expressed in more than 2 samples and with standard variance in transcript level across all samples greater than 0.5. Hierarchical clustering was performed using the “pheatmap” function in R language software. Clustering method and distance were set as “complete” and “correlation.” PCA analysis was performed using the same criterion with “labdsv” package in R language.
Sequencing data reported in this paper were deposited into the National Center for Biotechnology Information Gene Expression Omnibus with accession number GSE115182.
Human samples preparation and colony-forming unit assay
Human bone marrows were obtained from Peking University People's Hospital and processed in accordance to the guidelines approved by the hospital and the Declaration of Helsinki. Samples were diluted with an equal volume of PBS/2% fetal bovine serum, and were added into the SepMate tubes (Stem Cell Technologies, 15450) supplemented with Ficoll gradient medium (Tianjin Haoyang Biological, China). Tubes were subjected to 10 minutes of centrifugation at 1000g followed by collection of mononuclear cells and washed with PBS/2% fetal bovine serum. The samples were suspended in Bambanker serum-free cell-freezing medium (Wako Chemicals) and stored at −80°C until use.
For cell sorting, the samples were thawed and resuspended in HBSS+. Cells were subsequently stained with the following human antibodies: CD34-APC (clone 581; BioLegend), CD38-PE-Cy7 (clone HB-7; BioLegend), IL27Ra-PE (clone #191106; R&D Systems), and lineage-cocktail-Pacific Blue (CD3, CD14, CD16, CD19, CD20, CD56; BioLegend). Cells were incubated for 30 minutes at 4°C and washed with HBSS+ before sorting. For colony-forming unit assay, IL27Ra− or IL27Ra+ HSCs (CD34+ CD38− Lineage−) were seeded into a cytokine-supplemented methylcellulose medium (MethoCult, H4435, Stem Cell Technologies) according to the manufacturer’s instruction. Two hundred HSCs were plated per 35-mm dish and incubated in a 37°C incubator. Counting and classification of colonies were performed at the 14th day.
Construction of luciferase reporter plasmids
For IL27Ra promoter reporter vector, the 2000-bp genomic DNA sequence upstream of IL27Ra translation start site were cloned into pGL3 Basic vector. IL27Ra-2000-F: TCTATCGATAGGTACAGCCAGGCATCTTGGGGTTA, which introduced 15-bp homologous base sequence upstream of pGL3 Basic vector Kpn I site and IL27Ra-R: GATCTCGAGCCCGGGGGCTCCCAGGGACAAGTGA, which introduced 15-bp homologous base sequence downstream of pGL3 Basic vector Nhe I site. According to the instruction of TIANGEN EasyGeno Assembly Cloning Kit, the PCR product and pGL3 Basic vector were double digested with Kpn I and Nhe I and yielded the IL27Ra promoter reporter pGL3-IL27Ra-2000 vector. By using the same method, we generated various reporter plasmid carrying different length of IL27Ra promoter: pGL3-IL27Ra-1500, pGL3-IL27Ra-1361, pGL3-IL27Ra-1211, pGL3-IL27Ra-1061, pGL3-IL27Ra-911, pGL3-IL27Ra-761, pGL3-IL27Ra-611, pGL3-IL27Ra-510, pGL3-IL27Ra-461, pGL3-IL27Ra-311, pGL3-IL27Ra-178, pGL3-IL27Ra-140, pGL3-IL27Ra-120, pGL3-IL27Ra-75, and pGL3-IL27Ra-50. The primers are listed in supplemental Table 2.
To mutate the predicted binding sites of nuclear factor-κB (NF-κB) p65 and ETS1, IL27Ra-mut-F1 (5′-TGGGGGTGGGCGGATTTGTTTTCTTCCCGCCA-3′), and IL27Ra-mut-R1 (5′- AAAACAAATCCGCCCACCCCCAGCAATGATAC-3′) were used to converted GGGA into TTTT; IL27Ra-mut-F2 (5′- GGTGGGCGGATTTGTTTTTCCAACGCCAGGGGC-3′) and IL27Ra-mut-R2 (5′- TTGGAAAAACAAATCCGCCCACCCCCAGCAATGA-3′) were used to converted CCCTGAAGG into AAAAAGGTT.
To express Ets1, we cloned Ets1 into pIRES2-EGFP vector by using the following primers: forward: 5′-TACCGGACTCAGATCATGAAGGCGGCCGTCGAT-3′, and reverse: 5′- TACCGTCGACTGCAGCTAGTCAGCATCCGGCTTTACA-3′. Similarly, the NF-κB p65 expression vector was constructed with the primers PIRES-NF-κB p65-F (5′-TACCGGACTCAGATCATGGACGATCTGTTTCCCCTC-3′) and PIRES-NF-κB p65-R (5′-TACCGTCGACTGCAGTTAGGAGCTGATCTGACTCAAAAGAG-3′).
Luciferase assay
For IL27Ra promoter truncation experiment, 293T cells transfected with control or IL27Ra promoter reporter vectors, using Lipofectamine 2000 (Invitrogen, Life Technologies) according to the manufacturer’s instructions after growing at approximately 70% confluence. In Ets1 or NF-κB p65 overexpression report gene experiments, 293T cells were transfected with IL27Ra promoter reporter plasmids and pIRES2-Ets1 vector, pIRES2-NF-κB p65 vector, the negative control vector using Lipofectamine 2000 after growing at ∼70% confluence. Furthermore, in the report gene experiments of IL27Ra promoter mutation, 293T cells transfected with pGL3-IL27Ra-120-WT vector or pGL3-IL27Ra-120-mutation vector and pIRES2-Ets1 vector, pIRES2- NF-κB p65 vector, the negative control vector using Lipofectamine 2000 after growing at ∼70% confluence. Among all the assays mentioned, luciferase assays were performed by Dual-Luciferase Reporter Assay System (Promega, Madison, WI) according to the manufacturer’s instructions after the cells were transfected 48 hours. All experiments were normalized to Renilla luciferase activity and performed in triplicate.
Western blot
c-Kit+ cells were isolated and lysed with 120 μL NETN buffer (20 mM Tris-HCl, pH 8.0, 100 mM NaCl, 1 mM EDTA, 0.5% Nonidet P-40, containing protease and phosphatase inhibitors cocktail) on ice for 30 minutes and then centrifuged at 12,000g for 10 minutes. The supernatant was collected and then boiled with 2× loading buffer. For HSCs, freshly isolated CD48− KSL cells were lysed in sodium dodecyl sulfate (SDS) loading buffer, lysis was completed by sonication and denatured by boiling. Samples were resolved on 10% SDS-polyacrylamide gel electrophoresis. Membranes were blocked with 5% milk in Tris-buffered saline with Tween 20 buffer and then probed with indicated primary antibodies.
Chromatin immunoprecipitations
A total of 1 × 10⁷ lineage negative cells were collected and then crosslinked with 1% formaldehyde, after 10 minutes of rocking, glycine (0.125 M) was added to terminate the cross-linking. Cells were washed with chilled PBS and collected by centrifugation. Cells were resuspended in lysis bufferI (140 mM NaCl, 50 mM N-2-hydroxyethylpiperazine-N′-2-ethanesulfonic acid, pH 7.5, 1 mM EDTA, 10% glycerol, 0.5% NP-40, 0.25% Triton X-100, and protease and phosphatase inhibitors cocktail) and rocked at 4°C for 30 minutes. Cells were centrifuged and resuspended in lysis buffer II (10 mM Tris-HCl, pH 8.0, 200 mM NaCl, 1 mM EDTA, 0.5 mM EGTA, protease and phosphatase inhibitors cocktail) and rocked at room temperature for 10 minutes. Nuclei were collected and resuspended in sonication buffer (10 mm Tris-HCl, pH 8.0, 1 mM EDTA, 0.5 mM EGTA, protease and phosphatase inhibitors cocktail), and sonicated on ice water to shear chromatin to an average size of 400 bp. Samples were centrifuged at 14,000g for 10 minutes, the supernatant was diluted 5 times with RIPA-150 Buffer (50 mM Tris-HCl pH8.0, 150 mM NaCl, 1 mM EDTA, 0.1% SDS, 1% Triton X-100, 0.1% sodium deoxycholate), and incubated with indicated antibody at 4°C overnight.
The preincubated samples were mixed with 30 μL protein A/G Dynabeads (blocked with 1 mg/mL salmon sperm DNA and 1 mg/mL bovine serum albumin) and rocked at 4°C for 6 hours. The Dynabeads were washed 7 times, once in RIPA-150, 2 times in RIPA-500 (50 mM Tris-HCl pH8.0, 500 mM NaCl, 1 mM EDTA pH8, 0.1% SDS, 1% Triton X-100, 0.1% sodium deoxycholate), 2 times in RIPA-LiCl (50 mM Tris-HCl pH8.0, 1 mM EDTA pH8, 1% Nonidet P-40, 0.7% sodium deoxycholate, 500 mM LiCl), and 2 times in TE buffer (10 mM Tris-HCl pH8.0, 1 mM EDTA). The beads were resuspended in 200 μL freshly made Direct Elution Buffer (10 mM Tris-HCl pH8.0, 300 mM NaCl, 5 mM EDTA, 0.5% sodium deoxycholate, containing 1 μL of RNase A) and incubated at 65°C overnight to reverse crosslink. After reverse crosslinking, 1 μL of protease K was added and the samples were incubated at 55°C for 1 hour. DNA was then purified and used for quantitative PCR analysis. The PCR primers for chromatin immunoprecipitation (ChIP) were as follows: IL27Ra-ChIP-F, 5′-GGCTCCCAGGGACAAGTGAC-3′; IL27Ra-ChIP-R, 5′-GGTTCAGTTCTGAGCATTTGCAC-3′.
Statistical analysis
Statistical analysis was made using Prism software (Prism, GraphPad Software Inc., San Diego, CA). Data are shown as mean ± standard error of the mean (SEM). Student t test (2-tailed unpaired) were used for comparisons (GraphPad Prism 5.0; ns, not significant). All experiments were repeated 2 or 3 times independently.
Results
IL27Ra serves as a marker for function-compromised HSCs with myeloid bias
To identify cytokine receptors upregulated in aged HSCs, we explored the Gene Expression Commons database28 and found 7 cytokine receptors, including Osmr, IL17Ra, IL1R1, IL12Rb1, IL4Ra, Csf3r, and IL27Ra (Figure 1A). However, when we used flow cytometric analysis to evaluate these receptors in young and aged HSCs (phenotypically marked by CD34− CD150+ c-Kit+ Sca1+ Lineage−, abbreviated as CD34− CD150+ KSL) isolated from 2- to 3- or 24- to 28-month-old mice, only IL27Ra was significantly upregulated in aged HSCs (Figure 1B). Then, HSCs were fractionated into 2 populations based on IL27Ra expression: IL27Ra+ CD34− CD150+ KSL and IL27Ra− CD34− CD150+ KSL (hereafter named IL27Ra+ HSCs and IL27Ra− HSCs) (supplemental Figure 1A). The total number of HSCs in 24- to 28-month-old mice is 11 times larger than that in 2-month-old mice, whereas the IL27Ra+ and IL27Ra− HSCs subpopulations are 23 and 5 times larger, respectively (Figure 1C). We did not detect the significant elevation of IL27Ra among any particular subpopulations of progenitor cells (eg, multipotent progenitor [MPP], cytidine 5′-monophosphate [CMP]) (Figure 1D), highlighting the specificity of IL27Ra to distinguish aged HSCs.
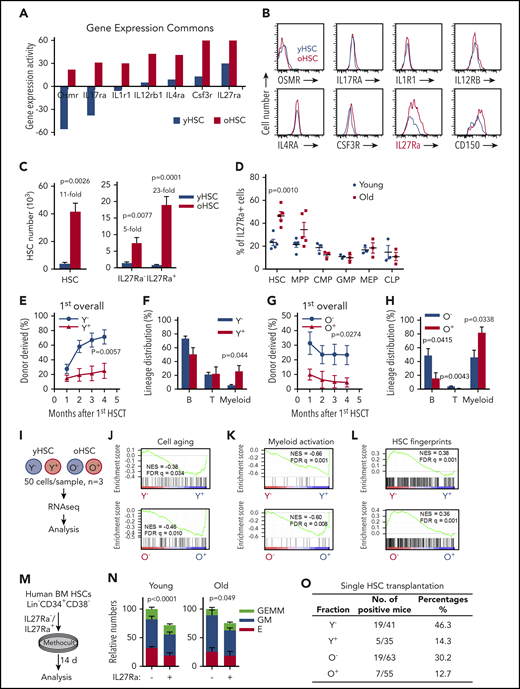
IL27Ra serves as a marker for function-compromised HSCs with myeloid bias. (A) The expression of indicated cytokine receptor between young (3 months) and aged (24-25 months) hematopoietic stem cells. (B) Representative plots from flow cytometry show the changes of indicated cytokine receptor on HSCs (Lineage− Sca1+ c-Kit+ CD150+ CD34−) from young (2 months) and aged (24-28 months) mice. (C) The left histogram depicts the number of HSCs and the right histogram depicts the number of IL27Ra+ HSCs and IL27Ra− HSCs between young (2 months) and aged mice (24-28 months). N = 5 mice per group, data are shown as mean ± SEM. (D) This scatterplot displays the percentage of IL27Ra+ cells in HSCs, MPPs, CMPs, common lymphoid progenitors (CLPs), megakaryocytic/erythroid progenitors (MEPs), and GMPs between young (2 months) and aged mice (24-28 months). N = 3-5 mice per group; data are shown as mean ± SEM. (E) The line plots depict the changes in peripheral blood chimerism in primary recipients transplanted with 10 IL27Ra− HSCs (defined as Y−, Young IL27Ra− HSC) or 10 IL27Ra+ HSCs (defined as Y+, Young IL27Ra+ HSC) freshly isolated from young (2 months) mice together with 2 × 10⁵ competitor cells. Engraftment was examined at the indicated time points after transplantation. N = 7-8 mice per group; data are shown as mean ± SEM. (F) This histogram depicts the lineage distribution of myeloid cell, B cell, and T cell among donor-derived cells in peripheral blood 4 months after 10 young IL27Ra− HSCs (Y−) or 10 young IL27Ra+ HSCs (Y+) transplantation. N = 7-8 mice per group; data are shown as mean ± SEM. (G) The line plots depict the changes in peripheral blood chimera in primary recipients transplanted with 100 IL27Ra− HSCs (defined as O−, Old IL27Ra− HSC) or 100 IL27Ra+ HSCs (defined as O+, Old IL27Ra+ HSC) freshly isolated from 28-month-old mice together with 2 × 10⁵ competitor cells. Engraftment was examined at the indicated time points after transplantation. N = 4-5 mice per group; data are shown as mean ± SEM. (H) This histogram depicts the lineage distribution of myeloid cell, B cell, and T cell among donor-derived cells in peripheral blood 4 months after 100 old IL27Ra− HSCs (O−) or 100 old IL27Ra+ HSCs (O+) transplantation. N = 4-5 mice per group; data are shown as mean ± SEM. (I) Experimental design for RNA-sequencing assay (see Methods). (J-L) These figures show the GSEA of cell aging-related genes, HSC fingerprints or neutrophil activation-related genes in Y− (Young IL27Ra− HSC) vs Y+ (Young IL27Ra+ HSC), or O− (Old IL27Ra− HSC) vs O+ (Old IL27Ra+ HSC). NES, normalized enrichment score; FDR-adjusted q values are provided. |NES| > 0.3 and q < 0.05 represent significant difference. (M) Experimental design of colony-forming assay for human HSCs (Lin− CD34+ CD38−). Two hundred freshly isolated IL27Ra− HSCs or IL27Ra+ HSCs from either young healthy people (ages 20, 22, and 29) or aged healthy people (ages 59, 61, and 63) were seeded in methylcellulose medium, and the colonies were counted 14 days later (see details in Methods). (N) This histogram shows the relative colony-forming capacity of human IL27Ra− and IL27Ra+ HSCs. GEMM, granulocyte, erythroid, macrophage, and megakaryocyte; GM, Colony-forming unit-granulocyte and macrophage; E, Burst-forming unit-erythroid and colony-forming unit erythroid. N = 3 individuals per group, clone numbers are normalized to IL27Ra− total numbers in each experiment, data are pooled from 3 independent experiments and shown as mean ± SEM; original data and calculation process are shown in supplemental Table 4. (O) This table depicts the percentage of successful long-term reconstitution in single HSC transplantation assay. Single IL27Ra− or IL27Ra+ HSC (KSL CD150+CD34−) from either young (2 months) or aged (24-28 months) mice was transplanted into lethally irradiated recipients (the number is indicated in the table) together with 2 × 10⁵ competitor cells. Peripheral blood of recipient mice was analyzed 4 to 5 months after transplantation. If the chimera was 0.05% or more after transplantation, regardless of which lineage was reconstituted, mice were considered to be reconstituted with test donor cells.
IL27Ra serves as a marker for function-compromised HSCs with myeloid bias. (A) The expression of indicated cytokine receptor between young (3 months) and aged (24-25 months) hematopoietic stem cells. (B) Representative plots from flow cytometry show the changes of indicated cytokine receptor on HSCs (Lineage− Sca1+ c-Kit+ CD150+ CD34−) from young (2 months) and aged (24-28 months) mice. (C) The left histogram depicts the number of HSCs and the right histogram depicts the number of IL27Ra+ HSCs and IL27Ra− HSCs between young (2 months) and aged mice (24-28 months). N = 5 mice per group, data are shown as mean ± SEM. (D) This scatterplot displays the percentage of IL27Ra+ cells in HSCs, MPPs, CMPs, common lymphoid progenitors (CLPs), megakaryocytic/erythroid progenitors (MEPs), and GMPs between young (2 months) and aged mice (24-28 months). N = 3-5 mice per group; data are shown as mean ± SEM. (E) The line plots depict the changes in peripheral blood chimerism in primary recipients transplanted with 10 IL27Ra− HSCs (defined as Y−, Young IL27Ra− HSC) or 10 IL27Ra+ HSCs (defined as Y+, Young IL27Ra+ HSC) freshly isolated from young (2 months) mice together with 2 × 10⁵ competitor cells. Engraftment was examined at the indicated time points after transplantation. N = 7-8 mice per group; data are shown as mean ± SEM. (F) This histogram depicts the lineage distribution of myeloid cell, B cell, and T cell among donor-derived cells in peripheral blood 4 months after 10 young IL27Ra− HSCs (Y−) or 10 young IL27Ra+ HSCs (Y+) transplantation. N = 7-8 mice per group; data are shown as mean ± SEM. (G) The line plots depict the changes in peripheral blood chimera in primary recipients transplanted with 100 IL27Ra− HSCs (defined as O−, Old IL27Ra− HSC) or 100 IL27Ra+ HSCs (defined as O+, Old IL27Ra+ HSC) freshly isolated from 28-month-old mice together with 2 × 10⁵ competitor cells. Engraftment was examined at the indicated time points after transplantation. N = 4-5 mice per group; data are shown as mean ± SEM. (H) This histogram depicts the lineage distribution of myeloid cell, B cell, and T cell among donor-derived cells in peripheral blood 4 months after 100 old IL27Ra− HSCs (O−) or 100 old IL27Ra+ HSCs (O+) transplantation. N = 4-5 mice per group; data are shown as mean ± SEM. (I) Experimental design for RNA-sequencing assay (see Methods). (J-L) These figures show the GSEA of cell aging-related genes, HSC fingerprints or neutrophil activation-related genes in Y− (Young IL27Ra− HSC) vs Y+ (Young IL27Ra+ HSC), or O− (Old IL27Ra− HSC) vs O+ (Old IL27Ra+ HSC). NES, normalized enrichment score; FDR-adjusted q values are provided. |NES| > 0.3 and q < 0.05 represent significant difference. (M) Experimental design of colony-forming assay for human HSCs (Lin− CD34+ CD38−). Two hundred freshly isolated IL27Ra− HSCs or IL27Ra+ HSCs from either young healthy people (ages 20, 22, and 29) or aged healthy people (ages 59, 61, and 63) were seeded in methylcellulose medium, and the colonies were counted 14 days later (see details in Methods). (N) This histogram shows the relative colony-forming capacity of human IL27Ra− and IL27Ra+ HSCs. GEMM, granulocyte, erythroid, macrophage, and megakaryocyte; GM, Colony-forming unit-granulocyte and macrophage; E, Burst-forming unit-erythroid and colony-forming unit erythroid. N = 3 individuals per group, clone numbers are normalized to IL27Ra− total numbers in each experiment, data are pooled from 3 independent experiments and shown as mean ± SEM; original data and calculation process are shown in supplemental Table 4. (O) This table depicts the percentage of successful long-term reconstitution in single HSC transplantation assay. Single IL27Ra− or IL27Ra+ HSC (KSL CD150+CD34−) from either young (2 months) or aged (24-28 months) mice was transplanted into lethally irradiated recipients (the number is indicated in the table) together with 2 × 10⁵ competitor cells. Peripheral blood of recipient mice was analyzed 4 to 5 months after transplantation. If the chimera was 0.05% or more after transplantation, regardless of which lineage was reconstituted, mice were considered to be reconstituted with test donor cells.
We performed competitive transplantation assays to evaluate the function of IL27Ra+ and IL27Ra− HSCs in young and aged mice. IL27Ra− and IL27Ra+ HSCs were freshly isolated and injected together with competitor cells into lethally irradiated recipients (supplemental Figure 1B). The reconstitution capacity of the IL27Ra− HSCs was significantly higher than that of IL27Ra+ HSCs in both young (71.2% ± 9.7% vs 30.1% ± 11.1%) and aged mice (23.3% ± 6.5% vs 4.6% ± 3.1%) (Figure 1E,G). Moreover, IL27Ra+ HSCs exhibited myeloid lineage bias (Figure 1F,H). We analyzed the composition of donor-derived HSCs of recipients at the end of the fourth month, we found that both young and aged IL27Ra+ HSCs and IL27Ra− HSCs can transform each other (supplemental Figure 1C). Previous studies showed that CD150 can be used as a marker to distinguish myeloid- and lymphoid-biased HSCs,29 we changed the gating strategy (supplemental Figure 1D) and found that there is a higher proportion of CD150high cells in the IL27Ra+ CD34− KSL population compared with IL27Ra− CD34− KSL population in both young and aged mice (supplemental Figure 1E). Notably, a previous study showed that CD41 marks myeloid-biased HSCs and increases with aging.30 We therefore stained against both CD41 and IL27Ra to exclude the possibility that CD41 and IL27Ra may mark the same population (supplemental Figure 1F). All of these results indicated that IL27Ra can apparently distinguish among different HSC subpopulations.
To further investigate the differences between IL27Ra− and IL27Ra+ HSCs, we performed RNA sequencing for those cells isolated from young and aged mice (Figure 1I; supplemental Table 1). We generated PCA plots for all samples (supplemental Figure 1G). In the PCA plots, the YN samples are not well grouped, which may indicate that young IL27Ra− HSCs are heterogeneous, but the other 3 groups (YP, ON, OP) are well grouped. GSEA showed that, in both young and aged mice, cell aging and myeloid activation-related genes were enriched in IL27Ra+ HSCs (Figure 1J-K). Moreover, HSC fingerprint genes31 were enriched among IL27Ra− HSCs in both young and aged mice (Figure 1L). Interestingly, parallel experiments with human HSCs marked by Lineage− CD34+ CD38− also fall into 2 subpopulations: IL27Ra+ and IL27Ra− HSCs (supplemental Figure 1H). And, the percentage of IL27Ra+ HSCs was significantly increased in aged human HSCs (supplemental Figure 1H-I). Colony-forming assays indicated that human IL27Ra− HSCs from both young and aged people generated more colonies than IL27Ra+ HSCs (Figure 1M-N; supplemental Table 4), thereby defining IL27Ra can be used to purify functionally different human HSCs.
To further test whether combining IL27Ra with other markers could yield highly enriched HSCs, we transplanted either single IL27Ra− or IL27Ra+ HSC derived from young or aged mice together with competitor cells into lethally irradiated recipient mice. Our results showed that 46.3% of IL27Ra− HSCs isolated from young mice displayed long-term multilineage reconstitution capacity, in contrast to only 14.3% of IL27Ra+ HSCs (Figure 1O; supplemental Figure 1J). Very similar results were observed for HSCs derived from aged mice (Figure 1O; supplemental Figure 1J). Collectively, these data revealed that IL27Ra+ HSCs exhibited compromised reconstitution capacity and differentiation bias toward the myeloid lineage.
IL27Ra− HSCs possess higher self-renewal activity and targeted deletion of IL27Ra ameliorates HSC function
We next conducted secondary transplantation assay using bone marrow cells from primary recipients to evaluate the self-renewal activity of IL27Ra− and IL27Ra+ HSCs. Chimeric peripheral blood from secondary recipients was analyzed every month and revealed that both IL27Ra− and IL27Ra+ HSCs from young mice were successfully engrafted and had long-term multilineage reconstitution capacity, which indicates that both of them are long-term HSCs (Figure 2A-B). However, the young IL27Ra− HSCs displayed a stronger self-renewal capacity than the IL27Ra+ HSCs. In aged mice, IL27Ra− HSCs yielded long-term reconstitution capacity in secondary transplant, whereas IL27Ra+ HSCs were almost undetectable (Figure 2C), suggesting the self-renewal capacity of IL27Ra+ HSCs from aged mice is limited and this population is prone to myeloid differentiation in response to replication stress (Figure 2D).
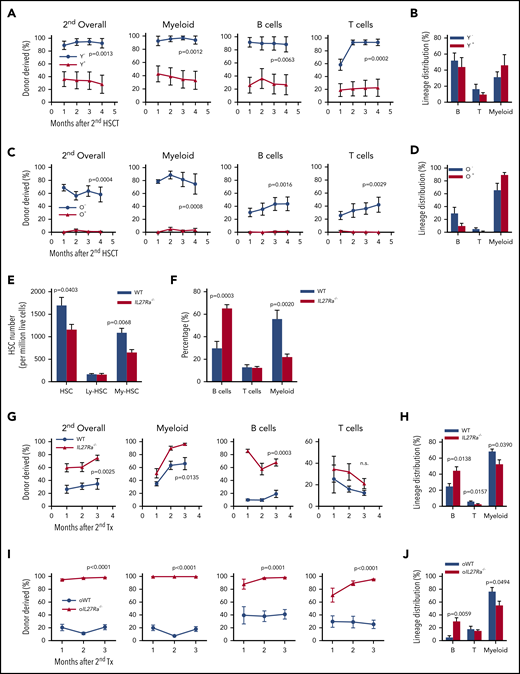
IL27Ra−HSCs and IL27Ra−/− HSCs possess higher self-renewal capacity. (A,C) The percentage of indicated donor-derived cells (overall, myeloid cell, B cell, T cell) in secondary recipients at indicated timepoints (see Methods). (A) N = 8 mice per group, (C) N = 5-6 mice per group; data are shown as mean ± SEM. The gating strategy to generate these line plots are presented in supplemental Figure 1K. (B,D) The lineage distribution of indicated donor-derived peripheral blood cells of secondary recipients at the fourth month. (B) N = 8 mice per group, (D) N = 5-6 mice per group; data are shown as mean ± SEM. The gating strategy to generate these line plots are presented in supplemental Figure 1L. (E) Five 23- to 28-month-old IL27Ra−/− and 6 age-matched WT mice were analyzed for HSCs. This histogram depicts the number of HSCs (CD34− CD150+ KSL), lymphoid-biased HSCs (CD34− CD150middle KSL), and myeloid-biased HSCs (CD34− CD150high KSL) per million bone marrow cells. Data are shown as mean ± SEM. (F) Seven 20- 24-month-old IL27Ra−/− and 8 age-matched WT mice were analyzed for myeloid, B, and T cells. This histogram depicts the percentage of myeloid, B, and T cells in peripheral blood. Data are shown as mean ± SEM. (G-J) Freshly isolated 50 HSCs from either (G-H) 2-month-old IL27Ra−/− mice and age-matched WT mice or (I-J) 18-month-old IL27Ra−/− mice and age-matched WT mice were transplanted into lethally irradiated recipients together with 2 × 10⁵ competitor cells. Three months after transplantation, 2 million bone marrow cells of primary recipients were transplanted into secondary recipients. Chimera in peripheral blood was checked every month until the third month. (G,I) These line plots depict the percentage of donor cell reconstitution in overall (CD45.2+), myeloid (Mac-1+), B (B220+), and T (CD3+) cell every month after transplantation. (H,J) This histogram displays the lineage distribution of donor-derived peripheral blood at the third month. (G-H) N = 5 mice per group, (I-J) N = 5-7 mice per group; data are shown as mean ± SEM.
IL27Ra−HSCs and IL27Ra−/− HSCs possess higher self-renewal capacity. (A,C) The percentage of indicated donor-derived cells (overall, myeloid cell, B cell, T cell) in secondary recipients at indicated timepoints (see Methods). (A) N = 8 mice per group, (C) N = 5-6 mice per group; data are shown as mean ± SEM. The gating strategy to generate these line plots are presented in supplemental Figure 1K. (B,D) The lineage distribution of indicated donor-derived peripheral blood cells of secondary recipients at the fourth month. (B) N = 8 mice per group, (D) N = 5-6 mice per group; data are shown as mean ± SEM. The gating strategy to generate these line plots are presented in supplemental Figure 1L. (E) Five 23- to 28-month-old IL27Ra−/− and 6 age-matched WT mice were analyzed for HSCs. This histogram depicts the number of HSCs (CD34− CD150+ KSL), lymphoid-biased HSCs (CD34− CD150middle KSL), and myeloid-biased HSCs (CD34− CD150high KSL) per million bone marrow cells. Data are shown as mean ± SEM. (F) Seven 20- 24-month-old IL27Ra−/− and 8 age-matched WT mice were analyzed for myeloid, B, and T cells. This histogram depicts the percentage of myeloid, B, and T cells in peripheral blood. Data are shown as mean ± SEM. (G-J) Freshly isolated 50 HSCs from either (G-H) 2-month-old IL27Ra−/− mice and age-matched WT mice or (I-J) 18-month-old IL27Ra−/− mice and age-matched WT mice were transplanted into lethally irradiated recipients together with 2 × 10⁵ competitor cells. Three months after transplantation, 2 million bone marrow cells of primary recipients were transplanted into secondary recipients. Chimera in peripheral blood was checked every month until the third month. (G,I) These line plots depict the percentage of donor cell reconstitution in overall (CD45.2+), myeloid (Mac-1+), B (B220+), and T (CD3+) cell every month after transplantation. (H,J) This histogram displays the lineage distribution of donor-derived peripheral blood at the third month. (G-H) N = 5 mice per group, (I-J) N = 5-7 mice per group; data are shown as mean ± SEM.
These results provide conformation that IL27Ra distinguishes HSCs with different function. We next set out to determine whether deletion of IL27Ra affects HSC function. We observed no obvious phenotypic differences between the blood systems of young IL27Ra−/− and WT mice (supplemental Figure 2A-E); however, aged IL27Ra−/− mice displayed reduced HSC number, and this reduction mainly involved myeloid-biased HSCs (CD150hi CD34lo KSL) (Figure 2E). Importantly, aged IL27Ra−/− mice did not exhibit the biased myeloid differentiation of aged WT mice (Figure 2F). To further evaluate the function of IL27Ra−/− HSCs, we conducted competitive transplantation assays and found no significant differences in the function of HSCs between young or aged IL27Ra−/− and WT in primary recipients (supplemental Figure 2F-I). However, in secondary recipients, both young and aged IL27Ra−/− HSCs displayed significantly increased long-term multilineage reconstitution capacity (Figure 2G-J), highlighting the enhanced self-renewal activity of IL27Ra−/− HSCs. Moreover, deletion of IL27Ra rescued the differentiation skewing to myeloid lineages in secondary recipients (Figure 2H,J). In brief, aging-induced IL27Ra limits the self-renewal activity of HSCs and leads to differentiation bias of HSCs toward the myeloid lineage and targeted deletion of IL27Ra ameliorates the function of HSCs in serial transplantation assay.
Transcription factors NF-κB p65 and ETS1 regulates IL27Ra expression
We next sought to identify factor(s) regulating IL27Ra expression. We performed luciferase reporter assays and found that the region located from position (−) 75 bp to (−) 120-bp upstream of the translation start site has a regulatory function controlling the transcription of IL27Ra (Figure 3A). In silico analysis predicted that several transcriptional factors likely bind to this region, including ETS1, NF-κB p65, STAT1, STAT3, STAT6, and NF-κB1 (supplemental Figure 3A); notably, we found that each of these transcriptional factors were upregulated in aged HSCs in the Gene Expression Commons database.28 We cloned all of these candidate transcription factors into the pGL3-Basic vector and performed additional luciferase reporter assays with the aforementioned regulatory region of the IL27Ra promoter, and showed that both NF-κB p65 and ETS1 are able to activate transcriptional activity (Figure 3B-C; supplemental Table 2). To exclude any indirect binding effects, we performed ChIP assays and found that NF-κB p65 and ETS1 bind directly to the regulatory region of IL27Ra promoter (supplemental Figure 3B-C). Furthermore, we mutated the predicted binding regions of NF-κB p65 and ETS1 and thereby blocked their transcriptional activity correspondingly (Figure 3D-E; supplemental Figure 3D).
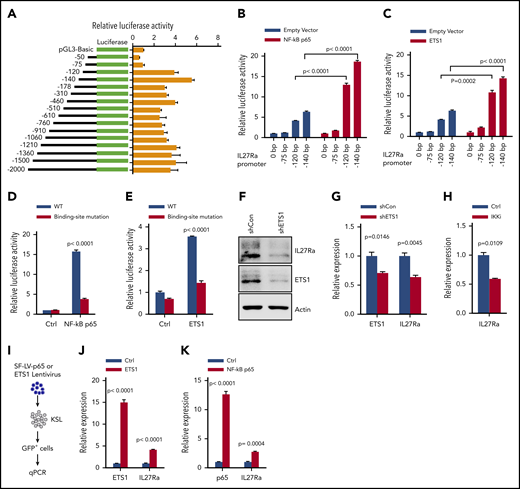
ETS1 and NF-κB p65 are the key transcriptional factors regulating IL27Ra expression. (A) The transcriptional activity analysis of the truncated constructs in the IL27Ra promoter region by luciferase assay (see Methods). Data are shown as mean ± SEM. (B-C) Histograms showing the transcriptional activity of IL27Ra upon overexpression of (B) NF-κB p65 and (C) ETS1 by luciferase assay. Data are shown as mean ± SEM. (D) This histogram displays the IL27Ra promoter-mutation (the sequence GGGA was mutated to TTTT within the predicted NF-kB p65 binding sites) abolishes the NF-κB p65 induced IL27Ra transcription by luciferase assay (supplemental Figure 3D; supplemental Methods). Data are shown as mean ± SEM. (E) The IL27Ra promoter-mutation (the sequence CCCTGAAGG was mutated to AAAAAGGTT within the predicted ETS1 binding sites) abolishes the ETS1 induced IL27Ra transcription by luciferase assay (supplemental Figure 3D; supplemental Methods). Data are shown as mean ± SEM. (F-G) Freshly isolated KSL cells were infected by lentivirus carrying ETS1 shRNA or scramble control, and 3 days later, 105 GFP+ cells were purified for western blot and quantitative PCR to evaluate the expression of ETS1 and IL27Ra. (F) Representative western blot showing the expression of ETS1 and IL27Ra, (G) This histogram depicts the expression of ETS1 and IL27Ra. Data are shown as mean ± SEM. (H) This histogram displays the expression of IL27Ra in KSL cells in response to IKK inhibitor (2 μM TPCA-1, 8 days) treatment. Data are shown as mean ± SEM. (I-K) Freshly isolated KSL cells were infected by lentivirus overexpressing ETS1 or NF-κB p65. GFP+ cells were purified 4 days after infection, and were subjected to reverse transcriptase-PCR. (I) Experimental design to evaluate the effect of overexpressed ETS1 or NF-κB p65 on IL27Ra. (J) This histogram depicts the messenger RNA expression of Ets1 and IL27Ra in response to ETS1 overexpression, (K) This histogram depicts the messenger RNA expression of NF-κB p65 and IL27Ra in response to NF-κB p65 overexpression. Data are shown as mean ± SEM.
ETS1 and NF-κB p65 are the key transcriptional factors regulating IL27Ra expression. (A) The transcriptional activity analysis of the truncated constructs in the IL27Ra promoter region by luciferase assay (see Methods). Data are shown as mean ± SEM. (B-C) Histograms showing the transcriptional activity of IL27Ra upon overexpression of (B) NF-κB p65 and (C) ETS1 by luciferase assay. Data are shown as mean ± SEM. (D) This histogram displays the IL27Ra promoter-mutation (the sequence GGGA was mutated to TTTT within the predicted NF-kB p65 binding sites) abolishes the NF-κB p65 induced IL27Ra transcription by luciferase assay (supplemental Figure 3D; supplemental Methods). Data are shown as mean ± SEM. (E) The IL27Ra promoter-mutation (the sequence CCCTGAAGG was mutated to AAAAAGGTT within the predicted ETS1 binding sites) abolishes the ETS1 induced IL27Ra transcription by luciferase assay (supplemental Figure 3D; supplemental Methods). Data are shown as mean ± SEM. (F-G) Freshly isolated KSL cells were infected by lentivirus carrying ETS1 shRNA or scramble control, and 3 days later, 105 GFP+ cells were purified for western blot and quantitative PCR to evaluate the expression of ETS1 and IL27Ra. (F) Representative western blot showing the expression of ETS1 and IL27Ra, (G) This histogram depicts the expression of ETS1 and IL27Ra. Data are shown as mean ± SEM. (H) This histogram displays the expression of IL27Ra in KSL cells in response to IKK inhibitor (2 μM TPCA-1, 8 days) treatment. Data are shown as mean ± SEM. (I-K) Freshly isolated KSL cells were infected by lentivirus overexpressing ETS1 or NF-κB p65. GFP+ cells were purified 4 days after infection, and were subjected to reverse transcriptase-PCR. (I) Experimental design to evaluate the effect of overexpressed ETS1 or NF-κB p65 on IL27Ra. (J) This histogram depicts the messenger RNA expression of Ets1 and IL27Ra in response to ETS1 overexpression, (K) This histogram depicts the messenger RNA expression of NF-κB p65 and IL27Ra in response to NF-κB p65 overexpression. Data are shown as mean ± SEM.
To further demonstrate the regulatory function of NF-κB p65 and ETS1 on IL27Ra, we conducted gain-of-function and loss-of-function assays. First, we knockdown Ets1 by shRNA in KSL cells and found that the expression of IL27Ra decreased significantly (Figure 3F-G; supplemental Table 2). TPCA-1 is a validated inhibitor of IKK2 and is frequently used to block NF-κB p65 activity.32 When KSL cells were treated with TPCA-1, IL27Ra expression decreased significantly (Figure 3H). We then overexpressed NF-κB p65 and ETS1 individually in KSL cells and found that IL27Ra expression increased in both cases (Figure 3I-K; supplemental Figure 3E-F). Then, these data indicated that NF-κB p65 and ETS1 are the main factors transcribing IL27Ra.
Aging-related increase of TNF-α induces IL27Ra via ERK-ETS1 pathway
We next investigated the mechanism contributing to the increase of IL27Ra during aging. By comparing both young and aged hematopoietic stem and progenitor cell-enriched populations, we found that phosphorylated-ERK (p-ERK), ETS1and IL27Ra increased with aging, but NF-κB p65 remained static (Figure 4A-C). Furthermore, we detected increased p-ERK and ETS1 in aged IL27Ra+ KSL cells (Figure 4D). These data indicate that ERK-ETS1 signaling, but not NF-κB p65, is the key factor involved in the induction of IL27Ra expression during aging.
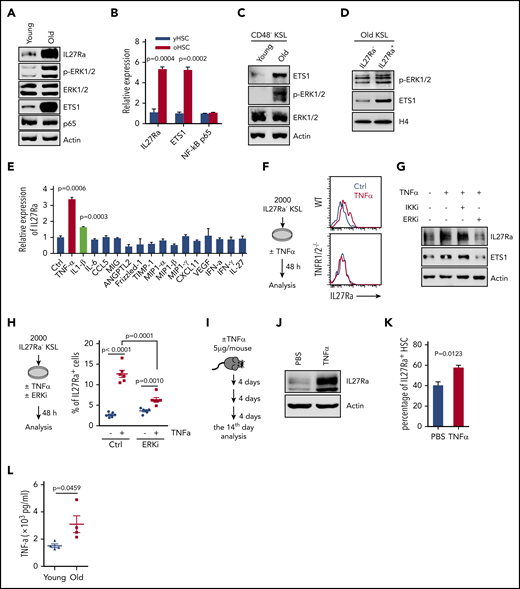
Proinflammatory cytokine TNF-α induces the expression of IL27Ra on HSCs via the ERK-ETS1 pathway. (A) Representative western blots showing the expression of IL27Ra, p-ERK, ERK, ETS1, and NF-κB p65 expression in young (2 months) and aged (28 months) hematopoietic stem and progenitor (c-Kit+) cells. (B) The histogram displays the expression of IL27Ra, Ets1, and NF-κB p65 in young HSCs (yHSC, 2 months) and aged HSCs (oHSC, 24 months). Data are shown as mean ± SEM. (C) Representative western blots showing the expression of ETS1, p-ERK, and ERK in young and aged HSCs. Freshly isolated 15 000 CD48− KSL cells from young (2 months) or aged (24 months) mice were lysed in SDS loading buffer. Western blot analysis was performed with indicated antibodies. (D) Representative western blots showing the expression of p-ERK and ETS1 in IL27Ra− or IL27Ra+ KSL cells from aged mice (26 months). Cells were sorted by flow cytometry and lysed in 2× SDS loading buffer. Lysis was completed by sonication and denatured by boiling. A total of 20 000 cells were used to detect p-ERK1/2 and ETS1. (E) The histogram displays the expression of IL27Ra expression in response to indicated cytokine stimulation (5 hours). Data are shown as mean ± SEM. (F) The schematic diagram (left) showing the experimental design to evaluate the influence of TNF-α on IL27Ra expression. The representative plots (right) showing the activation of IL27Ra in response to TNF-α stimulation. (G) Representative western blots showing the expression of IL27Ra and ETS1 in hematopoietic stem and progenitor cells in response to TNF-α ± ERKi ± IKKi treatment. c-Kit+ cells were either mock treated or treated with 50 ng/mL TNF-α for 24 hours in the presence or absence of 2 μM IKK inhibitor (IKKi, TPCA-1) or 10 μM ERK inhibitor (ERKi, PD98059). Western blot analysis was performed with indicated antibodies. (H) The schematic diagram (left) showing the experimental design to evaluate the influence of TNF-α ± ERKi on IL27Ra expression in vitro. The scatter plots (right) depict the percentage of IL27Ra+ cells upon TNF-α ± ERKi stimulation (50 ng/mL, 48 hours). Data are shown as mean ± SEM. (I-K) The schematic diagram showing the experimental design to evaluate the influence of TNF-α on IL27Ra expression in vivo. (I) Three 2-month-old WT mice were administered with TNF-α (5 μg/mouse, intraperitoneal injection) every 4 days. At the 14th day, mice were analyzed. (J) Representative western blots showing the expression of IL27Ra in response to TNF-α administration. (K) The percentage of IL27Ra+ HSCs in response to TNF-α administration. N = 3 mice per group. Data are shown as mean ± SEM. (L) The scatter plots depict the level of TNF-α in the bone marrow plasma from young (2 months) and old (24-28 months) mice. Data are shown as mean ± SEM.
Proinflammatory cytokine TNF-α induces the expression of IL27Ra on HSCs via the ERK-ETS1 pathway. (A) Representative western blots showing the expression of IL27Ra, p-ERK, ERK, ETS1, and NF-κB p65 expression in young (2 months) and aged (28 months) hematopoietic stem and progenitor (c-Kit+) cells. (B) The histogram displays the expression of IL27Ra, Ets1, and NF-κB p65 in young HSCs (yHSC, 2 months) and aged HSCs (oHSC, 24 months). Data are shown as mean ± SEM. (C) Representative western blots showing the expression of ETS1, p-ERK, and ERK in young and aged HSCs. Freshly isolated 15 000 CD48− KSL cells from young (2 months) or aged (24 months) mice were lysed in SDS loading buffer. Western blot analysis was performed with indicated antibodies. (D) Representative western blots showing the expression of p-ERK and ETS1 in IL27Ra− or IL27Ra+ KSL cells from aged mice (26 months). Cells were sorted by flow cytometry and lysed in 2× SDS loading buffer. Lysis was completed by sonication and denatured by boiling. A total of 20 000 cells were used to detect p-ERK1/2 and ETS1. (E) The histogram displays the expression of IL27Ra expression in response to indicated cytokine stimulation (5 hours). Data are shown as mean ± SEM. (F) The schematic diagram (left) showing the experimental design to evaluate the influence of TNF-α on IL27Ra expression. The representative plots (right) showing the activation of IL27Ra in response to TNF-α stimulation. (G) Representative western blots showing the expression of IL27Ra and ETS1 in hematopoietic stem and progenitor cells in response to TNF-α ± ERKi ± IKKi treatment. c-Kit+ cells were either mock treated or treated with 50 ng/mL TNF-α for 24 hours in the presence or absence of 2 μM IKK inhibitor (IKKi, TPCA-1) or 10 μM ERK inhibitor (ERKi, PD98059). Western blot analysis was performed with indicated antibodies. (H) The schematic diagram (left) showing the experimental design to evaluate the influence of TNF-α ± ERKi on IL27Ra expression in vitro. The scatter plots (right) depict the percentage of IL27Ra+ cells upon TNF-α ± ERKi stimulation (50 ng/mL, 48 hours). Data are shown as mean ± SEM. (I-K) The schematic diagram showing the experimental design to evaluate the influence of TNF-α on IL27Ra expression in vivo. (I) Three 2-month-old WT mice were administered with TNF-α (5 μg/mouse, intraperitoneal injection) every 4 days. At the 14th day, mice were analyzed. (J) Representative western blots showing the expression of IL27Ra in response to TNF-α administration. (K) The percentage of IL27Ra+ HSCs in response to TNF-α administration. N = 3 mice per group. Data are shown as mean ± SEM. (L) The scatter plots depict the level of TNF-α in the bone marrow plasma from young (2 months) and old (24-28 months) mice. Data are shown as mean ± SEM.
Given that ERK-ETS1 signaling regulates gene expression in response to inflammatory cytokines,33,34 we then explored which cytokines released from aged bone marrow induce IL27Ra expression, perhaps via the ERK-ETS1 cascade. First, we set out to investigate the influence of IL27, a ligand of IL27Ra, on IL27Ra expression. We stimulated IL27Ra− HSCs with IL-27 and observed no effect on IL27Ra expression but induction of the positive control Sca135 (supplemental Figure 4A). Moreover, in light of a previous study reporting that IL-27 overexpression enhances myelopoiesis at the expense of lymphopoiesis,36,37 we examined IL-27 expression levels in peripheral blood and bone marrow aspirates but observed no differences between young vs aged mice (supplemental Figure 4B), a result clearly suggesting that IL-27 does not contribute to the observed increase in IL27Ra levels that occurs with aging.
We next conducted cytokine array assays with young and aged bone marrow aspirates and found that levels of several pro-inflammatory cytokines were upregulated in aged bone marrow (supplemental Figure 4C). To identify the cytokines involved in the promotion of IL27Ra expression in aged HSCs, we stimulated KSL cells with individual cytokine and found that TNF-α and IL-1β were able to induce IL27Ra expression (Figure 4E). To further confirm this result, we freshly isolated 2000 IL27Ra− KSL cells from WT mice and treated them with either TNF-α or IL-1β for 48 hours. We observed that the percentage of IL27Ra+ cells was significantly increased in both cases (Figure 4F; supplemental Figure 4D-E). Moreover, the increase of IL27Ra+ cells induced by TNF-α was blocked by targeted deletion of the TNF-α receptor (TNFR1/2−/−; supplemental Figure 4F), indicating that IL-1β, the TNF-α, and its receptor mediate the induction of IL27Ra expression.
To determine whether the IL27Ra-inducing effect of TNF-α and IL-1β is mediated by ERK-ETS1 or NF-κB p65 signaling, we used an ERK inhibitor (PD98059) and an NF-κB p65 inhibitor (TPCA-1) to block ERK-ETS1 or NF-κB p65 activity.38 We treated c-Kit+ bone marrow cells with various combinations of TNF-α, IL-1β, and the ERK inhibitor or NF-κB p65 inhibitor. These experiments revealed that ETS1 and IL27Ra was induced in response to TNF-α stimulation, and we found that this induction was inhibited by treatment with an ERK inhibitor but not an NF-κB p65 inhibitor (Figure 4G). In addition, the induction of IL27Ra by IL-1β was blocked by chemical inhibition of NF-κB p65 but not ERK (supplemental Figure 4G-J). Because IL-1β induces IL27Ra through NF-κB p65, and considering that NF-κB p65 is not activated in aged HSCs (Figure 4A-B), we can conclude that IL-1β does not directly induce IL27Ra in aged HSCs. We therefore focused our experiment efforts on TNF-α.
To further confirm the effect of the TNF-α–ERK cascade on IL27Ra induction, we stimulated 2000 IL27Ra− KSL cells with TNF-α, TNF-α, and ERK inhibitor, respectively, for 72 hours. This result revealed that the percentage of IL27Ra+ cells increased after TNF-α stimulation, but this effect was blunted when HSCs were cotreated with TNF-α and ERK inhibitor at the same time (Figure 4H). The inhibitory effect of ERK inhibitor on TNF-α–induced IL27Ra was not 100%, indicating that other molecular pathways downstream of TNF-α are apparently involved in the regulation of IL27Ra expression. We subsequently treated WT mice with TNF-α by intraperitoneal injection (once every 4 days) and found that TNF-α injection resulted in both activation of IL27Ra expression and an increase in the proportion of IL27Ra+ HSCs (Figure 4I-K), indicating that TNF-α induces IL27Ra expression in vivo. We then wonder whether blocking the secretion of TNF-α in aged mice would reserve the induction of IL27Ra in HSCs. To test this hypothesis, we treated 21-month-old WT mice with lenalidomide (10 mg/kg), a drug that inhibits TNF-α secretion,39 by intraperitoneal injection once every day. Ten days later, the proportion of IL27Ra+ HSCs were analyzed and we observed no difference in treated and control groups, indicating that the increase of IL27Ra cannot be reversed in aged mice (supplemental Figure 4K-L). To further evaluate the influence of TNF-α on IL27Ra induction, we sublethally irradiated young WT and TNF-α receptor knockout mice (TNFR 1/2−/−) to mimic the aging process. Two months later, all mice were analyzed and we observed that the percentage of IL27Ra+ HSCs increases in WT mice, but this increase is significantly inhibited in TNFR1/2−/−mice (supplemental Figure 4M). This result indicates that block of TNF-α–TNFR signaling at a young age may reduce IL27Ra elevation in HSCs and furthermore increase the function of HSCs. A previous study showing that TNFR1/2−/− HSCs possess enhanced self-renewal capacity confirms our hypothesis.25 Additionally, we found that the TNF-α level was significantly increased in the bone marrow of aged mice (Figure 4L). Taken together, these results indicate that ERK-ETS1 and NF-κB p65 signaling are collectively responsible for maintaining the proper IL27Ra level in young HSCs but that TNF-α–ERK–ETS1 signaling, which increases with aging, controls the increase in IL27Ra levels in aged HSCs (supplemental Figure 4N).
IL27Ra+ HSCs are inflamed and the pro-inflammatory cytokine TNF-α impairs HSC function via IL27Ra
TNF-α is a well-known pro-inflammatory cytokine and our study revealed that TNF-α increases with aging and induces the expression of IL27Ra in HSCs. We then set out to determine whether IL27Ra+ HSCs display any inflammatory signatures in comparison with IL27Ra− HSCs. To address this question, we analyzed IL27Ra+ and IL27Ra− HSCs isolated from young and aged mice by RNA sequencing, and found that inflammation-related genes were enriched in differentially expressed genes between IL27Ra+ and IL27Ra− HSCs in both young and aged mice (Figure 5A-B). We also performed PCA and Heatmap analysis of inflammatory-related genes for all samples (supplemental Table 1). These analyses show that all samples can be divided into 4 categories by using unsupervised clustering based on the expression levels of inflammation-related genes, which is consistent with the categories we have distinguished using age and IL27Ra as criteria (supplemental Figure 5A-B). Several genes previously reported to positively regulate the inflammation response, including Vcam1, Homx1, Lgals3, Fcgr3, C1qb, and C1qc,40-44 were activated in IL27Ra+ HSCs (Figure 5C-D; supplemental Table 1). When we compared gene expression levels between young and aged IL27Ra+ HSCs, we found that inflammation-related genes were enriched in aged IL27Ra+ HSCs (Figure 5E). These results suggest that both young and aged IL27Ra+ HSCs are inflamed and this situation becomes more pronounced with aging.
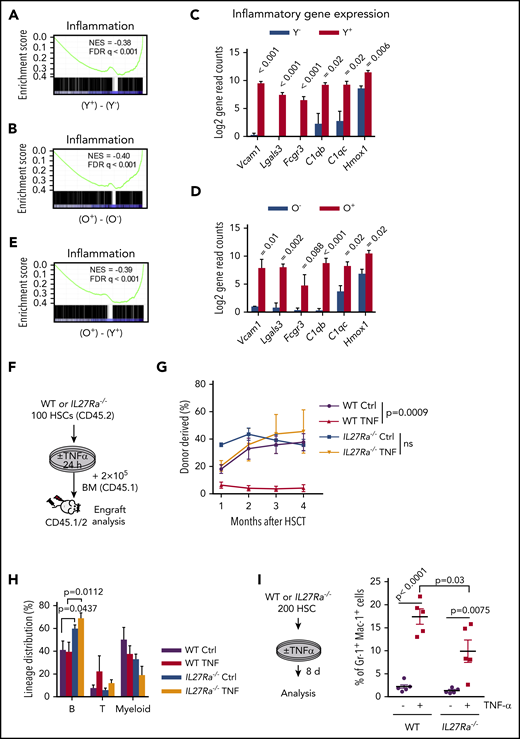
IL27Ra+ HSCs are inflamed and TNF-α impairs HSC function via IL27Ra pathway. (A-B) These figures show the GSEA of inflammation-related genes in (A) Y+ (Young IL27Ra+ HSC) vs Y− (Young IL27Ra− HSC) and (B) O+ (Old IL27Ra+ HSC) vs O− (Old IL27Ra− HSC). FDR adjusted q values are provided. |NES| >0.3 and q < 0.05 represent significant difference. (C-D) The histogram shows read counts of 6 genes in (C) Y− (Young IL27Ra− HSC) and Y+ (Young IL27Ra+ HSC) and (D) O− (Old IL27Ra− HSC) and O+ (Old IL27Ra+ HSC). Data are shown as mean ± SEM. (E) The figures show the GSEA of inflammation-related genes in O+ (Old IL27Ra+ HSC) vs Y+ (Young IL27Ra+ HSC). FDR adjusted q values are provided. |NES| >0.3 and q < 0.05 represent significant difference. (F-H) Freshly isolated 100 HSCs from WT or IL27Ra−/− mice were treated by TNF-α (50 ng/mL) or control for 24 hours and then were transplanted into lethally irradiated recipients together with 2 × 10⁵ competitor cells. Chimera in peripheral blood was evaluated every month until the fourth month. (F) Experimental design to evaluate HSC function in response to TNF-α treatment, (G) The line plots depict the peripheral blood chimera of recipients at the fourth month. N = 5-6 mice per group; data are shown as mean ± SEM. (H) This histogram depicts the lineage distribution of myeloid, B, and T cell 4 months after transplantation. Data are shown as mean ± SEM. (I) The schematic diagram showing the experimental design to evaluate the in vitro influence of TNF-α on myeloid differentiation in the context of IL27Ra status. The scatterplots depict the percentage of Gr1+Mac1+ cells upon TNF-α stimulation. Data are shown as mean ± SEM.
IL27Ra+ HSCs are inflamed and TNF-α impairs HSC function via IL27Ra pathway. (A-B) These figures show the GSEA of inflammation-related genes in (A) Y+ (Young IL27Ra+ HSC) vs Y− (Young IL27Ra− HSC) and (B) O+ (Old IL27Ra+ HSC) vs O− (Old IL27Ra− HSC). FDR adjusted q values are provided. |NES| >0.3 and q < 0.05 represent significant difference. (C-D) The histogram shows read counts of 6 genes in (C) Y− (Young IL27Ra− HSC) and Y+ (Young IL27Ra+ HSC) and (D) O− (Old IL27Ra− HSC) and O+ (Old IL27Ra+ HSC). Data are shown as mean ± SEM. (E) The figures show the GSEA of inflammation-related genes in O+ (Old IL27Ra+ HSC) vs Y+ (Young IL27Ra+ HSC). FDR adjusted q values are provided. |NES| >0.3 and q < 0.05 represent significant difference. (F-H) Freshly isolated 100 HSCs from WT or IL27Ra−/− mice were treated by TNF-α (50 ng/mL) or control for 24 hours and then were transplanted into lethally irradiated recipients together with 2 × 10⁵ competitor cells. Chimera in peripheral blood was evaluated every month until the fourth month. (F) Experimental design to evaluate HSC function in response to TNF-α treatment, (G) The line plots depict the peripheral blood chimera of recipients at the fourth month. N = 5-6 mice per group; data are shown as mean ± SEM. (H) This histogram depicts the lineage distribution of myeloid, B, and T cell 4 months after transplantation. Data are shown as mean ± SEM. (I) The schematic diagram showing the experimental design to evaluate the in vitro influence of TNF-α on myeloid differentiation in the context of IL27Ra status. The scatterplots depict the percentage of Gr1+Mac1+ cells upon TNF-α stimulation. Data are shown as mean ± SEM.
Previous study shows that TNF-α impairs HSC function.25 To investigate the role of IL27Ra in this process, we stimulated WT and IL27Ra−/− HSCs with TNF-α for 24 hours, and then injected them into lethally irradiated recipients together with competitor cells (Figure 5F). The result showed that deletion of IL27Ra in HSCs was able to rescue the inhibitory effects of TNF-α on HSCs (Figure 5G); however, TNF-α treatment did not skew HSC differentiation toward the myeloid lineage (Figure 5H). A possible reason for this could be that in vitro stimulation of TNF-α promotes the differentiation of HSCs into myeloid cells (Figure 5I), and the myeloid progenitor cells cannot be replenished because TNF-α limits the self-renewal capacity of HSCs. However, we noted that in vitro TNF-α–induced skewing of HSC differentiation was partially rescued in an IL27Ra-deficient setting (Figure 5I). Thus, the pro-inflammatory cytokine TNF-α deteriorates HSCs function via IL27Ra.
IL27Ra+ HSCs serve as a reservoir for myeloid-recovery upon inflammation
To further validate our findings that TNF-α activates IL27Ra in HSCs and that IL27Ra+ HSCs differentiate into the myeloid lineage to meet the demand for myeloid cells, we used an LPS-mediated inflammation model that has been reported to expand and injure HSCs.45,46 We intraperitoneally injected LPS (1 mg/kg) into WT and age-matched IL27Ra−/− mice. The number of myeloid cells in the peripheral blood of both WT and IL27Ra−/− mice peaked 24 hours later, whereas the numbers of both B and T cells reached their lowest level at this time point (Figure 6A-C). Moreover, we observed the opposite trend for myeloid progenitors in both WT and IL27Ra−/− mice: the numbers of both CMPs and granulocyte-macrophage progenitors (GMPs) were significantly decreased and were at their lowest level at 24 hours, suggesting that myeloid progenitors differentiate into myeloid cells in response to the body's LPS-induced increased demand for myeloid cells (Figure 6D-E).
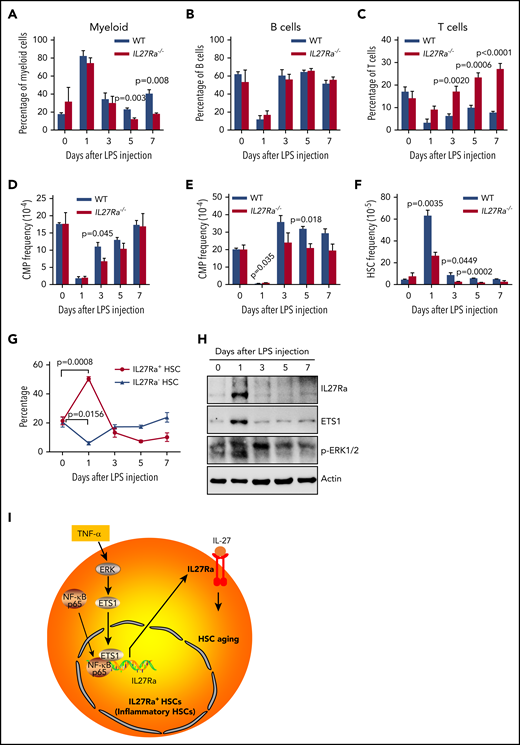
IL27Ra+ HSCs serves as a reservoir for myeloid recovery upon inflammation. (A-H) WT and IL27Ra−/− mice were injected with LPS (1 mg/kg) intraperitoneally, then the mice were analyzed at indicated time points (N = 3-5 mice per group for each time point, mice in day 0 are considered as control; data are shown as mean ± SEM.). (A-C) These histograms showing the percentage of (A) myeloid cell (CD11b+), (B) B cell (B220+), and (C) T cell (CD3+) in peripheral blood of WT and IL27Ra−/− mice at indicated time points. (D-F) These histograms showing the frequency of (D) CMP, (E) GMP, and (F) HSCs in bone marrow of WT and IL27Ra−/− mice at indicated time points. (G) This line plots depict the percentage of IL27Ra+ HSCs and IL27Ra− HSC in bone marrow of WT mice at indicated time points. (H) Representative western blots showing the expression of p-ERK, ETS1, and IL27Ra in cKit+ bone marrow cells of WT mice at indicated time points. (I) This chart illustrates the proposed model of inflammation-induced TNF-α→ERK→ETS1→IL27Ra promotes hematopoietic stem cell aging.
IL27Ra+ HSCs serves as a reservoir for myeloid recovery upon inflammation. (A-H) WT and IL27Ra−/− mice were injected with LPS (1 mg/kg) intraperitoneally, then the mice were analyzed at indicated time points (N = 3-5 mice per group for each time point, mice in day 0 are considered as control; data are shown as mean ± SEM.). (A-C) These histograms showing the percentage of (A) myeloid cell (CD11b+), (B) B cell (B220+), and (C) T cell (CD3+) in peripheral blood of WT and IL27Ra−/− mice at indicated time points. (D-F) These histograms showing the frequency of (D) CMP, (E) GMP, and (F) HSCs in bone marrow of WT and IL27Ra−/− mice at indicated time points. (G) This line plots depict the percentage of IL27Ra+ HSCs and IL27Ra− HSC in bone marrow of WT mice at indicated time points. (H) Representative western blots showing the expression of p-ERK, ETS1, and IL27Ra in cKit+ bone marrow cells of WT mice at indicated time points. (I) This chart illustrates the proposed model of inflammation-induced TNF-α→ERK→ETS1→IL27Ra promotes hematopoietic stem cell aging.
When we analyzed HSCs upon LPS challenge, we found that WT HSCs expanded significantly 24 hours after LPS injection (Figure 6F) and that the proportion of IL27Ra+ HSCs was also significantly increased, from 21.4% to 50.4% (Figure 6G), suggesting that IL27Ra+ HSCs function as a reservoir for myeloid-recovery upon inflammation. It was notable that the expansion of HSCs of IL27Ra−/− mice was much less pronounced than in WT mice (Figure 6F). These findings indicate that, in HSCs, IL27Ra functions as a sensor for inflammatory stress. Importantly, we observed that the populations of IL27Ra+ HSCs, CMPs, B cells, and myeloid cells gradually returned to their normal levels over time after LPS challenge (3 days, 5 days, 7 days). Interestingly, we observed that the proportion of T cells in IL27Ra−/− mice was significantly elevated compared with WT mice, even at 7 days (Figure 6C), but that the proportion of GMPs and HSCs was significantly reduced (Figure 6E and F). On the days 5 and 7, the proportion of myeloid cells in IL27Ra−/− mice was significantly lower than that in WT mice, indicating that IL27Ra plays an important role on myeloid cells production after inflammation. However, the proportion of T cells in IL27Ra−/− mice is still significantly higher than that of WT mice until the day 7, indicating that IL27-IL27Ra signaling inhibits the excessive activation of T cells under inflammatory stimulation, which is consistent with previous studies.47 In addition, we observed that the activity of the ERK-ETS1-IL27Ra pathway peaked at 24 hours and then gradually decreased, a trend that mirrors the HSC dynamics upon LPS challenge (Figure 6H). Taken together, these data suggest that aging-elevated TNF-α impairs HSCs through ERK→ETS1→IL27Ra signaling. Although, given that ERK→ETS1→IL27Ra signaling pathway is still active in young HSCs and the recovery of myeloid cells of IL27Ra−/− mice in response to LPS challenge is compromised, ERK→ETS1→IL27Ra may have an important role in mediating stress hematopoiesis in response to inflammatory insults (Figure 6I).
Discussion
Our study provides experimental evidence exhibiting that aging-related inflammation promotes HSC aging via a TNF-α→ERK→ETS1→IL27Ra pathway.
Our study, for the first time, established the intrinsic link between inflamm-aging and immunosenescence. We found that the aging-elevated pro-inflammatory cytokine TNF-α induces the expression of IL27Ra in HSCs through the ERK-ETS1 pathway. The activation of IL27Ra signaling in HSCs induces myeloid-skewed differentiation to meet the demand of myeloid cells in response to aging-related inflammation. However, IL27Ra+ HSCs predominantly produce myeloid cells at the expense of the self-renewal and lymphoid differentiation, resulting in immunosenescence. Given that many pro-inflammatory cytokines are secreted by myeloid cells,18 our data suggest that there might be a positive feedback loop: TNF-α→ERK→ETS1→IL27Ra, involved in the induction of myeloid-skewed differentiation triggering the secretion of pro-inflammatory cytokines to recruit more myeloid cells, resulting in formation of a feedback network that ultimately aggravates inflamm-aging (supplemental Figure 5C). In addition, we found that the percentage of IL27Ra+ HSC in fetal liver HSCs was 7% (data not shown), 23% in young mice, and 46% in aged mice (Figure 1D). Moreover, we detected an aging-associated increase of several pro-inflammatory cytokines in bone marrow (supplemental Figure 4C). These data indicate that pro-inflammatory cytokines lead to activation of IL27Ra. The regulatory effects of inflammatory cytokines on HSC function has been studied in young individuals20 ; however, we found that the aging-induced pro-inflammatory cytokine TNF-α activates ERK-ETS1-IL27Ra signaling to promote HSCs differentiation into myeloid lineage at the expense of losing self-renewal capacity. A recent study shows that TNF-α–driven mechanisms are critical for HSC response to inflammatory stress through modulating necroptosis48 ; therefore, further study to explore the internal link between IL27Ra and necroptosis main explain the exact role of TNF-α in HSC aging. Thus, IL27Ra provides a link between inflamm-aging, and HSC aging, and immunosenescence. Given that aging is a comprehensive process, other inflammatory factors, such as IL-1β, may also regulate HSC differentiation bias or functional decline during aging through different molecular pathways.
Several recent studies show that HSCs do not exhibit differentiation bias in unperturbed condition.49-53 Then the phenotype of IL27Ra+ HSCs is due to the experimental limit or the real situation needs to be evaluated with further unperturbed assay. Although, given that our result shows that aged IL27Ra+ HSCs lose self-renewal capacity and then might be short-term–HSCs or MPPs (Figure 2C), that short-term–HSCs and MPP are long-lived in unperturbed state to generate all the blood cells,51,53 and that aged blood system displays myeloid-bias phenotype in both mouse and human,54,55 it is conceivable that aged IL27Ra+ HSCs (not functional HSCs anymore) might be the major source to output myeloid-biased blood cells in the inflammatory environment of aged mice and IL27Ra is a major sensor of HSCs to receiving the inflammatory signal elevated with aging.
Our result show that both young and aged IL27Ra+ HSCs and IL27Ra− HSCs can transform each other (supplemental Figure 1B). This raised an seemingly contradictory phenomenon: aged IL27Ra+ HSCs almost lost self-renewal capacity and cannot rebuilt the blood system in the second round of transplantation (Figure 2C), and at the same time, aged IL27Ra+ HSCs can generate IL27Ra− HSCs, which should possess the ability to build blood system. The possible explanation is that the “IL27Ra− HSCs” generated by aged IL27Ra+ HSCs are only phenotypic “HSCs,” which express HSC surface marker, but they do not have the capacity to self-renewal or even differentiation. This phenomenon is similar to the characteristics of aged HSC population, whose number increases significantly compared with young ones, but the reconstitution capacity declines, indicating that many phenotypic “HSCs” exist within it.
In the PCA plots (supplemental Figure 1F), the YN samples are not well grouped, but the other 3 groups (YP, ON, OP) are. The possible explanation could be that inflammatory signals homogenize young IL27Ra+ HSCs and especially aged IL27Ra+/IL27Ra− HSCs, and then result in the relatively homogeneous HSC population, which might be the cause of clonal hematopoiesis or hematopoietic malignant transformation with aging.
Heterogeneous expression of IL27Ra in HSCs
Our study found that the aging-increased IL27Ra impairs HSCs, but the expression of IL27Ra in HSCs of young mouse is heterogeneous. What factors lead to different expression levels of IL27Ra in young HSCs and what is the biological significance behind it are very interesting questions. Given that previous studies reported that HSCs located in various niches, therefore, we attempt to speculate that some niches are with high-level TNF-α or other inflammatory cytokines which could activate IL27Ra in HSCs, which we called “inflammatory HSCs” (Figure 6I), but other niches are salutary milieus. The “inflammatory” niches secrete inflammatory factors to promote HSCs differentiating into myeloid lineages to meet with the demand of the body in response to inflammatory insult by activating ERK→ETS1→IL27Ra signaling. With aging, continuous inflammatory insult spawns more inflammatory niches, and then results in the increase of IL27Ra+ HSCs.
In conclusion, our study elucidates a new molecular mechanism regulating HSC aging and establishes an intrinsic link between inflamm-aging and immunosenescence. Pharmaceutically targeting this signaling may give rise to new potential strategy against HSC aging and related diseases.
For original data please contact jianweiwang@mail.tsinghua.edu.cn.
The RNA sequencing data reported in this article have been deposited in the Gene Expression Omnibus database (accession number GSE115182).
The online version of this article contains a data supplement.
The publication costs of this article were defrayed in part by page charge payment. Therefore, and solely to indicate this fact, this article is hereby marked “advertisement” in accordance with 18 USC section 1734.
Acknowledgments
The authors thank Feng Shao for the generous offer of the TNFR1/2−/− mice; S. Ding, D. Huang, and X. H. Guo for critical discussion; and the Beijing Advanced Innovation Center for Structural Biology and the Tsinghua-Peking Center for Life Sciences for facility and financial support. The authors also thank Axel Schambach (Medizinische Hochschule Hannover) for the kind offer of the pRRL-PPT-SF-newMCS-IRES2-EGFP vector.
This work was supported by grants 2018YFA0800200, 2017YFA0104000, Z181100001818005, and 91849106 (J.W.) and 61773230 and 61721003 (X.W.) from the National Key R&D Program of China or the Beijing Municipal Science & Technology Commission and the National Natural Science Foundation of China.
Authorship
Contribution: J.W. conceptualized the study; H.H., P.X., and X.Z. undertook methodology; H.H., P.X., X.Z., M.L., Q.D., T.C., B.T., X.Y., W.L., and M.Y. performed the investigation; J.W. wrote the original draft; Z.J. and J.W. reviewed and edited the manuscript; X.W. and J.W. acquired funding; Y.C. provided resources; and J.W. supervised.
Conflict-of-interest disclosure: The authors declare no competing financial interests.
Correspondence: Jianwei Wang, School of Pharmaceutical Sciences, Tsinghua University, Beijing 100084, China; e-mail: jianweiwang@mail.tsinghua.edu.cn.

This feature is available to Subscribers Only
Sign In or Create an Account Close Modal