

Key Points
Although not statistically significant, a higher rate of CR/VGPR was observed for zanubrutinib vs ibrutinib (28% vs 19%, respectively).
The incidence and severity of most BTK-associated toxicities (including atrial fibrillation) were lower with zanubrutinib than ibrutinib.

Abstract
Bruton tyrosine kinase (BTK) inhibition is an effective treatment approach for patients with Waldenström macroglobulinemia (WM). The phase 3 ASPEN study compared the efficacy and safety of ibrutinib, a first-generation BTK inhibitor, with zanubrutinib, a novel highly selective BTK inhibitor, in patients with WM. Patients with MYD88L265P disease were randomly assigned 1:1 to treatment with ibrutinib or zanubrutinib. The primary end point was the proportion of patients achieving a complete response (CR) or a very good partial response (VGPR) by independent review. Key secondary end points included major response rate (MRR), progression-free survival (PFS), duration of response (DOR), disease burden, and safety. A total of 201 patients were randomized, and 199 received ≥1 dose of study treatment. No patient achieved a CR. Twenty-nine (28%) zanubrutinib patients and 19 (19%) ibrutinib patients achieved a VGPR, a nonstatistically significant difference (P = .09). MRRs were 77% and 78%, respectively. Median DOR and PFS were not reached; 84% and 85% of ibrutinib and zanubrutinib patients were progression free at 18 months. Atrial fibrillation, contusion, diarrhea, peripheral edema, hemorrhage, muscle spasms, and pneumonia, as well as adverse events leading to treatment discontinuation, were less common among zanubrutinib recipients. Incidence of neutropenia was higher with zanubrutinib, although grade ≥3 infection rates were similar in both arms (1.2 and 1.1 events per 100 person-months). These results demonstrate that zanubrutinib and ibrutinib are highly effective in the treatment of WM, but zanubrutinib treatment was associated with a trend toward better response quality and less toxicity, particularly cardiovascular toxicity.
Introduction
Waldenström macroglobulinemia (WM) is a B-cell malignancy that is characterized by bone marrow infiltration with monoclonal immunoglobulin M (IgM)-secreting lymphoplasmacytic cells that exhibit constitutive activation of the B-cell receptor signaling complex, of which Bruton tyrosine kinase (BTK) is a critical component.1,2 In addition, the pathogenetic role of somatic mutations in myeloid differentiation factor 88 (MYD88) and CXCR4 has been extensively characterized.3-7 MYD88, a component of interleukin-1 and Toll-like receptor signaling complexes, is mutated in >90% of patients with WM.8 Studies have shown that hematopoietic cell kinase is activated in MYD88L265P cells and can transactivate BTK, contributing additional prosurvival signals.9 Mutations in CXCR4 lead to constitutive CXCR4 signaling and are seen in 30% to 35% of patients with WM.10
Ibrutinib, a first-generation BTK inhibitor, has emerged as a standard of care for patients with WM. In a phase 2 study of 63 patients with relapsed/refractory (R/R) WM, 73% of patients achieved a major response (at least a partial response [PR]), and estimated 2-year progression-free survival (PFS) was 69%.10 With longer treatment (median, 47 months), the major response rate (MRR) increased to 78%, including 27% of patients with very good PR (VGPR); median progression-free survival (PFS) was >5 years.11 In a companion study of 30 treatment-naive (TN) patients, MRR was 83%, including 20% with VGPR, after a median treatment duration of 13.4 months.8 Although effective, ibrutinib treatment is associated with frequent toxicities.12 In a retrospective review of 112 ibrutinib-treated patients with WM (treatment durations ≤43 months), 11% experienced atrial fibrillation.13 Grade ≥3 atrial fibrillation and hypertension were reported by 12% and 13% of patients treated with an ibrutinib/rituximab combination, with median ibrutinib treatment duration of 26 months.14 Inhibition of off-target kinases may explain many ibrutinib-associated toxicities, including diarrhea, hypertension, muscle spasms, bleeding, and atrial fibrillation.12,15-20
Zanubrutinib is a novel potent BTK inhibitor that exhibits less off-target inhibition than ibrutinib. In a phase 1/2 study of patients with B-cell malignancies, 45% of 73 patients with WM achieved a VGPR or CR and 82% achieved a major response after a median follow-up of 32.7 months. Treatment was generally well tolerated, with atrial fibrillation, major hemorrhage, and grade ≥3 diarrhea reported in 5%, 4%, and 3% of patients, respectively.21
Based on promising activity and the potential for less off-target toxicity than first-generation BTK inhibitors, this phase 3 trial was designed to directly compare safety and efficacy of ibrutinib vs zanubrutinib in patients with WM (NCT03053440).
Methods
Study design and treatments
BGB-3111-302 (ASPEN) is a randomized open-label phase 3 study comparing ibrutinib and zanubrutinib in patients with WM who required treatment based on consensus criteria.22 Patients with MYD88L265P disease were assigned 1:1 to receive ibrutinib at the approved dose of 420 mg once daily or zanubrutinib, 160 mg twice daily, in 28-day cycles until progression or intolerance (cohort 1). Randomization was stratified by warts, hypogammaglobulinemia, immunodeficiency, and myelokathexis (WHIM) (CXCR4WHIM) syndrome-like mutation status and number of prior lines of therapy. Patients with wild-type MYD88 (MYD88WT) disease or with undetermined MYD88 mutation status were enrolled in cohort 2 and received zanubrutinib on a third nonrandomized arm. Treatment modifications are outlined in supplemental Table 1 (available on the Blood Web site) for zanubrutinib and followed local prescribing information for ibrutinib. Treatment interruption for ≤2 consecutive cycles and ≤2 dose reductions were permitted for management of recurring grade 3/4 treatment-related toxicities. Crossover at progression or due to intolerance in cohort 1 was not permitted. Results from cohort 2 will be reported separately.
Trial oversight and conduct
The trial was approved by the Institutional Review Board or Independent Ethics Committee at each study site and conducted in accordance with applicable regulatory requirements, the principles of the Declaration of Helsinki, and Good Clinical Practice guidelines of the International Conference on Harmonization. All patients provided written informed consent.
Patients
Eligible patients had R/R WM after ≥1 prior line of therapy or TN WM unsuitable for standard immunochemotherapy based on the presence of documented comorbidities or risk factors (supplemental Table 2). Patients were required to have measurable disease, adequate end-organ function, and absolute neutrophil and platelet counts of 0.75 × 10⁹/L and 50 × 109/L, respectively. Patients with prior BTK inhibitor exposure, disease transformation, active central nervous system lymphoma, clinically significant cardiovascular disease, or who required warfarin or another vitamin K antagonist were excluded.
Assessments
Bone marrow aspiration and biopsy were collected at baseline, week 48, and as clinically indicated thereafter (including for confirmation of CR). Baseline bone marrow samples were assayed for MYD88 and CXCR4 mutations prior to cohort assignment (supplemental Methods). Quantitative serum immunoglobulins (IgM, IgG, IgA), M-paraprotein, and β-2 microglobulin levels were measured at baseline, the beginning of each cycle until cycle 12, and every 3 cycles thereafter. Contrast-enhanced computed tomography or magnetic resonance imaging scans were performed at baseline; patients with extramedullary disease underwent follow-up scans every 3 cycles until cycle 12 and every 6 cycles thereafter until progression. Electrocardiograms were performed on day 1 of cycles 1 and 2, every 4 cycles thereafter, and at the end of treatment. Quality-of-life (QoL) assessments (European Organization for Research and Treatment of Cancer Quality of Life Questionnaire-Core 30 and the European Quality of Life Five Dimensions Questionnaire) were collected at baseline, every 3 cycles until cycle 12, and every 6 cycles thereafter.
Outcomes
The primary end point was the proportion of patients in cohort 1 who achieved a VGPR or CR, as assessed by an independent review committee (IRC; PAREXEL Informatics, Waltham, MA) based on the 6th International Workshop on Waldenström Macroglobulinemia consensus criteria.23 Criteria that define each response category (assessed every 28 days and every 84 days after cycle 12) are listed in supplemental Table 3. Secondary end points included IRC-assessed MRR, duration of response (DOR; time from initial qualifying response until progression or death), and PFS (time from randomization until progression or death), investigator-assessed efficacy outcomes, reductions in bone marrow and extramedullary tumor burden, and safety. Overall survival (OS) and changes in QoL were exploratory end points. Adverse event (AE) assessments (including adverse events of interest [AEIs]; supplemental Table 4) included type, incidence, outcomes, and severity of AEs, with severity graded according to the National Cancer Institute Common Toxicity Criteria version 4.03.
Statistical analysis
The primary efficacy analysis was planned to take place ∼12 months after the last R/R patient was randomized. Comparisons between ibrutinib and zanubrutinib for the primary end point in cohort 1 followed a hierarchical fixed-sequence procedure to adjust for multiplicity. Testing for the CR/VGPR superiority rate of zanubrutinib vs ibrutinib in patients with R/R WM was performed first. If the aforementioned comparison was statistically significant, further testing was performed, including all randomized cohort 1 patients (including ∼38 TN patients with MYD88L265P disease). A Cochran-Mantel-Haenszel test for difference in CR/VGPR rates was performed for both comparisons, with the magnitude of difference estimated as the weighted average across the randomization stratification factors, age groups (≤65 vs >65 years), and the corresponding 2-sided 95% confidence intervals (CIs).24,25 Superiority was to be declared if the 2-sided P value from the Cochran-Mantel-Haenszel test was <.05 and the estimated difference was positive. Statistical significance for the first or both response comparisons was to trigger a test of noninferiority in MRRs between zanubrutinib and ibrutinib, using the estimated difference and its 95% CIs. Noninferiority would be declared if the lower limit of the 95% CI for the estimated difference in MRRs between zanubrutinib and ibrutinib excluded the prespecified margin for noninferiority, −8%. If the lower limit of the 95% CI excluded 0%, superiority of zanubrutinib in MRR would be declared. A total of 150 R/R patients randomized 1:1 in cohort 1 would provide 81.4% power to demonstrate superiority under an assumed CR/VGPR rate of 35% for zanubrutinib vs 15% for ibrutinib, using a normal approximation of a binomial test and a 2-sided α of 0.05. Noninferiority was powered to 85.5% under assumed MRRs of 90% and 80% for zanubrutinib and ibrutinib, respectively, and a noninferiority margin of 0.08.
Reductions in IgM levels from baseline were assessed with parametric and nonparametric methods. A likelihood-based repeated-measures mixed model was used to estimate the slopes of IgM reduction from baseline and to compare the estimated slopes between arms. IgM reduction was also summarized as area under the (IgM) × time curve, with the treatment arm difference tested using the Mantel-Haenszel test. Log-transformed IgM levels were used in both analyses.
PFS by treatment arm was estimated at the time of primary efficacy analysis by Kaplan-Meier (K-M) methodology with censoring.26 Two-sided 95% CIs for median PFS were estimated with the Brookmeyer and Crowley method.27 K-M methodology was used to estimate PFS at selected time points, with corresponding 95% CIs estimated using Greenwood’s formula.28 Analysis methods for DOR were similar to those for PFS. Follow-up for PFS and DOR was estimated using the reverse K-M method. Rates of CR/VGPR for selected subgroups defined by prespecified characteristics were summarized for each treatment arm in a forest plot. Crude incidence rates for all AEs and exposure-adjusted incidence rates for AEIs included all cohort 1 patients who received any dose of ibrutinib or zanubrutinib and were summarized using descriptive statistics. The distribution of times to first occurrence of AEIs was summarized using K-M methodology.
Results
Patient characteristics and disposition
Between January of 2017 and July of 2018, 164 R/R and 37 TN patients with WM from 58 study sites were enrolled in cohort 1. Two R/R patients were randomized but never dosed (1 ibrutinib patient had central nervous system lymphoma identified prior to dosing, and 1 zanubrutinib patient had acute kidney injury; Figure 1). The most common (>20%) indications for therapy initiation were fatigue, anemia, B symptoms, hyperviscosity, and peripheral neuropathy (supplemental Table 5). Treatment arms were generally balanced for key baseline characteristics; however, more patients randomized to zanubrutinib than to ibrutinib were >75 years old (33% vs 22%, respectively), and more were anemic (hemoglobin ≤110 g/L in 66% vs 54% of patients, respectively; Table 1). Overall, 8% and 11% of ibrutinib and zanubrutinib patients had a CXCR4WHIM mutation. Approximately 85% were in the intermediate- or high-risk prognostic category,29 and 77% had computed tomography evidence of extramedullary disease. Most R/R patients (>90%) received 1 to 3 prior lines of therapy, with a median of 1 in each arm; more than 90% and 85% had ≥1 prior exposure to anti-CD20 and alkylator therapy, respectively (supplemental Table 6). Eight (8%) and 11 (10%) ibrutinib and zanubrutinib patients had a history of atrial fibrillation or flutter, and 43% and 38% reported a history of hypertension, respectively. At a median follow-up of 19.4 months, 79% of patients remained on study treatment, and 89% remained on study.
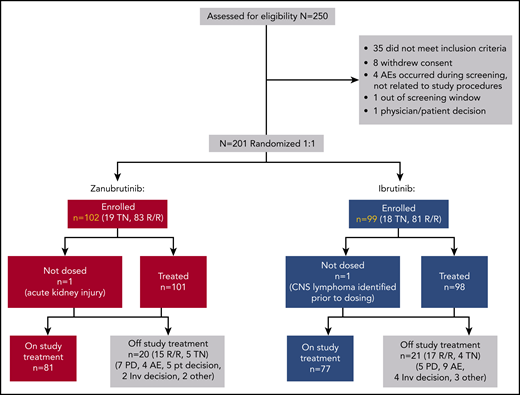
BGB-3111-302 (ASPEN) patient disposition. CNS, central nervous system; inv, investigator; PD, progressive disease; pt, patient.
BGB-3111-302 (ASPEN) patient disposition. CNS, central nervous system; inv, investigator; PD, progressive disease; pt, patient.
Baseline demographic and disease characteristics
| Characteristic | R/R | TN | Overall | |||
|---|---|---|---|---|---|---|
| Ibrutinib (n = 81) | Zanubrutinib (n = 83) | Ibrutinib (n = 18) | Zanubrutinib (n = 19) | Ibrutinib (n = 99) | Zanubrutinib (n = 102) | |
| Age, median (min, max), y | 69 (52, 90) | 69 (45, 87) | 72 (38, 89) | 74 (50, 81) | 70 (38, 90) | 70 (45, 87) |
| Age >75 y, n (%) | 16 (20) | 27 (33) | 6 (33) | 7 (37) | 22 (22) | 34 (33) |
| Males, n (%) | 53 (65) | 58 (70) | 12 (67) | 11 (58) | 65 (66) | 69 (68) |
| ECOG-PS | ||||||
| 0/1 | 76 (94) | 78 (94) | 16 (89) | 18 (95) | 92 (93) | 96 (94) |
| 2 | 5 (6) | 5 (6) | 2 (11) | 1 (5) | 7 (7) | 6 (6) |
| Prognostic category at study entry* | ||||||
| Low | 12 (15) | 16 (19) | 1 (6) | 1 (5) | 13 (13) | 17 (17) |
| Intermediate | 34 (42) | 30 (36) | 8 (44) | 8 (42) | 42 (42) | 38 (37) |
| High | 35 (43) | 37 (45) | 9 (50) | 10 (53) | 44 (44) | 47 (46) |
| Time from initial diagnosis, median (min, max), y | 5.9 (0.1, 25) | 5.3 (0.1, 23) | 1.7 (0.1, 17) | 0.5 (0.1, 9) | 4.9 (0.1, 25) | 4.4 (0.1, 23) |
| Prior lines of therapy, median (min, max), n | 1 (1, 6) | 1 (1, 8) | 0 (0, 0) | 0 (0, 0) | 1 (0, 6) | 1 (0, 8) |
| 0, n (%) | 0 | 0 | 18 (100) | 19 (100) | 18 (18) | 19 (19) |
| 1-3, n (%) | 74 (91) | 76 (92) | 0 | 0 | 74 (75) | 76 (75) |
| >3, n (%) | 7 (9) | 7 (8) | 0 | 0 | 7 (7) | 7 (7) |
| Prior stem cell transplant | 1 (1) | 3 (4) | 0 | 0 | 1 (1.0) | 3 (2.9) |
| IgM, median (min, max), g/L† | 33.4 (2.4, 108) | 30.4 (5.8, 73) | 36.8 (9.9, 100) | 35.7 (8.1, 87) | 34.2 (2.4, 108) | 31.8 (5.8, 87) |
| ≥40 | 30 (37) | 288 (34) | 8 (44) | 8 (42) | 38 (38) | 36 (35) |
| <40 | 50 (62) | 55 (66) | 10 (56) | 11 (58) | 60 (61) | 66 (65) |
| Missing data | 1 (1) | 0 | 0 | 0 | 1 (1.0) | 0 |
| β-2 Microglobulin, median, (min, max), mg/L | 4.2 (1.7, 13.6) | 4.1 (1.6, 21.7) | 4.1 (1.8, 10.3) | 4.7 (2.1, 12.1) | 4.2 (1.7, 13.6) | 4.3 (1.6, 21.7) |
| >3 mg/L, n (%) | 60 (74) | 62 (75) | 14 (78) | 13 (68) | 74 (75) | 75 (74) |
| MYD88‡/CXCR4 genotype | ||||||
| MYD88L265P/CXCR4WT | 73 (90) | 73 (88) | 17 (94) | 18 (95) | 90 (91) | 91 (89) |
| MYD88L265P/CXCR4WHIM | 8 (10) | 10 (12) | 0 (0) | 1 (5) | 8 (8) | 11 (11) |
| MYD88L265P/CXCR4UNK§ | 0 | 0 | 1 (6) | 0 | 1 (1.0) | 0 |
| Bone marrow involvement | 72 (89) | 77 (93) | 17 (94) | 19 (100) | 89 (90) | 96 (94) |
| Tumor cells, median (min, max), % | 60 (0, 90) | 60 (0, 90) | 70 (8, 90) | 70 (10, 90) | 60 (0, 90) | 60 (0, 90) |
| Extramedullary disease¶ | 58 (72) | 64 (77) | 15 (83) | 17 (90) | 73 (74) | 81 (79) |
| Lymphadenopathy | 53 (65) | 63 (76) | 14 (78) | 16 (84) | 67 (68) | 79 (78) |
| Splenomegaly | 10 (12) | 14 (17) | 3 (17) | 3 (16) | 13 (13) | 17 (17) |
| Other|| | 3 (4) | 0 | 0 | 1 (5) | 1 (1) | 4 (2) |
| Peripheral blood cytopenias | ||||||
| Hemoglobin ≤110 g/L | 43 (53) | 51 (61) | 10 (56) | 16 (84) | 53 (54) | 67 (66) |
| Platelet count ≤100 × 109/L | 12 (15) | 10 (12) | 0 | 2 (11) | 12 (12) | 12 (12) |
| Absolute neutrophil count ≤1.5 × 10⁹/L | 7 (9) | 8 (10) | 0 | 3 (16) | 7 (7) | 11 (11) |
Unless otherwise noted, data are n (%). Percentages may not add to 100% because of rounding.
ECOG-PS, Eastern Cooperative Oncology Group performance status; max, maximum; min, minimum; WHIM, warts, hypogammaglobulinemia, infections, myelokathexis; WT, wild-type.
Patients were assigned 1 point for each of the following baseline characteristics: age >65 years; hemoglobin ≤11.5 g/dL; platelet count ≤100 × 109/L; β-2 microglobulin level >3 mg/L; and M paraprotein levels >7.0 g/dL. Patients with a score of 0 or 1 (excepting age) were assigned to the low-risk category, those >65 years old or with a score of 2 were assigned to the intermediate-risk category. and those with a score ≥3 were assigned to the high-risk category.29 M-paraprotein levels were quantitated by serum protein electrophoresis.
Central laboratory nephelometric assessments.
Three patients (all zanubrutinib treated and all TN) had second missense mutations detected within the Toll/interleukin-1 receptor (TIR) binding domain of MYD88: M232T, V217F, and P182L. Additional mutations were identified in non-TIR binding domains in 4 patients: D165del (R/R zanubrutinib patient); W91ter, G93ter (R/R ibrutinib patient); L72M (RR zanubrutinib patient); and T107S, fs24ter (TN zanubrutinib patient). See supplemental Methods for the specific CXCR4WHIM mutations detected.
Mutation testing using a next-generation sequencing method performed in a local laboratory revealed the presence of MYD88L265P in baseline bone marrow aspirate.
Based on imaging studies, as assessed by independent review. Lymphadenopathy was defined as the presence of ≥1 lymph node with a long axis >1.5 cm or other extranodal lesions with a short axis >1.0 cm. Splenomegaly was defined as a spleen length (cranial to caudal) >13 cm.
Three patients had discrete extranodal splenic lesions; 1 patient had 2 breast lesions.
Responses
No patient achieved a CR. Frequency of IRC-assessed VGPRs was higher among zanubrutinib patients than ibrutinib patients (28% and 19%, respectively, 2-sided P = .09), a trend observed among R/R (29% vs 20%; P = .12) and TN (26% vs 17%; P = .54) patients (Table 2). Investigator-assessed rates of VGPR were 28% and 17% in the zanubrutinib and ibrutinib arms, respectively (P = .04). Concordance rates between IRC- and investigator-assessed best responses were 94% and 95% for zanubrutinib and ibrutinib arms, respectively. IRC-assessed best responses based on reductions in serum IgM alone and those based on the 6th International Workshop on Waldenström Macroglobulinemia consensus guidelines were concordant in 92% and 95%, respectively. The rates of VGPR were mostly comparable between the arms for prognostically important subgroups (eg, intermediate- or high-risk, based on the International Prognostic Scoring System; age >65 years; hemoglobin ≤110 g/L; platelet count ≤100 × 109/L; and β-2 microglobulin >3 mg/dL) (Figure 2). MRRs among zanubrutinib and ibrutinib patients were 77% and 78% overall, 78% and 80% among R/R patients, and 74% and 67% among TN patients, respectively. The noninferiority hypothesis for MRR difference was not tested because of the lack of statistically significant superiority of CR/VGPR rates for zanubrutinib.
IRC-assessed efficacy outcomes
| R/R | TN | Overall | ||||
|---|---|---|---|---|---|---|
| Ibrutinib (n = 81) | Zanubrutinib (n = 83) | Ibrutinib (n = 18) | Zanubrutinib (n = 19) | Ibrutinib (n = 99) | Zanubrutinib (n = 102) | |
| Best overall response, n (%) | ||||||
| CR | 0 (0) | 0 (0) | 0 (0) | 0 (0) | 0 (0) | 0 (0) |
| VGPR | 16 (20) | 24 (29) | 3 (17) | 5 (26) | 19 (19) | 29 (28) |
| PR | 49 (61) | 41 (49) | 9 (50) | 9 (47) | 58 (59) | 50 (49) |
| MR | 11 (14) | 13 (16) | 4 (22) | 4 (21) | 15 (15) | 17 (17) |
| SD | 2 (3) | 3 (4) | 1 (6) | 0 (0) | 3 (3) | 3 (3) |
| PD | 2 (3) | 1 (1) | 0 (0) | 1 (5) | 2 (2) | 2 (2) |
| Not evaluable* | 1 (1) | 1 (6) | 1 (1) | 0 (0) | 2 (2) | 1 (1) |
| Response rates, % (95% CI)† | ||||||
| VGPR or CR | 20 (12-30) | 29 (20-40) | 17 (4-41) | 26 (9-51) | 19‡ (12-28) | 28 (20-38) |
| P | .12 | NR | .09 | |||
| MRR | 80 (70-88) | 78 (68-87) | 67 (41-87) | 74 (49-91) | 78 (68-86) | 77 (68-85) |
| ORR | 94 (86-98) | 94 (87-98) | 89 (65-99) | 95 (74-100) | 93 (86-97) | 94 (88-98) |
| Duration of CR/VGPR, mo | ||||||
| Median (range) | NE (1, 21+) | NE (0+, 19+) | NE (0+, 3+) | NE (0+, 22+) | NE (0+, 21+) | NE (0+, 22+) |
| 18-Mo event-free rate, % (95% CI)§ | 64 (29-85) | 90 (47-99) | NE (NE, NE) | 100 (NE, NE) | 64 (29-85) | 93 (59-99) |
| Duration of major response, months | ||||||
| Median (range) | NE (0+, 26+) | NE (0+, 25+) | NE (3+, 28+) | NE (0+, 25+) | NE (0+, 28+) | NE (0+, 25+) |
| 18-Mo event-free rate, % (95% CI)§ | 86 (73-93) | 87 (73-94) | 100 (NE, NE) | 80 (39-95) | 88 (77-94) | 85 (72-93) |
| PFS | ||||||
| Median (range), mo | NE (0, 28+) | NE (0+, 28+) | NE (0+, 31+) | NE (1, 31+) | NE (0+, 31+) | NE (0+, 31+) |
| 18-Mo event-free rate, % (95% CI)§ | 82 (71-89) | 86 (74-93) | 94 (63-99) | 78 (52-91) | 84 (75-90) | 85 (75-91) |
Percentages are based on N, the number of randomized patients.
+, censored observations; MR, minimal response; NE, not estimable; ORR, overall response rate; NR, not reported; PD, progressive disease; SD, stable disease.
NE includes patients with unknown response, disease flare, and study discontinuation prior to first disease assessment.
95% CIs were estimated using the Clopper-Pearson method.
Two R/R ibrutinib-treated patients assessed as having VGPRs by independent review were assigned a best response of PR and MR by their investigators.
Event-free rates were estimated by K-M methodology, with 95% CIs estimated using Greenwood’s formula.
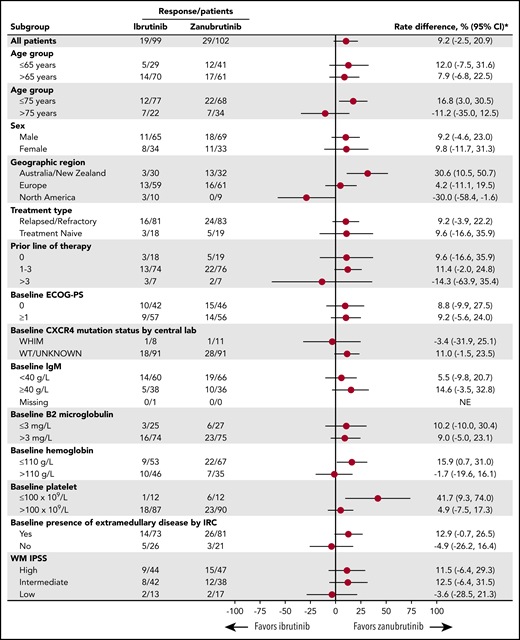
Forest plot of subgroup differences in the rate of CR/VGPR. *Unstratified rate difference and 95% CIs. ECOG-PS, Eastern Cooperative Oncology Group performance status; IPSS, International Prognostic Scoring System.
Forest plot of subgroup differences in the rate of CR/VGPR. *Unstratified rate difference and 95% CIs. ECOG-PS, Eastern Cooperative Oncology Group performance status; IPSS, International Prognostic Scoring System.
One patient in each arm with a CXCR4WHIM mutation achieved a VGPR; 18 (20%) ibrutinib-treated patients and 28 (31%) zanubrutinib-treated patients with CXCRWT disease achieved a VGPR. MRRs for CXCRWHIM and CXCR4WT patient subsets were comparable across treatment arms (63% vs 64% and 80% vs 79%, respectively). Median times to achieve a VGPR were skewed in favor of zanubrutinib, owing to the large difference observed for TN patients (5.6 and 22.1 months with zanubrutinib and ibrutinib; P = .35). However, among R/R patients, these were comparable at 4.7 and 5.1 months (P = .17), respectively. Median time to major response for both arms was 2.8 months, with little difference in the R/R or TN subset or among patients with CXCR4WT disease; the median times to major response for ibrutinib and zanubrutinib patients with CXCR4WHIM mutations were 6.6 and 3.1 months, respectively. Median DOR has not been reached in either treatment arm (Figure 3B-C; Table 2). One zanubrutinib patient and 4 ibrutinib patients who achieved a VGPR progressed as of 31 August 2019. The 18-month event-free rates for major responders were similar in the zanubrutinib and ibrutinib arms (85% and 88% overall, and 87% and 86% for R/R patients, respectively) (Table 2).

Kaplan-Meier curves of survival and response. K-M curves for PFS (A), duration of major response (B), and duration of CR/VGPR (C). All K-M distributions are based on IRC-assessed responses for R/R and TN patients in each respective arm. HR, hazard ratio.
Kaplan-Meier curves of survival and response. K-M curves for PFS (A), duration of major response (B), and duration of CR/VGPR (C). All K-M distributions are based on IRC-assessed responses for R/R and TN patients in each respective arm. HR, hazard ratio.
PFS and OS
After median follow-up for PFS of 18.0 and 18.5 months, 15 (15%) zanubrutinib patients and 16 (16%) ibrutinib patients progressed or died. Median PFS was not reached for either arm. Event-free rates at 18 months were comparable: 85% and 84% overall (86% and 82% for R/R patients) (Figure 3A; Table 2). Six (3 R/R; 3 TN) zanubrutinib patients and 8 (8 R/R; 0 TN) ibrutinib patients died; estimated OS rates at 18 months were 97% and 93%, respectively.
IgM and hemoglobin levels
Median IgM levels were reduced by 79% (quartile [Q]1-Q3: 88-63) and 72% (Q1-Q3: 86-58) for zanubrutinib and ibrutinib patients, respectively (supplemental Figure 1A). Zanubrutinib demonstrated significantly greater and more sustained reductions in IgM by the repeated-measures mixed-effect model (P = .03) and area under the (IgM) × time curve (P = .04) comparisons (supplemental Table 7). Most patients in both arms were anemic at baseline (Table 1). Median baseline hemoglobin concentrations were 103 g/L (Q1-Q3: 91-116) and 109 g/L (Q1-Q3: 94-122) for zanubrutinib and ibrutinib patients, respectively. Rapid increases in hemoglobin concentrations were noted in both arms through cycle 6, with a plateau observed thereafter (supplemental Figure 1B). Median maximal hemoglobin concentrations increased by 27 g/L (Q1-Q3: 15-46) and 28 g/L (Q1-Q3: 15-43) among zanubrutinib and ibrutinib patients, respectively.
Bone marrow and extramedullary disease
Overall, 69% and 73% of zanubrutinib and ibrutinib patients exhibited reductions in bone marrow infiltration. Median maximal reductions from baseline were 10% (Q1-Q3: 30-0) and 15% (Q1-Q3: 35-0) for zanubrutinib and ibrutinib patients. Reductions in lymph node and/or spleen dimensions were noted in 81% and 80%, respectively. Median maximal reductions in the sum of target lymph node perpendicular diameters were 58% (Q1-Q3: 40-85) and 50% (Q1-Q3: 31-63) for zanubrutinib and ibrutinib patients, respectively; median maximal reductions in vertical spleen length among patients with splenomegaly were 27% (Q1-Q3: 24-39) and 24% (Q1-Q3: 5-36), respectively.
Safety and patient reported outcomes
Median treatment durations were comparable in the zanubrutinib (18.7 months) and ibrutinib (18.6 months) treatment arms; 89% and 84% of patients had minimal exposures of 12 months. Median relative dose intensities were 98% in both arms. Median treatment duration for TN patients was 21 months in both arms.
The most common (reported in >20% of patients) AEs among zanubrutinib patients were neutropenia, upper respiratory infection, and diarrhea (Table 3). The most common AEs among ibrutinib patients were diarrhea, upper respiratory infection, contusion, and muscle spasms. Atrial fibrillation, diarrhea, contusion, muscle spasms, peripheral edema, and pneumonia were reported at ≥10% higher incidence among ibrutinib vs zanubrutinib patients; neutropenia was ≥10% higher among zanubrutinib patients. Grade ≥3 AEs were reported in 63% and 58% of ibrutinib and zanubrutinib patients, respectively. Grade ≥3 hypertension and pneumonia were reported at a ≥5% higher incidence among ibrutinib patients vs zanubrutinib patients; grade ≥3 neutropenia was reported at a ≥5% higher incidence among zanubrutinib patients. Overall, 41% and 40% of ibrutinib and zanubrutinib patients, respectively, experienced ≥1 serious AE (supplemental Table 8). The most common serious AEs (ibrutinib vs zanubrutinib) were pneumonia (9 patients vs 1), neutropenia and febrile neutropenia (each 0 vs 3), influenza (1 vs 3), and pyrexia and sepsis (each 3 vs 2). Three deaths (all R/R patients) were attributed to AEs. Two deaths in ibrutinib patients resulted from complications of sepsis, and 1 zanubrutinib patient died from complications of cardiac arrest postplasmapheresis.
Treatment-emergent AEs
| Event term, n (%) | Ibrutinib (n = 98) | Zanubrutinib (n = 101) | ||
|---|---|---|---|---|
| All grade | Grade ≥3 | All grade | Grade ≥3 | |
| Nonhematologic AEs | ||||
| Diarrhea* | 31 (32) | 1 (1) | 21 (21) | 3 (3) |
| Upper respiratory tract infection | 28 (29) | 1 (1) | 24 (24) | 0 |
| Contusion* | 23 (24) | 0 | 13 (13) | 0 |
| Muscle spasms* | 23 (24) | 1 (1) | 10 (10) | 0 |
| Epistaxis | 19 (19) | 0 | 13 (13) | 0 |
| Peripheral edema* | 19 (19) | 0 | 9 (9) | 0 |
| Cough | 17 (17) | 0 | 13 (13) | 0 |
| Rash | 16 (16) | 0 | 13 (13) | 0 |
| Hypertension | 16 (16) | 11 (11) | 11 (11) | 6 (6) |
| Arthralgia | 16 (16) | 0 | 13 (13) | 3 (3) |
| Fatigue | 15 (15) | 1 (1) | 19 (19) | 1 (1) |
| Atrial fibrillation/flutter* | 15 (15) | 4 (4) | 2 (2) | 0 |
| Nausea | 13 (13) | 1 (1) | 15 (15) | 0 |
| Vomiting | 13 (13) | 1 (1) | 9 (9) | 0 |
| Pyrexia | 12 (12) | 2 (2) | 13 (13) | 2 (2) |
| Pneumonia* | 12 (12) | 7 (7) | 2 (2) | 1 (1) |
| Headache | 11 (11) | 1 (1) | 15 (15) | 1 (1) |
| Urinary tract infection | 10 (10) | 2 (2) | 10 (10) | 0 |
| Hematuria | 10 (10) | 2 (2) | 7 (7) | 0 |
| Dizziness | 9 (9) | 0 | 13 (13) | 0 |
| Constipation | 7 (7) | 0 | 16 (16) | 0 |
| Nasopharyngitis | 7 (7) | 0 | 11 (11) | 0 |
| Extremity pain | 7 (7) | 0 | 11 (11) | 1 (1) |
| Back pain | 6 (6) | 0 | 14 (14) | 4 (4) |
| Dyspnea | 6 (6) | 0 | 14 (14) | 0 |
| Hematologic AEs | ||||
| Neutropenia* | 13 (13) | 8 (8)† | 29 (29) | 19 (20)† |
| Febrile neutropenia | 0 | 0 | 4 (4) | 4 (4) |
| Thrombocytopenia | 10 (10) | 3 (3) | 10 (10) | 6 (6) |
| Anemia | 10 (10) | 5 (5) | 12 (12) | 5 (5) |
| AEIs, events/100 person-months‡ | Ibrutinib | Zanubrutinib | ||
|---|---|---|---|---|
| All grade | Grade ≥3 | All grade | Grade ≥3 | |
| Infections | 8.3 | 1.2 | 7.9 | 1.1 |
| Opportunistic infections | 0.1 | 0 | 0.1 | 0.1 |
| Bleeding | 7.0 | 0.5 | 4.4 | 0.3 |
| Major hemorrhage | 0.6 | 0.5 | 0.3 | 0.3 |
| Hypertension | 1.2 | 0.8 | 0.7 | 0.3 |
| Atrial fibrillation/flutter | 1.0 | 0.2 | 0.1 | 0 |
| Neutropenia | 0.9 | 0.5 | 2.1 | 1.3 |
| Thrombocytopenia | 0.8 | 0.2 | 0.6 | 0.3 |
| Second primary malignancies | 0.7 | 0.1 | 0.7 | 0.1 |
| Skin cancers | 0.6 | 0 | 0.5 | 0 |
| Anemia | 0.6 | 0.3 | 0.7 | 0.3 |
| Tumor lysis syndrome | 0 | 0 | 0 | 0 |
Data are for treatment-emergent AEs in all cohort 1 patients. Listed events were reported in ≥10% of patients (all grade) or for grade ≥3, in ≥5% in either arm. Events are listed in descending order of frequency by all-grade incidence in the ibrutinib arm.
The difference in all-grade incidence between arms is ≥10%. P = .05, P = .005, and P = .02 for comparisons of all-grade diarrhea, muscle spasms, and peripheral edema, respectively. P = .0004 and P = .02 for the comparisons of all-grade and grade ≥3 atrial fibrillation, and P = .002 and P = .02 for all-grade and grade ≥3 pneumonia, respectively. All P values (1-sided, testing ibrutinib > zanubrutinib event rates) were calculated using Barnard’s exact test without adjustment for multiplicity.
Includes the Medical Dictionary for Regulatory Activities–preferred term “neutrophil count decreased” in 1 and 4 patients in the ibrutinib and zanubrutinib arms, respectively.
P = .08, P = .001, and P = .009 for the comparisons of all-grade bleeding, atrial fibrillation, and neutropenia, respectively. P = .05 and P = .03 for the comparisons of grade ≥3 atrial fibrillation and neutropenia, respectively. All P values are 2-sided without adjustment for multiplicity.38
Infections were common in both arms (Table 3). Grade ≥3 infections were similar between arms, although the incidence of pneumonia was higher among ibrutinib patients. One zanubrutinib-treated patient developed cryptococcal sepsis, whereas 2 ibrutinib-treated patients developed esophageal candidiasis. Two R/R zanubrutinib patients exhibited findings consistent with hepatitis B virus reactivation (1 while taking lamivudine); both were managed with treatment interruption and antiviral therapy. More ibrutinib-treated patients than zanubrutinib-treated patients received anti-infective therapies (83% and 63%, respectively). Exposure-adjusted grade 1/2 bleeding incidence was higher among ibrutinib patients; major hemorrhage was reported in 6 zanubrutinib patients and 9 ibrutinib patients. Ibrutinib patients experienced an ∼10-fold higher incidence of atrial fibrillation/flutter and approximately twofold increased frequency of hypertension on an exposure-adjusted basis (Table 3). Atrial fibrillation occurred within 6 months of treatment onset in 7 ibrutinib-treated patients and 1 zanubrutinib-treated patient; 4 ibrutinib-treated patients and no zanubrutinib-treated patient had onset of atrial fibrillation >12 months after treatment onset. Onset of hypertension beyond 12 months also occurred more frequently in the ibrutinib vs the zanubrutinib (6 patients vs 1 patient) treatment arm. Zanubrutinib patients experienced more than twofold the incidence of any grade (25% vs 12%) and grade ≥3 (20% vs 8%) neutropenia vs ibrutinib patients. More neutropenic patients in the zanubrutinib arm received granulocyte colony-stimulating factor than in the ibrutinib arm (47% vs 31%). Time to event plots for the first occurrence of AEIs by treatment arm are provided in Figure 4.
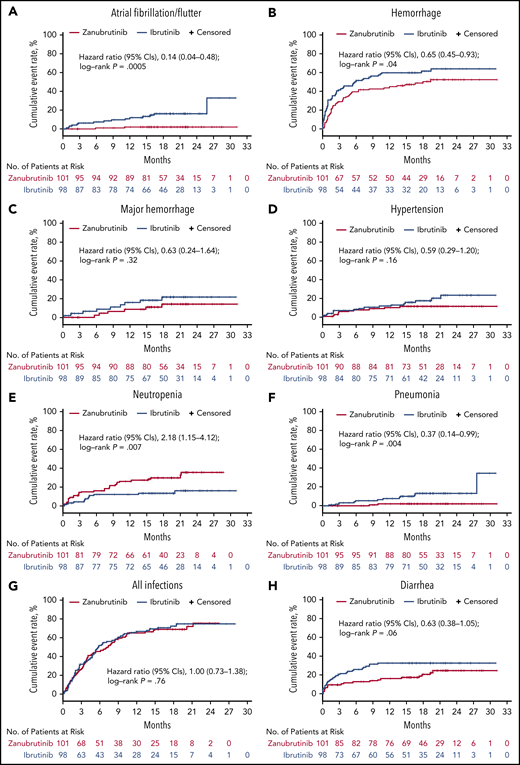
Time-to-event analyses for AEIs. Time-to-event analyses for atrial fibrillation/flutter (A), hemorrhage (including minor bleeding/bruising) (B), major hemorrhage (C), hypertension (D), neutropenia (E), pneumonia (F), all infections (G), and diarrhea (H).
Time-to-event analyses for AEIs. Time-to-event analyses for atrial fibrillation/flutter (A), hemorrhage (including minor bleeding/bruising) (B), major hemorrhage (C), hypertension (D), neutropenia (E), pneumonia (F), all infections (G), and diarrhea (H).
More ibrutinib than zanubrutinib patients required dose reductions for AEs (23% vs 14%, respectively). Nine (9%) ibrutinib patients discontinued study treatment for AEs (myocardial infarction, bacterial sepsis, sepsis, death, cause unspecified, drug-induced liver injury, hepatitis, interstitial lung disease, pneumonia, and pneumonitis). Four (4%) zanubrutinib patients discontinued study treatment due to AEs (subdural hemorrhage, cardiac arrest, neutropenia, and IgA multiple myeloma).
In most QoL assessments, zanubrutinib trended toward greater improvement, particularly among patients who achieved a VGPR (supplemental Figure 2). This was most notable in the European Quality of Life Five Dimensions Questionnaire and European Organization for Research and Treatment of Cancer Quality of Life Questionnaire-Core 30 subscales of appetite, dyspnea, fatigue, physical functioning, and role functioning. The symptom subscale for diarrhea trended worse for ibrutinib patients than for zanubrutinib patients, consistent with the frequency of diarrhea reported for each treatment arm.
Discussion
Most studies of BTK-inhibitor therapy in WM have been single-arm trials that have reported variable safety and tolerability owing to differences in study populations, prior treatment history, and the toxicity profiles of individual BTK inhibitors.8,11,31,32 Here, we report results from the largest randomized controlled trial of BTK-inhibitor monotherapy in WM to date and the only study comparing outcomes for 2 different BTK inhibitors.
This study demonstrated greater frequency of VGPRs among zanubrutinib-treated patients than among ibrutinib-treated patients after a median follow-up of 19.4 months. Phase 2 studies of ibrutinib and zanubrutinib have demonstrated improved response quality with longer treatment.10,11,21 A 27% VGPR rate was reported in the phase 2 ibrutinib study of R/R WM patients after a median treatment duration of almost 4 years.11 In the phase 2 zanubrutinib study, 51% of 49 R/R patients achieved a VGPR or CR after a median follow-up of 36 months.31 Thus, the full potential for zanubrutinib patients to achieve CR/VGPR may not have been fully realized at the time of this analysis. Longer follow-up will allow an assessment of whether deeper responses correlate with more durable disease control, as has been observed with conventional therapies.32,33
One unanticipated outcome of this study was the low proportion of patients with a CXCR4WHIM mutation (9% overall) compared with historical series.10,34 Reasons for this include the use of Sanger sequencing for CXCR4 mutation detection. Because CXCR4 mutation status was a stratification variable, this was deemed the most expedient approach to identifying patients with common CXCR4WHIM mutations. A 10% to 15% lower limit of mutant allele detection, the subclonal nature of CXCR4WHIM mutations, and the lack of B-cell enrichment likely contributed to an underrepresentation of patients with documented CXCR4WHIM mutations at randomization.35 A post hoc analysis of baseline bone marrow from 190 (95%) patients using next-generation sequencing for CXCR4 mutation detection (lower limit of mutant allele detection, 0.25%; see supplemental Methods) revealed the presence of CXCR4WHIM mutations in 53 (28%) patients. VGPR rates based on next-generation sequencing data were comparable to those reported in the primary efficacy analysis based on Sanger sequencing, with zanubrutinib demonstrating a higher rate overall (29% and 21% among zanubrutinib and ibrutinib patients, respectively), as well as among CXCR4WT patients (34% and 24%, respectively) and CXCR4WHIMpatients (18% and 10%, respectively), despite an imbalance in the number of patients with CXCRWHIMmutations favoring ibrutinib (34% and 22%, respectively) (supplemental Table 9).
Given that IgM overproduction is the hallmark of WM, the ability to reduce IgM provides an additional efficacy metric with which to evaluate BTK inhibitors. In this regard, results of 2 separate analyses demonstrated significantly deeper and more sustained IgM reductions with zanubrutinib vs ibrutinib.
We observed several clinically significant differences in the safety and tolerability profiles of the 2 BTK inhibitors, likely consistent with the higher degree of selectivity of zanubrutinib for BTK vs off-target kinases. Atrial fibrillation and hypertension were reported at greater frequencies with ibrutinib compared with zanubrutinib. Atrial fibrillation is a well-recognized complication of ibrutinib therapy, and relative to an age-matched controlled population, patients appear to be at continuously increased risk for development of atrial fibrillation over the course of therapy.36 Age ≥65 years and history of atrial fibrillation were identified as independent risk factors for atrial fibrillation in a pooled analysis of 4 randomized controlled studies of ibrutinib.36 An analysis of this study suggests that the risk for development of atrial fibrillation later in the course of therapy was disproportionately higher with ibrutinib compared with zanubrutinib. Likewise, ibrutinib treatment has been associated with a significant cumulative risk for the development of hypertension.37 In this study, the cumulative incidence of hypertension was higher in the ibrutinib treatment arm, with more ibrutinib-treated patients presenting with hypertension later in their treatment course.
In our study, zanubrutinib treatment was associated with less minor bleeding or bruising, as well as fewer major hemorrhages, than ibrutinib treatment. The combined effects of tyrosine kinase expressed in hepatocellular carcinoma and BTK inhibition in platelets of ibrutinib-treated patients may explain the higher frequency of bleeding noted among ibrutinib patients.17 Consistent with prior experience, the frequency of diarrhea among zanubrutinib patients in our study was half that reported among ibrutinib patients, on an exposure-adjusted basis (1.3 and 2.6 events per 100 person-months, respectively), likely due to less potent inhibition of epidermal growth factor receptor by zanubrutinib.20
Grade 3 neutropenia (including febrile neutropenia) was more common among zanubrutinib patients. Because both agents inhibit BTK in neutrophil precursors by similar mechanisms, higher rates of severe neutropenia among zanubrutinib patients may be a function of its greater bioavailability.20 Importantly, the higher incidence of severe neutropenia did not result in a higher infection incidence compared with that for ibrutinib. Paradoxically, the incidence of some respiratory tract infections (notably pneumonias) was higher among ibrutinib recipients.
The pharmacokinetics, pharmacodynamics, and selectivity profile of zanubrutinib predict that it has the potential to be more efficacious with a superior safety profile vs ibrutinib. This study established that zanubrutinib is highly effective in the treatment of WM; zanubrutinib is associated with important safety advantages, especially with respect to cardiovascular toxicity. Although the study did not meet its primary end point, there was a trend toward better disease control for zanubrutinib vs ibrutinib, including higher rates of VGPR, greater and more sustained IgM reduction, and greater improvement in most QoL measures. Longer follow-up will allow for a more comprehensive assessment of the relative efficacy and safety profiles of zanubrutinib and ibrutinib.
Presented in abstract form at the 56th annual meeting of the American Society of Clinical Oncology, virtual, 29 May 2020, and at the 56th Annual Meeting of the American Society of Clinical Oncology, virtual, 29 May 2020.
Individual participant data will not be shared prior to regulatory approval of zanubrutinib for the treatment of WM. Requests for copies of the protocol and statistical analysis plan will be considered; please contact Constantine S. Tam (constantine.tam@petermac.org).
The online version of this article contains a data supplement.
The publication costs of this article were defrayed in part by page charge payment. Therefore, and solely to indicate this fact, this article is hereby marked “advertisement” in accordance with 18 USC section 1734.
Acknowledgments
The authors thank the patients who participated in the study, their supporters, and the investigators and clinical research staff from the study centers.
This study was supported by research funding from BeiGene Inc, US medical writing and editorial assistance were funded by BeiGene and provided by Gordon Bray and Alessandra Richardson (Bio Connections, LLC). The study sponsor confirmed the accuracy of the data and compiled the data for analysis.
Authorship
Contribution: C.S.T., S.O., S.D., W.J., H.-P.L., G.C., R.G.O., P.M., B.E.W., R.G.S., H.M., S.M., A.T., J.J.C., J.C., C.F.d.L., D.B., E.L., J.V.M., M.M., T.S., M. Tani, M. Trneny, M.C.M., C.B., V.L., J.T., and M.D. (investigators) collected data; W.Y.C., J.S., S.R., A.C., and J.H. (BeiGene employees), C.S.T., R.G.O., A.T., C.B., V.L. (ASPEN study steering committee members), and J.T. (advisor) were responsible for study design, and, with M.D., S.D., R.G.S., and J.C., further contributed to data interpretation and analysis; and all authors contributed to data interpretation, reviewed the manuscript, made the decision to submit it for publication, vouched for the accuracy and completeness of the data, analyses, and adherence to the trial protocol.
Conflict-of-interest disclosure: C.S.T. receives research funding from Janssen and AbbVie and receives honoraria from Janssen, AbbVie, BeiGene, Novartis, and Roche. S.O. consults for AbbVie, Janssen, Gilead Sciences, Roche, Mundipharma, Merck, Bristol Myers Squibb, and Celgene; receives research funding from AbbVie, BeiGene, Janssen, Gilead Sciences, Roche, Celgene, and Epizyme; and receives honoraria from AbbVie, Janssen, Gilead Sciences, Roche, Mundipharma, Merck, Bristol Myers Squibb, and Celgene. S.D. participates in the speaker’s bureau for Amgen, receives research funding from Janssen and BeiGene, and has travel expenses paid by Janssen. W.J. consults for AstraZeneca, Debiopharm, Janssen, Gilead Sciences, and Roche and receives research funding from Acerta, AstraZeneca, Janssen, BeiGene, Bayer, Celltrion, Debiopharm, Epizyme, Merck, MorphoSys, MEI Pharma, Servier, Roche, and TG Therapeutics. H.-P.L. has equity ownership in CSL Behring, receives honoraria from Roche, and has travel expenses paid by AbbVie. G.C. receives research funding from BeiGene, Acerta, and Glycomimetics. R.G.O. receives honoraria from Janssen and Celgene and consults for, and has travel expenses paid by, Janssen. B.E.W. consults for Roche and receives research funding from Roche and Gilead Sciences. R.G.S. consults for Janssen; receives honoraria from Janssen, Takeda, and Amgen; receives research funding from Gilead Sciences and Incyte; and has travel expenses paid by Janssen and Takeda. H.M. receives honoraria from Janssen and consults for AstraZeneca. A.T. consults for and receives honoraria from Janssen SpA, AstraZeneca, and AbbVie. J.C. consults for BeiGene, Janssen, Kymera Therapeutics, and Pharmacyclics and receives research funding from AbbVie, BeiGene, Janssen, Pharmacyclics, and TG Therapeutics. C.F.d.L. consults for and receives honoraria from Janssen, Celgene, and Amgen and receives research funding from, and has travel expenses paid by, Janssen, Celgene, Amgen, and Takeda. D.B. consults for, receives research funding from, and has travel expenses paid by Roche, Takeda, and Gilead Sciences. E.L. consults for Akcea Therapeutics, Adaptive Phage Therapeutics, and Pharmacyclics. J.M. consults for Celgene and Pharmacyclics, receives honoraria from Celgene, and participates in the speaker’s bureau for Celgene. M.M. consults for Roche and Janssen. T.S. consults for AstraZeneca, Kite Pharma, Juno Therapeutics, and BeiGene; receives research funding from Pharmacyclics, Juno, BeiGene, Astra Zeneca, TG Therapeutics, and Celgene; and participates in the speaker’s bureau for Pharmacyclics, Janssen, AstraZeneca, and Seattle Genetics. M. Trneny is an employee of Charles University General Hospital; receives honoraria from Janssen, Gilead Sciences, Takeda, Bristol Myers Squibb, Amgen, AbbVie, Roche, MorphoSys, and Incyte; and consults for Takeda, Bristol Myers Squibb, Incyte, AbbVie, Amgen, Roche, Gilead Sciences, Janssen, Celgene, and MorphoSys. M.C.M. consults for Kite/Gilead and Servier and has travel expenses paid by Celgene. C.B. receives honoraria from, consults for, and participates in the speaker’s bureau for Roche, Janssen, Celltrion, and BeiGene and receives research funding from Roche, Janssen, and BeiGene. V.L. receives honoraria from AstraZeneca, Roche, Gilead Sciences, Amgen, AbbVie, and Janssen; consults for AstraZeneca, AbbVie, Roche, and Janssen; participates in the speaker’s bureau for AbbVie and Janssen; and has travel expenses paid by AbbVie, Roche, and Janssen. J.T. receives research funding from BeiGene, Celgene, a Bristol-Myers Squibb Company, Pharmacyclics, Roche, and Takeda. W.Y.C. is an employee of BeiGene and has equity ownership in BeiGene and Bristol Myers Squibb. J.S. is an employee of and has equity ownership in BeiGene. S.R. is an employee of BeiGene, has equity ownership in BeiGene and Amgen, and holds patents and receives royalties from Roche Molecular Diagnostics. A.C. is an employee of, has equity ownership in, and has travel expenses paid by BeiGene. J.H. is an employee of, has a leadership role at, and has equity ownership in BeiGene. M.D. consults for and receives honoraria from Amgen, Janssen, Takeda, Celgene, and Bristol Myers Squibb. The remaining authors declare no competing financial interests.
A complete list of the ASPEN investigators appears in the supplemental Appendix.
Correspondence: Constantine S. Tam, Peter MacCallum Cancer Centre, 305 Grattan St, Parkville, VIC 3050, Australia; e-mail: constantine.tam@petermac.org.
