

Key Points
A novel RUNX1 mutation that precludes its methylation has been found in a familial AML pedigree.
Loss of RUNX1 methylation in HSCs confers resistance to apoptosis, a hallmark of a preleukemic clone.

Abstract
RUNX1 is among the most frequently mutated genes in human leukemia, and the loss or dominant-negative suppression of RUNX1 function is found in myelodysplastic syndrome and acute myeloid leukemia (AML). How posttranslational modifications (PTMs) of RUNX1 affect its in vivo function, however, and whether PTM dysregulation of RUNX1 can cause leukemia are largely unknown. We performed targeted deep sequencing on a family with 3 occurrences of AML and identified a novel RUNX1 mutation, R237K. The mutated R237 residue is a methylation site by protein arginine methyltransferase 1, and loss of methylation reportedly impairs the transcriptional activity of RUNX1 in vitro. To explore the biologic significance of RUNX1 methylation in vivo, we used RUNX1 R233K/R237K double-mutant mice, in which 2 arginine-to-lysine mutations precluded RUNX1 methylation. Genetic ablation of RUNX1 methylation led to loss of quiescence and expansion of hematopoietic stem cells (HSCs), and it changed the genomic and epigenomic signatures of phenotypic HSCs to a poised progenitor state. Furthermore, loss of RUNX1 R233/R237 methylation suppressed endoplasmic reticulum stress–induced unfolded protein response genes, including Atf4, Ddit3, and Gadd34; the radiation-induced p53 downstream genes Bbc3, Pmaip1, and Cdkn1a; and subsequent apoptosis in HSCs. Mechanistically, activating transcription factor 4 was identified as a direct transcriptional target of RUNX1. Collectively, defects in RUNX1 methylation in HSCs confer resistance to apoptosis and survival advantage under stress conditions, a hallmark of a preleukemic clone that may predispose affected individuals to leukemia. Our study will lead to a better understanding of how dysregulation of PTMs can contribute to leukemogenesis.
Introduction
RUNX1 is one of the most commonly mutated/altered genes in a variety of hematologic diseases, including acute myeloid leukemia (AML), therapy-related leukemia, myelodysplastic syndrome (MDS), and familial platelet disorder with associated myeloid malignancy.1,2 Since the first identification of RUNX1 as a gene located on the breakpoint of chromosomal translocation t(8;21), which creates the RUNX1-ETO fusion gene, many chromosomal translocations involving the RUNX1 gene have been reported in leukemia, including RUNX1-MECOM, ETV6-RUNX1, and RUNX1-CBFA2T3 fusion genes.3,4 Somatic and germline point mutations in the RUNX1 gene are also frequently found.5-7 Multiple lines of evidence indicate that most RUNX1 missense mutations are clustered in the conserved Runt DNA-binding domain and result in defective DNA binding, and that truncating nonsense and frameshift mutations are distributed along the entire coding sequence. However, it is not well understood how missense mutations outside the Runt domain lead to leukemia.
Transcription factors are regulated not only by transcriptional and translational control but also by alternative splicing and posttranslational modifications (PTMs). PTMs include phosphorylation, acetylation, ubiquitination, SUMOylation, glycosylation, and methylation, and they represent an important layer of regulation for fine-tuning transcriptional activity.8 Indeed, numerous biochemical and cellular studies have confirmed that RUNX1 activity is regulated either positively or negatively by PTMs in vitro.9-11 However, unexpectedly, previous mice models with mutant RUNX1 PTMs were phenotypically normal or showed a minimal phenotype.12,13 Hence, the physiologic relevance of RUNX1 PTMs is largely unknown.
Here we report a family with 3 occurrences of AML. Targeted deep sequencing discovered a novel mutation in RUNX1 that precluded RUNX1 methylation. By using a corresponding mice model, we show that methylation-deficient mutations of RUNX1 lead to an expanded and less quiescent hematopoietic stem cell (HSC) pool with progenitor cell gene priming. We also uncover that defective RUNX1 methylation in HSCs confers resistance to apoptosis induced by endogenous and genotoxic stress, and a subsequent survival advantage under stress conditions, which can explain a preleukemic state in the affected individuals.
Methods
Subjects and samples
Informed consent was obtained from all participating subjects in accordance with the Declaration of Helsinki, and the studies were approved by the Human Research Ethics Committee of Kumamoto University School of Medicine. Genomic DNA was extracted from peripheral blood.
Mice
Runx1KTAMK/KTAMK mice were previously described13 and used after more than 5 backcrosses to C57BL/6N mice. Animal care was in accordance with the guidelines of the National University of Singapore.
Fluorescence-activated cell sorting analysis and sorting of mouse bone marrow cells
Fluorescence-activated cell sorting (FACS) analysis and sorting were performed as previously described.14 Briefly, bone marrow cells were harvested from femurs, tibias, and the spine of 2- to 4-month-old age- and sex-matched mice. The cells were dissociated to a single-cell suspension by filtering through a 70-μm nylon mesh. Cells were Fc-blocked and stained with anti-mouse primary antibodies for 60 minutes. All antibodies were purchased from Thermo Fisher Scientific, BD Biosciences, or BioLegend. For sorting, cKit+ cells were preenriched with the CD117 MicroBeads and the MACS LS columns (Miltenyi Biotec). For intracellular analysis, cells were stained by using Cytofix/Cytoperm Fixation/Permeabilization Solution (BD Biosciences) in accordance with the manufacturer’s instructions. Aldehyde dehydrogenase (ALDH) enzymatic activity was measured by using the Aldefluor kit (Stemcell Technologies). For apoptosis analysis, cells were stained with Annexin V, Alexa Fluor 488, or APC conjugate (Thermo Fisher Scientific), Hoechst 33342, and Annexin V Binding Buffer (BD Biosciences). Cells were analyzed or sorted by using LSRII and FACS Aria II cytometers (BD Biosciences). Subsequent data analyses were performed with the FlowJo analysis software (FlowJo, LLC).
Bone marrow transplantation
Bone marrow cells were harvested from control and Runx1KTAMK/KTAMK (Ly5.2) mice, and a mixture of 2 × 10⁵ test cells and 1 × 10⁶ competitor cells from C57BL/6-Ly5.1 mice were transplanted into lethally irradiated (9.5 Gy, total body irradiation) C57BL/6-Ly5.1 congenic mice. Peripheral blood donor chimerism was analyzed monthly. Recipient mice were euthanized for analysis 4 months after bone marrow transplantation (BMT). Secondary transplantations into lethally irradiated C57BL/6-Ly5.1 mice were performed by using 2 × 10⁶ bone marrow cells from primary recipients. To provoke stress conditions, lethally irradiated (9.5 Gy) Ly5.1 recipient mice were coinjected with a mixture of indicated number of test cells (Ly5.2) and competitor whole bone marrow cells (Ly5.1). After BMT, mice were treated with 4 mg/kg of polyinosinic:polycytidylic acid (pIpC; InvivoGen) intraperitoneally twice a week or irradiated (2 Gy) once a week.
Statistical analysis
All values are presented as the mean ± standard deviation. Statistical analysis was performed by using the Student t test. Values were considered to be significant at P < .05. Other methods are provided in the supplemental Methods (available on the Blood Web site).
Results
Targeted deep sequencing detected a heterozygous RUNX1 mutation in individuals with familial AML
We performed targeted deep sequencing on a family with 3 occurrences of AML. The family pedigree is shown in Figure 1A. The proband (II-1) had AML (M1), patient II-2 had refractory anemia with excess blasts/AML, and patient II-8 had AML (M2) (Table 1). Genomic DNA samples were extracted from the peripheral blood of 3 affected and 2 unaffected individuals of this family (II-1, II-2, II-8, III-1, and III-2), and all coding exons of 545 candidate genes that can be involved in malignancy (supplemental Table 1) were sequenced. After removing variations in untranslated regions, variations registered in the dbSNP database15 or the 1000 Genomes Project,16 and synonymous variations, only one RUNX1 mutation was detected as common among the 3 affected individuals but not shared with the 2 unaffected individuals. Subsequent Sanger sequencing confirmed a heterozygous mutation that caused amino acid substitution from arginine (AGG) to lysine (AAG) (R237K; p.Arg210Lys and c.629G>A for RUNX1a or RUNX1b, and p.Arg237Lys and c.710G>A for RUNX1c) (Figure 1B). Although the mutated arginine residue was outside the Runt DNA-binding domain where most previously reported mutations were located (Figure 1C),1 comparative genomics showed that the mutated residue was completely conserved among species and among RUNX family proteins (Figure 1D-E), implicating its functional importance. Indeed, the mutated R237 is one of two arginine residues (R233 and R237) methylated by protein arginine methyltransferase 1 (PRMT1). RUNX1 methylation by PRMT1 dissociates the transcription corepressor, SIN3 transcription regulator family member A (SIN3A), and potentiates the transcriptional activity of RUNX1.11 Thus, loss of RUNX1 methylation by the R237K mutation was considered to be the most likely cause of familial AML in this pedigree.

A novel RUNX1 germline mutation found in a pedigree of familial AML. (A) A family tree. Closed symbols indicate individuals with AML. Patient II-1 had AML (M1), patient II-2 had refractory anemia with excess blasts/AML, and patient II-8 had AML (M2). The proband is indicated by the arrow. Genomic DNA samples from individuals II-1, II-2, II-8, III-1, and III-2 were collected. (B) Sanger sequence analysis of the coding region of RUNX1. All 3 affected individuals had the heterozygous germline G to A mutation, which caused the amino acid change from arginine (AGG) to lysine (AAG). The mutation was not present in the unaffected individuals. (C) The position of the detected R237K mutation in RUNX1. The Runt DNA-binding domain (Runt), the activation domain (AD), and the inhibitory domain (ID) are indicated. The mutated arginine residue was outside the Runt DNA-binding domain and one of the 2 methylation sites (R233 and R237) by PRMT1. (D) Alignments of the region flanking R237 in human RUNX1 with isotypes from various species. Amino acids not conserved between human and other species are shown in red. The region around the mutated residue is highly conserved among species. (E) Alignments of human RUNX1, RUNX2, and RUNX3. Amino acids not conserved are shown in red. The mutated residue is conserved among human RUNX proteins.
A novel RUNX1 germline mutation found in a pedigree of familial AML. (A) A family tree. Closed symbols indicate individuals with AML. Patient II-1 had AML (M1), patient II-2 had refractory anemia with excess blasts/AML, and patient II-8 had AML (M2). The proband is indicated by the arrow. Genomic DNA samples from individuals II-1, II-2, II-8, III-1, and III-2 were collected. (B) Sanger sequence analysis of the coding region of RUNX1. All 3 affected individuals had the heterozygous germline G to A mutation, which caused the amino acid change from arginine (AGG) to lysine (AAG). The mutation was not present in the unaffected individuals. (C) The position of the detected R237K mutation in RUNX1. The Runt DNA-binding domain (Runt), the activation domain (AD), and the inhibitory domain (ID) are indicated. The mutated arginine residue was outside the Runt DNA-binding domain and one of the 2 methylation sites (R233 and R237) by PRMT1. (D) Alignments of the region flanking R237 in human RUNX1 with isotypes from various species. Amino acids not conserved between human and other species are shown in red. The region around the mutated residue is highly conserved among species. (E) Alignments of human RUNX1, RUNX2, and RUNX3. Amino acids not conserved are shown in red. The mutated residue is conserved among human RUNX proteins.
Clinical and laboratory features of affected individuals
| Feature | II-1 | II-2 | II-8 |
|---|---|---|---|
| Age at onset (y), sex | 60, male | 62, male | 50, female |
| Diagnosis | AML (M1) | RAEB/AML* | AML (M2) |
| Hemoglobin, g/dL | 6.3 | 11.9 | 7.3 |
| Platelet count (×109/L) | 10 | 39 | 12 |
| White blood cells (×109/L) | 1.9 | 3.2 | 18.9 |
| Blasts in peripheral blood, % | 30 | 0 | 38 |
| Blasts in bone marrow, % | 70.8 | 6.8* | 63.2 |
| Chromosome | 48,XY,+der(1q7p),-7, | 48,XY,del(5)(q?),7p?,inv(9)(p11q13), | Initial: 46,XX[20] |
| inv(9p+q-),20q-,+2mar[3] | −13,-14,-17,+21,+4mar[4] | Relapse: 46,XX,t(1;14)(p36;q11), | |
| /46,XY,inv(9p+q-)[1] | /46,XY,inv(9)(p11q13)[16] | t(15;17)(q26;q25)[3] | |
| /46XX,t(2;18)(q23;q21)[2]/46,XX[13] | |||
| Immunophenotyping | HLA-DR,CD34,CD7,CD13,CD33 | HLA-DR,CD34,CD13,CD33,CD117 | HLA-DR,CD34,CD7,CD13, |
| CD33,CD4,CD25 | |||
| Chemotherapy | Low-dose cytarabine | None | Idarubicin + cytarabine (IDR/Ara-C) |
| -4826024955400Complete remission | 0 mo | 0 mo | 6 mo |
RAEB, refractory anemia with excess blasts.
II-2 developed AML 8 months later and blasts in bone marrow were 47.0%. Clinical or laboratory data of I-1 were not available.
Loss of RUNX1 R233/R237 methylation in genetically modified mice expands a phenotypic HSC pool with less quiescence
To explore the biologic significance of RUNX1 methylation in vivo, we used RUNX1 R233K/R237K double-mutant Runx1KTAMK/KTAMK mice, in which 2 arginine-to-lysine (RTAMR-to-KTAMK) mutations precluded RUNX1 methylation by PRMT1 (Figure 2A). We previously reported that Runx1KTAMK/KTAMK mice exhibited a slight decrease in lymphocytes and a slight increase in neutrophils and monocytes in peripheral blood, and a reduction of T cells in spleen.13 In addition, detailed analysis of Runx1KTAMK/KTAMK bone marrow showed that the percentage of CD34–Flt3– Lin–Sca1+cKit+ (LSK) long-term HSCs (LT-HSCs) increased approximately twofold, and that CD34+Flt3– LSK short-term HSCs also increased in Runx1KTAMK/KTAMK mice (Figure 2B). Phenotypic analysis of HSCs and multipotent progenitors (MPPs) using SLAM markers also showed an increase of HSCs, multipotent MPP2, and myeloid-biased MPP3 in Runx1KTAMK/KTAMK mice (Figure 2C). Conversely, loss of RUNX1 R233/R237 methylation did not alter more committed progenitors and Lin+ cells in bone marrow, except for a slight increase of the Lin–Sca1–cKit+ progenitor fraction (supplemental Figure 1A-B). Cell cycle analysis revealed that Runx1KTAMK/KTAMK LT-HSCs were less quiescent, which could explain the increase of LT-HSCs (Figure 2D).
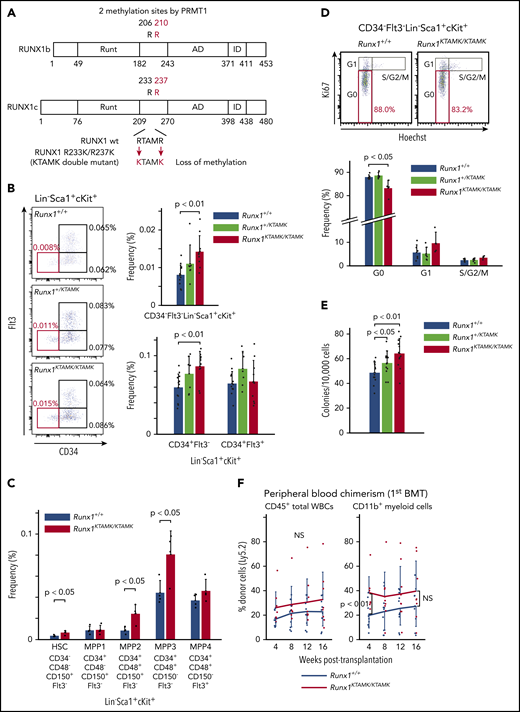
Loss of RUNX1 R233/R237 methylation in RUNX1 R233K/R237K double-mutant Runx1KTAMK/KTAMKmice expands a phenotypic HSC pool with less quiescence. (A) A schema showing loss of RUNX1 methylation in RUNX1 R233K/R237K double-mutant Runx1KTAMK/KTAMK mice. Two arginine-to-lysine (RTAMR-to-KTAMK) mutations (red) preclude RUNX1 methylation by PRMT1. (B) Increase of phenotypic HSCs in Runx1KTAMK/KTAMK mice. The left panel shows representative FACS plots of Lin–Sca1+cKit+ (LSK) cells in Runx1+/+ (upper), Runx1+/KTAMK (middle), and Runx1KTAMK/KTAMK (lower) mice. The LT-HSC subset is shown in red. Numbers shown are mean percentages of total live bone marrow cells. The right graphs show mean frequencies of CD34–Flt3– LSK cells (upper), CD34+Flt3– LSK cells, and CD34+Flt3+ LSK cells (lower) in Runx1+/+ (blue), Runx1+/KTAMK (light green), and Runx1KTAMK/KTAMK (red) mice (n = 7-13 mice; 8-16 weeks old). (C) Phenotypic analysis of HSCs and MPPs using SLAM markers. The graph shows mean frequencies of HSCs and MPPs in Runx1+/+ (blue) and Runx1KTAMK/KTAMK (red) mice (n = 4 mice; 8 weeks old). (D) Loss of quiescence in Runx1KTAMK/KTAMK LT-HSCs. The upper panel shows representative FACS plots of CD34–Flt3– LSK cells in Runx1+/+ (left) and Runx1KTAMK/KTAMK (right) mice. The G0 subset is shown in red. The lower graph shows mean frequencies of each cell cycle subset among LT-HSCs from Runx1+/+ (blue), Runx1+/KTAMK (light green), and Runx1KTAMK/KTAMK (red) mice (n = 4-6 mice; 7-15 weeks old). (E) Increase of colony-forming units in total bone marrow cells from Runx1+/KTAMK (light green) and Runx1KTAMK/KTAMK (red) mice, compared with Runx1+/+ mice (blue) (n = 12 from 4 mice per genotype; 9 to 11 weeks old; from 4 independent experiments). (F) Competitive reconstitution assay in which Runx1+/+ (blue) or Runx1KTAMK/KTAMK (red) bone marrow cells were transplanted into irradiated recipient mice along with competitor cells. Lines show the frequency of donor-derived cells in peripheral blood after the first BMT at the indicated time intervals (n = 9 to 10 mice from 3 independent experiments). Donor cells were from mice 9 to 12 weeks old. Data on B cells and T cells are shown in supplemental Figure 1C. NS, not significant.
Loss of RUNX1 R233/R237 methylation in RUNX1 R233K/R237K double-mutant Runx1KTAMK/KTAMKmice expands a phenotypic HSC pool with less quiescence. (A) A schema showing loss of RUNX1 methylation in RUNX1 R233K/R237K double-mutant Runx1KTAMK/KTAMK mice. Two arginine-to-lysine (RTAMR-to-KTAMK) mutations (red) preclude RUNX1 methylation by PRMT1. (B) Increase of phenotypic HSCs in Runx1KTAMK/KTAMK mice. The left panel shows representative FACS plots of Lin–Sca1+cKit+ (LSK) cells in Runx1+/+ (upper), Runx1+/KTAMK (middle), and Runx1KTAMK/KTAMK (lower) mice. The LT-HSC subset is shown in red. Numbers shown are mean percentages of total live bone marrow cells. The right graphs show mean frequencies of CD34–Flt3– LSK cells (upper), CD34+Flt3– LSK cells, and CD34+Flt3+ LSK cells (lower) in Runx1+/+ (blue), Runx1+/KTAMK (light green), and Runx1KTAMK/KTAMK (red) mice (n = 7-13 mice; 8-16 weeks old). (C) Phenotypic analysis of HSCs and MPPs using SLAM markers. The graph shows mean frequencies of HSCs and MPPs in Runx1+/+ (blue) and Runx1KTAMK/KTAMK (red) mice (n = 4 mice; 8 weeks old). (D) Loss of quiescence in Runx1KTAMK/KTAMK LT-HSCs. The upper panel shows representative FACS plots of CD34–Flt3– LSK cells in Runx1+/+ (left) and Runx1KTAMK/KTAMK (right) mice. The G0 subset is shown in red. The lower graph shows mean frequencies of each cell cycle subset among LT-HSCs from Runx1+/+ (blue), Runx1+/KTAMK (light green), and Runx1KTAMK/KTAMK (red) mice (n = 4-6 mice; 7-15 weeks old). (E) Increase of colony-forming units in total bone marrow cells from Runx1+/KTAMK (light green) and Runx1KTAMK/KTAMK (red) mice, compared with Runx1+/+ mice (blue) (n = 12 from 4 mice per genotype; 9 to 11 weeks old; from 4 independent experiments). (F) Competitive reconstitution assay in which Runx1+/+ (blue) or Runx1KTAMK/KTAMK (red) bone marrow cells were transplanted into irradiated recipient mice along with competitor cells. Lines show the frequency of donor-derived cells in peripheral blood after the first BMT at the indicated time intervals (n = 9 to 10 mice from 3 independent experiments). Donor cells were from mice 9 to 12 weeks old. Data on B cells and T cells are shown in supplemental Figure 1C. NS, not significant.
We next assessed how loss of RUNX1 R233/R237 methylation affected hematopoietic stem/progenitor cell (HSPC) potential in vitro and in vivo. Bone marrow cells from control Runx1+/+, Runx1+/KTAMK, and Runx1KTAMK/KTAMK mice were cultured in methylcellulose-based medium for 12 days. Runx1+/KTAMK and Runx1KTAMK/KTAMK bone marrow showed increased short-term colony-forming activity in vitro (Figure 2E). In agreement with the in vitro data, competitive BMT assays showed that Runx1KTAMK/KTAMK bone marrow cells exhibited higher myeloid-lineage reconstitution in peripheral blood in 4 weeks. However, Runx1KTAMK/KTAMK bone marrow cells did not show a statistically significant increase in reconstruction activity 16 weeks after the BMT in peripheral blood and bone marrow (Figure 2F; supplemental Figure 1C-D), and the higher repopulating capacity of Runx1KTAMK/KTAMK cells was totally lost in the secondary BMT (supplementary Figure 1E). This outcome may suggest that the higher short-term reconstitution capacity of Runx1KTAMK/KTAMK cells was canceled by exhaustion due to the loss of quiescence observed in Figure 2D.
Thus, although dispensable for hematopoietic cell differentiation to all lineages, the loss of RUNX1 R233/R237 methylation perturbs HSC quiescence and expands a phenotypic HSC pool with no improvement of long-term reconstitution activity.
Defects in RUNX1 methylation impair the HSC signature and cause genetic priming to MPP differentiation in phenotypic LT-HSCs
To elucidate the nature of the Runx1KTAMK/KTAMK LT-HSC defects, RNA-sequencing of LT-HSCs from Runx1+/+ and Runx1KTAMK/KTAMK mice was performed (Figure 3A). First, we compared our RNA-sequencing data vs published data of RUNX1-depleted HSCs. Gene set enrichment analysis (GSEA) using gene sets of control and Runx1flox/flox; Vav1-Cre Flt3– LSK cells17 revealed that genes upregulated in Runx1flox/flox; Vav1-Cre Flt3– LSK cells were also enriched in Runx1KTAMK/KTAMK LT-HSCs, and that genes downregulated in Runx1flox/flox; Vav1-Cre Flt3– LSK cells were enriched in our control Runx1+/+ LT-HSCs (Figure 3B). This scenario indicates that in vivo loss of RUNX1 R233/R237 methylation in LT-HSCs at least partially phenocopies RUNX1 deficiency and conforms to in vitro observations that defective RUNX1 methylation impairs RUNX1 transcriptional activity.11,13
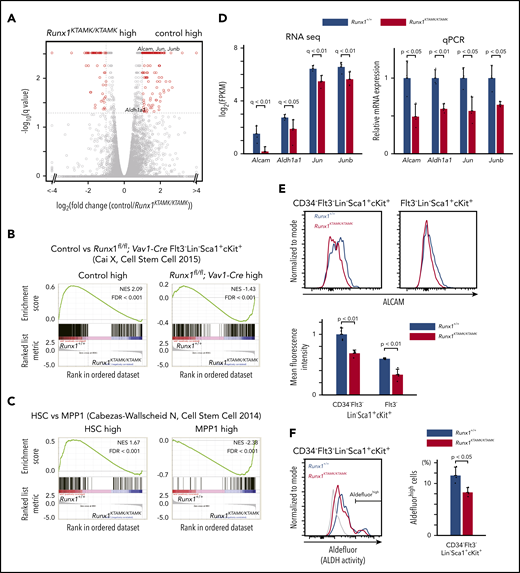
Transcriptomic analysis of Runx1KTAMK/KTAMKmice shows that Runx1KTAMK/KTAMKLT-HSCs exhibit progenitor cell gene priming. (A) A volcano plot showing the difference of mRNA expression between Runx1+/+ and Runx1KTAMK/KTAMK LT-HSCs. Each dot represents one gene. Genes with |log2 fold change| > 1 and false discovery rate (FDR) < 0.05 are shown in red (n = 3 mice, 8 to 10 weeks old). (B) GSEA plots comparing Runx1+/+ and Runx1KTAMK/KTAMK LT-HSCs using published data of control and Runx1flox/flox; Vav1-Cre Flt3– LSK cells. Each solid bar represents one gene within the gene set. (C) GSEA plots comparing Runx1+/+ and Runx1KTAMK/KTAMK LT-HSCs using published data of HSC and MPP1 signatures. (D) mRNA expression of HSC-related genes in Runx1+/+ (blue) and Runx1KTAMK/KTAMK (red) LT-HSCs as detected by RNA-sequencing (left) and quantitative polymerase chain reaction (qPCR) (right) (n = 3 mice). (E) Surface ALCAM expression detected by flow cytometry. The upper panels show representative flow cytometry plots of Runx1+/+ (blue) and Runx1KTAMK/KTAMK (red) CD34–Flt3– LSK cells (left) and Flt3– LSK cells (right). The mean fluorescence intensity of Runx1+/+ (blue) and Runx1KTAMK/KTAMK (red) cells is shown in the lower graph (n = 4 mice, 8 to 10 weeks old). (F) ALDH activity detected by Aldefluor. The left panel shows a representative flow cytometry plot of Runx1+/+ (blue) and Runx1KTAMK/KTAMK (red) CD34–Flt3– LSK cells. The fluorescence minus one control is shown in gray. The percentages of Aldefluorhigh cells in Runx1+/+ (blue) and Runx1KTAMK/KTAMK (red) LT-HSCs are shown in the right graph (n = 3 mice; 7-9 weeks old). NES, normalized enrichment score.
Transcriptomic analysis of Runx1KTAMK/KTAMKmice shows that Runx1KTAMK/KTAMKLT-HSCs exhibit progenitor cell gene priming. (A) A volcano plot showing the difference of mRNA expression between Runx1+/+ and Runx1KTAMK/KTAMK LT-HSCs. Each dot represents one gene. Genes with |log2 fold change| > 1 and false discovery rate (FDR) < 0.05 are shown in red (n = 3 mice, 8 to 10 weeks old). (B) GSEA plots comparing Runx1+/+ and Runx1KTAMK/KTAMK LT-HSCs using published data of control and Runx1flox/flox; Vav1-Cre Flt3– LSK cells. Each solid bar represents one gene within the gene set. (C) GSEA plots comparing Runx1+/+ and Runx1KTAMK/KTAMK LT-HSCs using published data of HSC and MPP1 signatures. (D) mRNA expression of HSC-related genes in Runx1+/+ (blue) and Runx1KTAMK/KTAMK (red) LT-HSCs as detected by RNA-sequencing (left) and quantitative polymerase chain reaction (qPCR) (right) (n = 3 mice). (E) Surface ALCAM expression detected by flow cytometry. The upper panels show representative flow cytometry plots of Runx1+/+ (blue) and Runx1KTAMK/KTAMK (red) CD34–Flt3– LSK cells (left) and Flt3– LSK cells (right). The mean fluorescence intensity of Runx1+/+ (blue) and Runx1KTAMK/KTAMK (red) cells is shown in the lower graph (n = 4 mice, 8 to 10 weeks old). (F) ALDH activity detected by Aldefluor. The left panel shows a representative flow cytometry plot of Runx1+/+ (blue) and Runx1KTAMK/KTAMK (red) CD34–Flt3– LSK cells. The fluorescence minus one control is shown in gray. The percentages of Aldefluorhigh cells in Runx1+/+ (blue) and Runx1KTAMK/KTAMK (red) LT-HSCs are shown in the right graph (n = 3 mice; 7-9 weeks old). NES, normalized enrichment score.
GSEA using gene sets of HSCs and a series of MPPs18 revealed that genes associated with MPPs were enriched in Runx1KTAMK/KTAMK LT-HSCs, whereas genes associated with normal HSCs were enriched in control Runx1+/+ LT-HSCs, indicating Runx1KTAMK/KTAMK LT-HSCs were primed for progenitor cell–specific gene expression (Figure 3C; supplemental Figure 2A). In agreement with these results, genes related to HSC function, including Alcam,19,20 Aldh1a1,21 Jun, and Junb,22 were downregulated in Runx1KTAMK/KTAMK LT-HSCs. Reduced expression of these genes was verified by quantitative polymerase chain reaction (Figure 3D). Activated leukocyte cell adhesion molecule (ALCAM), also known as CD166, mediates homophilic (CD166-CD166) and heterophilic (CD166-CD6) adhesion19 and is a functional marker of HSCs with high long-term repopulating potential.20 ALDH is also highly expressed in HSPCs and marks cells with high repopulating function.21 Consistent with the reduced messenger RNA (mRNA) expression of Alcam and Aldh1a1, cell surface ALCAM protein and intracellular ALDH activity were also decreased in Runx1KTAMK/KTAMK HSCs (Figure 3E-F). In addition, GSEA using the Gene Ontology biologic process database revealed that genes upregulated in Runx1KTAMK/KTAMK LT-HSCs were enriched in many cell cycle–related categories, reflecting the loss of quiescence in Runx1KTAMK/KTAMK LT-HSCs (supplemental Figure 2B-C).
Genetic ablation of RUNX1 R233/R237 methylation changes the epigenomic signature of LT-HSCs to a poised progenitor state
Next, we globally profiled chromatin accessibility in control and Runx1KTAMK/KTAMK LT-HSCs using assay for transposase-accessible chromatin using sequencing (ATAC-sequencing). Although overall chromatin accessibility was comparable between control and Runx1KTAMK/KTAMK LT-HSCs (Figure 4A), the Aldh1a1 promoter showed a higher peak in control LT-HSCs, reflecting higher expression of corresponding mRNA as detected by RNA-sequencing (Figure 4B). In contrast, the promoter regions of MPP-related genes (Rag1 and Rag2) and a cell cycle–related gene Ccnd1 had higher peaks in Runx1KTAMK/KTAMK LT-HSCs. De novo motif discovery revealed that the sequence TGTGGTTT, which completely matched the known RUNX1 motif, was enriched in regions with higher chromatin accessibility in control HSCs; this was not the case when examining the regions with higher peaks in Runx1KTAMK/KTAMK HSCs (Figure 4C). This scenario suggests that loss of RUNX1 R233/R237 methylation decreases its ability to open the chromatin regions around the RUNX1 binding sites.
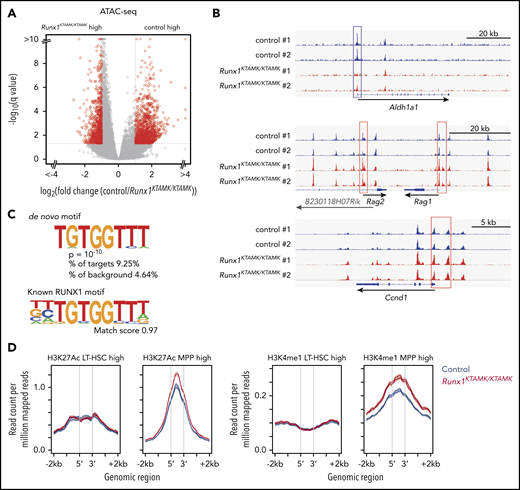
ATAC-sequencing analysis shows that loss of RUNX1 R233/R237 methylation changes the epigenomic signature of LT-HSCs to a poised progenitor state. (A) A volcano plot showing the difference of chromatin accessibility between Runx1+/+ and Runx1KTAMK/KTAMK LT-HSCs. Each dot represents one ATAC-sequencing peak. Peaks with |log2 fold change| > 1 and false discovery rate <0.05 are shown in red (n = 2 mice; 7-8 weeks old). (B) Representative ATAC-sequencing plots showing the chromatin accessibility in control (blue) and Runx1KTAMK/KTAMK (red) LT-HSCs. The upper plot around the Aldh1a1 gene locus shows the higher peaks in the promoter region (blue box) of control LT-HSCs. In contrast, the Rag1, Rag2 (middle), and Ccnd1 (lower) promoters (red box) have higher peaks in Runx1KTAMK/KTAMK LT-HSCs. (C) De novo motif discovery shows that the sequence TGTGGTTT was enriched in the regions with higher chromatin accessibility in control LT-HSCs compared with Runx1KTAMK/KTAMK LT-HSCs (upper). This sequence almost completely matches the known RUNX1 motif (lower). (D) ATAC-sequencing reads of control (blue) and Runx1KTAMK/KTAMK (red) LT-HSCs across LT-HSC–specific (left) or MPP-specific (red) ChIP-sequencing peak regions for H3K27Ac (left) and H3K4me1 (right).
ATAC-sequencing analysis shows that loss of RUNX1 R233/R237 methylation changes the epigenomic signature of LT-HSCs to a poised progenitor state. (A) A volcano plot showing the difference of chromatin accessibility between Runx1+/+ and Runx1KTAMK/KTAMK LT-HSCs. Each dot represents one ATAC-sequencing peak. Peaks with |log2 fold change| > 1 and false discovery rate <0.05 are shown in red (n = 2 mice; 7-8 weeks old). (B) Representative ATAC-sequencing plots showing the chromatin accessibility in control (blue) and Runx1KTAMK/KTAMK (red) LT-HSCs. The upper plot around the Aldh1a1 gene locus shows the higher peaks in the promoter region (blue box) of control LT-HSCs. In contrast, the Rag1, Rag2 (middle), and Ccnd1 (lower) promoters (red box) have higher peaks in Runx1KTAMK/KTAMK LT-HSCs. (C) De novo motif discovery shows that the sequence TGTGGTTT was enriched in the regions with higher chromatin accessibility in control LT-HSCs compared with Runx1KTAMK/KTAMK LT-HSCs (upper). This sequence almost completely matches the known RUNX1 motif (lower). (D) ATAC-sequencing reads of control (blue) and Runx1KTAMK/KTAMK (red) LT-HSCs across LT-HSC–specific (left) or MPP-specific (red) ChIP-sequencing peak regions for H3K27Ac (left) and H3K4me1 (right).
We next took advantage of published chromatin immunoprecipitation (ChIP)-sequencing data sets from LT-HSCs and MPPs for 2 histone modifications, histone H3 lysine 27 acetylation (H3K27Ac) for active enhancers and histone H3 lysine 4 monomethylation (H3K4me1) for both poised and active enhancers (Figure 4D). After identifying enhancer regions with a higher histone modification signal in LT-HSCs or MPPs, we compared ATAC peak signal in these regions between control and Runx1KTAMK/KTAMK LT-HSCs. Although we observed similar ATAC signal intensity in enhancer regions associated with LT-HSCs, MPP-associated enhancer regions exhibited a higher ATAC peak signal in Runx1KTAMK/KTAMK LT-HSCs. This indicates that Runx1KTAMK/KTAMK LT-HSCs have an epigenetic signature skewed toward MPPs. Because R233 and R237 are outside the DNA-binding domain, it is unlikely that mutant RUNX1 acquires the ability to bind to a novel motif other than the canonical RUNX1 motif and binds preferentially to the promoters/enhancers of MPP signature genes. Upregulation of MPP signature genes in Runx1KTAMK/KTAMK LT-HSCs is probably due to the secondary effect of loss of HSC signature genes.
Collectively, these analyses suggest that loss of RUNX1 R233/R237 methylation changes the genomic and epigenomic signature of phenotypic LT-HSCs to a poised progenitor state.
Defects in RUNX1 methylation confer resistance to apoptosis induced by endogenous and genotoxic stress
GSEA using the Gene Ontology biologic process database revealed that 3 pathways were significantly enriched in Runx1+/+ LT-HSCs compared with Runx1KTAMK/KTAMK LT-HSCs. Notably, all 3 of these pathways were related to unfolded protein response (UPR) and endoplasmic reticulum (ER) stress (Figure 5A; supplemental Figures 2B and 3A). We thus analyzed how loss of RUNX1 R233/R237 methylation affected cellular responses against ER stress. Runx1+/+ and Runx1KTAMK/KTAMK LT-HSCs were treated with the ER stress inducer tunicamycin, and the expression of a series of UPR genes was examined. As expected, defects in RUNX1 methylation diminished tunicamycin-stimulated induction of UPR genes, including Atf4, Ddit3, Gadd34, Atf6, Bip, Edem1, and Sec61a1. Subsequent apoptosis triggered by ER stress was also attenuated in Runx1KTAMK/KTAMK cells (Figure 5C).
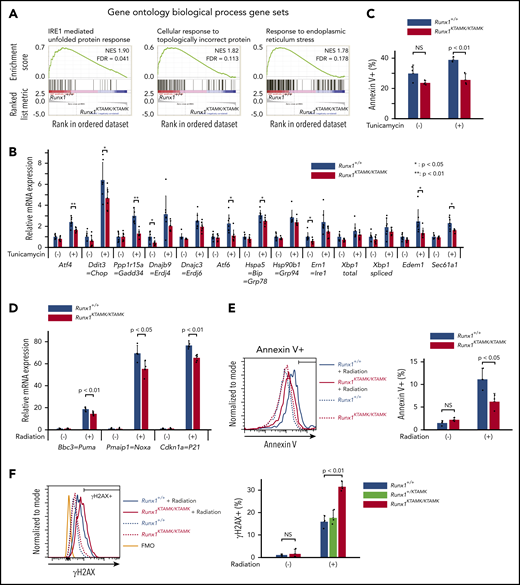
Defects in RUNX1 methylation confer resistance to apoptosis induced by endogenous and genotoxic stress. (A) GSEA plots comparing Runx1+/+ and Runx1KTAMK/KTAMK LT-HSCs using the Gene Ontology biological process database. The top 3 gene sets enriched in control Runx1+/+ LT-HSCs are shown. Each solid bar represents one gene within the gene set. (B) Induction of ER stress–related genes by UPR in Runx1+/+ and Runx1KTAMK/KTAMK LT-HSCs as shown by quantitative polymerase chain reaction. Runx1+/+ (blue) and Runx1KTAMK/KTAMK (red) LT-HSCs were sorted and cultured with or without tunicamycin (0.6 μg/mL) for 10 hours (n = 7 from 4 mice per genotype; 6-8 weeks old, from 4 independent experiments). (C) Apoptosis by ER stress in Runx1+/+ and Runx1KTAMK/KTAMK LT-HSCs as detected by flow cytometry. Cells were treated with tunicamycin (0.6 μg/mL) for 20 hours. The percentages of Annexin V+ cells in Runx1+/+ (blue) and Runx1KTAMK/KTAMK (red) LT-HSCs are shown (n = 3 from 2 mice per genotype; 6 to 8 weeks old, from 2 independent experiments). (D) Induction of p53 downstream genes by radiation in Runx1+/+ and Runx1KTAMK/KTAMK Flt3– LSK cells as shown by quantitative polymerase chain reaction. Runx1+/+ (blue) and Runx1KTAMK/KTAMK (red) mice were irradiated (3 Gy), and Flt3– LSK cells were harvested 3 hours later (n = 4 to 5 mice; 8-15 weeks old, from 5 independent experiments). (E) Apoptosis by radiation in Runx1+/+ and Runx1KTAMK/KTAMK Flt3– LSK cells as detected by flow cytometry. Mice were irradiated (3 Gy), and Flt3– LSK cells were harvested 18 hours later. The left panel shows a representative flow cytometry plot of Runx1+/+ (blue) and Runx1KTAMK/KTAMK (red) Flt3– LSK cells with (solid lines) or without (dashed lines) radiation. The percentages of Annexin V+ cells in Runx1+/+ (blue) and Runx1KTAMK/KTAMK (red) cells are shown in the right graph (n = 3 mice; 9-14 weeks old, from 3 independent experiments). (F) Flow cytometry analysis of Runx1+/+, Runx1+/KTAMK, and Runx1KTAMK/KTAMK Flt3– LSK cells for γH2AX staining. Mice were irradiated (3 Gy) and Flt3– LSK cells were harvested 18 hours later. The left panel shows a representative flow cytometry plot of Runx1+/+ (blue) and Runx1KTAMK/KTAMK (red) Flt3– LSK cells with (solid lines) or without (dashed lines) radiation. The fluorescence minus one (FMO) control is shown in orange. The percentages of γH2AX+ cells in Runx1+/+ (blue), Runx1+/KTAMK (light green), and Runx1KTAMK/KTAMK (red) cells are shown in the right graph (n = 3 mice; 7-10 weeks old, from 3 independent experiments). FDR, false discovery rate; NES, normalized enrichment score; NS, not significant.
Defects in RUNX1 methylation confer resistance to apoptosis induced by endogenous and genotoxic stress. (A) GSEA plots comparing Runx1+/+ and Runx1KTAMK/KTAMK LT-HSCs using the Gene Ontology biological process database. The top 3 gene sets enriched in control Runx1+/+ LT-HSCs are shown. Each solid bar represents one gene within the gene set. (B) Induction of ER stress–related genes by UPR in Runx1+/+ and Runx1KTAMK/KTAMK LT-HSCs as shown by quantitative polymerase chain reaction. Runx1+/+ (blue) and Runx1KTAMK/KTAMK (red) LT-HSCs were sorted and cultured with or without tunicamycin (0.6 μg/mL) for 10 hours (n = 7 from 4 mice per genotype; 6-8 weeks old, from 4 independent experiments). (C) Apoptosis by ER stress in Runx1+/+ and Runx1KTAMK/KTAMK LT-HSCs as detected by flow cytometry. Cells were treated with tunicamycin (0.6 μg/mL) for 20 hours. The percentages of Annexin V+ cells in Runx1+/+ (blue) and Runx1KTAMK/KTAMK (red) LT-HSCs are shown (n = 3 from 2 mice per genotype; 6 to 8 weeks old, from 2 independent experiments). (D) Induction of p53 downstream genes by radiation in Runx1+/+ and Runx1KTAMK/KTAMK Flt3– LSK cells as shown by quantitative polymerase chain reaction. Runx1+/+ (blue) and Runx1KTAMK/KTAMK (red) mice were irradiated (3 Gy), and Flt3– LSK cells were harvested 3 hours later (n = 4 to 5 mice; 8-15 weeks old, from 5 independent experiments). (E) Apoptosis by radiation in Runx1+/+ and Runx1KTAMK/KTAMK Flt3– LSK cells as detected by flow cytometry. Mice were irradiated (3 Gy), and Flt3– LSK cells were harvested 18 hours later. The left panel shows a representative flow cytometry plot of Runx1+/+ (blue) and Runx1KTAMK/KTAMK (red) Flt3– LSK cells with (solid lines) or without (dashed lines) radiation. The percentages of Annexin V+ cells in Runx1+/+ (blue) and Runx1KTAMK/KTAMK (red) cells are shown in the right graph (n = 3 mice; 9-14 weeks old, from 3 independent experiments). (F) Flow cytometry analysis of Runx1+/+, Runx1+/KTAMK, and Runx1KTAMK/KTAMK Flt3– LSK cells for γH2AX staining. Mice were irradiated (3 Gy) and Flt3– LSK cells were harvested 18 hours later. The left panel shows a representative flow cytometry plot of Runx1+/+ (blue) and Runx1KTAMK/KTAMK (red) Flt3– LSK cells with (solid lines) or without (dashed lines) radiation. The fluorescence minus one (FMO) control is shown in orange. The percentages of γH2AX+ cells in Runx1+/+ (blue), Runx1+/KTAMK (light green), and Runx1KTAMK/KTAMK (red) cells are shown in the right graph (n = 3 mice; 7-10 weeks old, from 3 independent experiments). FDR, false discovery rate; NES, normalized enrichment score; NS, not significant.
Because Runx1KTAMK/KTAMK LT-HSCs lose quiescence (Figure 2D) and p53 is critical for HSC quiescence,23 we examined whether p53 pathways were impaired by defective RUNX1 methylation. Runx1+/+ and Runx1KTAMK/KTAMK mice were irradiated and Flt3– LSK HSCs were analyzed. Although radiation resulted in a prominent increase of the p53 target genes Bbc3, Pmaip1, and Cdkn1a, the induction was partially suppressed in Runx1KTAMK/KTAMK mice (Figure 5D), and apoptosis was also attenuated in Runx1KTAMK/KTAMK mice (Figure 5E). Apoptosis after DNA damage is one of the critical mechanisms to prevent proliferation of damaged cells and to maintain genome integrity of HSCs. Hence, we evaluated DNA damage accumulation in Runx1KTAMK/KTAMK Flt3– LSK HSCs subjected to in vivo radiation. As shown in Figure 5F, γH2AX staining indicative of DNA double-strand breaks was increased in Runx1KTAMK/KTAMK cells.
These results show that defects in RUNX1 methylation confer resistance to apoptosis induced by endogenous and genotoxic stress despite the presence of DNA damage accumulation, which is a hallmark of a preleukemic clone.17,24-28
Competitive BMT assays under stress conditions show survival advantage of Runx1KTAMK/KTAMK cells in vivo
We next performed competitive BMT experiments to address whether Runx1KTAMK/KTAMK HSPCs exhibited a survival advantage due to resistance to apoptosis in vivo. Lethally irradiated Ly5.1 recipient mice were coinjected with a mixture of either Runx1+/+ or Runx1KTAMK/KTAMK (Ly5.2) LSK cells and Ly5.1 competitor cells. After BMT, recipient mice were treated with pIpC twice a week to induce sustained inflammation by a type I interferon response (Figure 6A). Although the repopulating activity of control Runx1+/+ HSPCs was impaired by serial pIpC treatment, Runx1KTAMK/KTAMK HSPCs showed relative resistance to pIpC treatment and higher reconstitution after 4 weeks. We next evaluated the effects of nonlethal repetitive irradiation on Runx1+/+ and Runx1KTAMK/KTAMK HSPCs (Figure 6B). Repeated irradiation (2 Gy) once a week after BMT also augmented the repopulation activity of Runx1KTAMK/KTAMK HSPCs but not Runx1+/+ HSPCs. These assays have consistently revealed the survival advantage of Runx1KTAMK/KTAMK HSPCs under stress conditions.
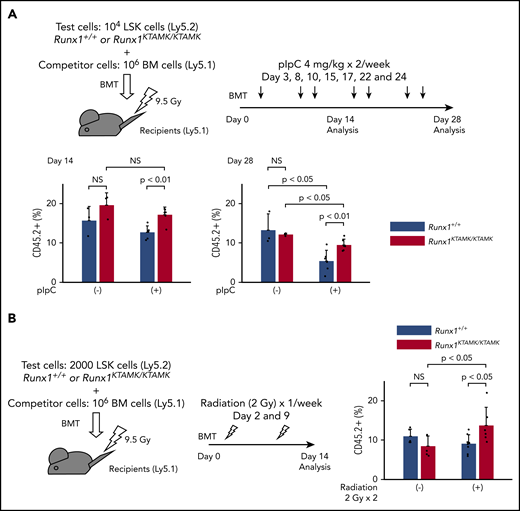
Competitive BMT assays show survival advantage of Runx1KTAMK/KTAMKcells in vivo. (A) Lethally irradiated (9.5 Gy) Ly5.1 recipient mice were coinjected with a mixture of either 104Runx1+/+ or Runx1KTAMK/KTAMK LSK cells (Ly5.2) and 106 competitor whole bone marrow (BM) cells (Ly5.1). After BMT, mice were treated with 4 mg/kg of pIpC intraperitoneally twice a week, and peripheral blood donor chimerism was analyzed 2 and 4 weeks later. The lower graphs show the frequency of donor-derived Runx1+/+ (blue) or Runx1KTAMK/KTAMK (red) cells in peripheral blood (n = 3 to 6 mice from 2 independent experiments). Donor cells were from mice 7 to 9 weeks old. (B) Lethally irradiated (9.5 Gy) Ly5.1 recipient mice were coinjected with a mixture of either 2000 Runx1+/+ or Runx1KTAMK/KTAMK LSK cells (Ly5.2) and 106 competitor whole BM cells (Ly5.1). After BMT, mice were irradiated (2 Gy) once a week, and peripheral blood donor chimerism was analyzed 2 weeks later. The right graph shows the frequency of donor-derived Runx1+/+ (blue) or Runx1KTAMK/KTAMK (red) cells in peripheral blood (n = 5 to 8 mice from 2 independent experiments). Donor cells were from mice 7 to 8 weeks old. NS, not significant.
Competitive BMT assays show survival advantage of Runx1KTAMK/KTAMKcells in vivo. (A) Lethally irradiated (9.5 Gy) Ly5.1 recipient mice were coinjected with a mixture of either 104Runx1+/+ or Runx1KTAMK/KTAMK LSK cells (Ly5.2) and 106 competitor whole bone marrow (BM) cells (Ly5.1). After BMT, mice were treated with 4 mg/kg of pIpC intraperitoneally twice a week, and peripheral blood donor chimerism was analyzed 2 and 4 weeks later. The lower graphs show the frequency of donor-derived Runx1+/+ (blue) or Runx1KTAMK/KTAMK (red) cells in peripheral blood (n = 3 to 6 mice from 2 independent experiments). Donor cells were from mice 7 to 9 weeks old. (B) Lethally irradiated (9.5 Gy) Ly5.1 recipient mice were coinjected with a mixture of either 2000 Runx1+/+ or Runx1KTAMK/KTAMK LSK cells (Ly5.2) and 106 competitor whole BM cells (Ly5.1). After BMT, mice were irradiated (2 Gy) once a week, and peripheral blood donor chimerism was analyzed 2 weeks later. The right graph shows the frequency of donor-derived Runx1+/+ (blue) or Runx1KTAMK/KTAMK (red) cells in peripheral blood (n = 5 to 8 mice from 2 independent experiments). Donor cells were from mice 7 to 8 weeks old. NS, not significant.
Activating transcription factor 4 is a direct transcriptional target of RUNX1
Activating transcription factor 4 (ATF4) protein expression is well known to be regulated translationally by eukaryotic translation initiator factor-2 (eIF2α) phosphorylation through the protein kinase RNA–like ER kinase (PERK) pathway.29 Conversely, transcriptional regulation of Atf4 mRNA is poorly understood. Our finding that the induction of Atf4 mRNA was diminished in Runx1KTAMK/KTAMK cells (Figure 5B) prompted us to hypothesize that Atf4 might be a direct downstream target of RUNX1. To search for this possibility, publicly available RUNX1 ChIP-sequencing data were analyzed. We found that RUNX1 bound to the promoter region of ATF4 both in human CD34+ HSPCs and mouse EML hematopoietic precursor cells (Figure 7A).30,31 The promoter activity of Atf4 as marked by H3K27Ac in Runx1KTAMK/KTAMK LSK HSPCs was reduced compared with control Runx1+/+ cells (Figure 7B). Reporter assays showed that the human ATF4 promoter was transactivated by wild-type RUNX1 and mutant RUNX1 R233K, and as expected, the activation was diminished by the R237K mutation (Figure 7C). Furthermore, reporter assays using a series of deletion/mutant constructs revealed that the transactivation effects were mediated mainly by the RUNX1 binding site between −61 bp and −55 bp of the transcription initiation site both in hematopoietic and non-hematopoietic cells (Figure 7D; supplemental Figure 4A). These data show that RUNX1 transcriptionally regulates ATF4.
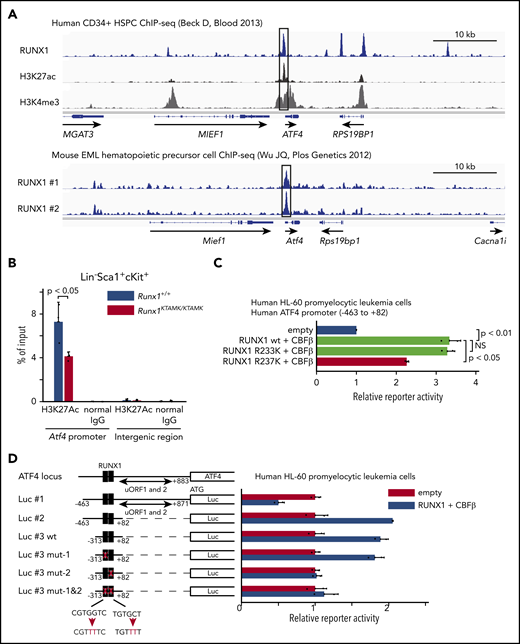
ATF4 is a direct target of RUNX1 in hematopoietic cells. (A) Analysis of publicly available RUNX1 ChIP-sequencing data shows that RUNX1 binds to the promoter region of ATF4 (black box) in human and mouse hematopoietic cells. The top panel shows ChIP-sequencing tracks for RUNX1 (blue), H3K27ac (black), and H3K4me3 (gray) around the ATF4 locus in human CD34+ HSPCs. The lower panel shows ChIP-sequencing tracks for RUNX1 (blue) in duplicate around the Atf4 locus in mouse EML hematopoietic precursor cells. (B) Control Runx1+/+ (blue) and Runx1KTAMK/KTAMK (red) LSK stem/progenitor cells were harvested, and ChIP analysis was performed by using a specific antibody against H3K27Ac or control immunoglobulin G (IgG). The amount of genomic DNA in the ChIP and input samples was measured by quantitative polymerase chain reaction using specific primers targeting the mouse Atf4 promoter or an intergenic region (n = 3 mice; 11-16 weeks old, from 3 independent experiments). (C) Luciferase (Luc) activity analysis showing the activation of the human ATF4 promoter (–463 bp to 82 bp of the transcription initiation site) by RUNX1 in human HL-60 promyelocytic leukemia cells. The Luc activities by wild-type (wt) RUNX1 and its binding partner CBFβ (light green), mutant (mut) RUNX1 R233K and CBFβ (light green), and mut RUNX1 R237K and CBFβ (red) were normalized to the activity by an empty vector (blue) (n = 2 independent experiments). (D) Luc activity analysis using a series of deletion/mut constructs in human HL-60 promyelocytic leukemia cells. The Luc activity by RUNX1 and CBFβ (blue) was normalized to the activity by an empty vector (red). Representative data from 1 of 2 independent experiments are shown. Note that 2 upstream open reading frames (uORFs) of ATF4 are known to negatively regulate mRNA translation. The region between −313 bp and 82 bp (Luc #3 wt) is sufficient for the full activation of the human ATF4 promoter, and mutagenesis in the second putative RUNX1 binding site (Luc #3 mut-2) impairs the reporter activity. The schematic representation of reporter plasmids is shown in the left. Two putative RUNX1 binding sites are depicted as black boxes, and the mutated binding sites are shown as white boxes. NS, not significant.
ATF4 is a direct target of RUNX1 in hematopoietic cells. (A) Analysis of publicly available RUNX1 ChIP-sequencing data shows that RUNX1 binds to the promoter region of ATF4 (black box) in human and mouse hematopoietic cells. The top panel shows ChIP-sequencing tracks for RUNX1 (blue), H3K27ac (black), and H3K4me3 (gray) around the ATF4 locus in human CD34+ HSPCs. The lower panel shows ChIP-sequencing tracks for RUNX1 (blue) in duplicate around the Atf4 locus in mouse EML hematopoietic precursor cells. (B) Control Runx1+/+ (blue) and Runx1KTAMK/KTAMK (red) LSK stem/progenitor cells were harvested, and ChIP analysis was performed by using a specific antibody against H3K27Ac or control immunoglobulin G (IgG). The amount of genomic DNA in the ChIP and input samples was measured by quantitative polymerase chain reaction using specific primers targeting the mouse Atf4 promoter or an intergenic region (n = 3 mice; 11-16 weeks old, from 3 independent experiments). (C) Luciferase (Luc) activity analysis showing the activation of the human ATF4 promoter (–463 bp to 82 bp of the transcription initiation site) by RUNX1 in human HL-60 promyelocytic leukemia cells. The Luc activities by wild-type (wt) RUNX1 and its binding partner CBFβ (light green), mutant (mut) RUNX1 R233K and CBFβ (light green), and mut RUNX1 R237K and CBFβ (red) were normalized to the activity by an empty vector (blue) (n = 2 independent experiments). (D) Luc activity analysis using a series of deletion/mut constructs in human HL-60 promyelocytic leukemia cells. The Luc activity by RUNX1 and CBFβ (blue) was normalized to the activity by an empty vector (red). Representative data from 1 of 2 independent experiments are shown. Note that 2 upstream open reading frames (uORFs) of ATF4 are known to negatively regulate mRNA translation. The region between −313 bp and 82 bp (Luc #3 wt) is sufficient for the full activation of the human ATF4 promoter, and mutagenesis in the second putative RUNX1 binding site (Luc #3 mut-2) impairs the reporter activity. The schematic representation of reporter plasmids is shown in the left. Two putative RUNX1 binding sites are depicted as black boxes, and the mutated binding sites are shown as white boxes. NS, not significant.
Discussion
Deep targeted sequencing of >500 candidate genes identified a novel germline mutation of RUNX1 in a pedigree of familial AML. This mutated residue is a methylation site by PRMT1, and previous studies confirmed that loss of methylation resulted in impaired transcriptional activity of RUNX1.11,13 To study the biologic significance of RUNX1 methylation in vivo, we analyzed corresponding knock-in mice as a disease model and found that defective RUNX1 methylation induced HSC expansion, loss of quiescence, and an impaired genomic and epigenomic HSC signature in phenotypic LT-HSCs. HSCs with defects in RUNX1 methylation acquired a survival advantage by resistance to apoptosis, which explained predisposition to malignancy in this pedigree. We also identified ATF4 as a direct transcriptional target of RUNX1.
Here we reported a novel case of the familial germline RUNX1 R237K mutation (Figure 1). RUNX1 R237K mutations have been reported twice as somatic and sporadic mutations (COSM87292) in the Catalogue Of Somatic Mutations In Cancer database5 : one among chronic myelomonocytic leukemia32 and the other among −7/del(7q) AML.33 These 2 sporadic cases further corroborate the causal relationship of loss of RUNX1 R237 methylation and AML. However, the germline variation of the other methylation site, R233H, is found in general population databases, and recently ClinGen expert panels have classified R233H as likely benign because its allele frequency is greater than expected for disorder.34 This suggests that R233 methylation is not biologically important for the activity of RUNX1, and it is unlikely that loss of R233 methylation causes leukemia. Although our experiments to study the effects of RUNX1 methylation were conducted by using R233K/R237K double-mutant mice, we speculate that the single R237K mutation is sufficient to cause familial AML in human.
Previous in vitro studies have revealed that RUNX1 is regulated by PTMs, including phosphorylation, acetylation, methylation, and ubiquitination.9-11 However, RUNX1 mutations at the PTM sites are extremely rare even in sporadic cases; the exception is K83, a putative ubiquitination acceptor site, whose mutation is likely to contribute to leukemogenesis not through loss of ubiquitination but by disrupted DNA binding of RUNX1.9 Moreover, mice with RUNX1 mutations that prevented phosphorylation at either S249/S266 or S249/S276 were phenotypically normal.12 Only in vitro data have confirmed that RUNX1 with 4 phosphorylation-deficient mutations impairs T-cell differentiation activity, and RUNX1 with 5 phosphorylation-deficient mutations completely loses its hematopoietic activity.10 Acetylation and ubiquitination at K24/K43 also appear to be dispensable for RUNX1 function.35 These observations have thus challenged the predicted biologic importance of RUNX1 PTMs in vivo. RUNX1 and SIN3A bind via the SIN3A interaction domain (172-237 for RUNX1b and 199-264 for RUNX1c).36 Previous in vitro studies have shown that PRMT1 methylates R233 and R237 inside the SIN3A interaction domain and that PRMT1 abrogates the binding of SIN3A to RUNX1 wild type, but not to RUNX1 R233K/R237K, and potentiates its transcriptional activity.11 However, the in vivo consequence of RUNX1 methylation was largely unknown. Our results obtained from human and mice data have unequivocally confirmed the physiologic relevance of RUNX1 PTMs in vivo.
Hematopoietic phenotypes observed in Runx1flox/flox; Mx1-Cre mice37-40 or Runx1flox/flox; Vav1-Cre mice17,38,41 were partially recapitulated in Runx1KTAMK/KTAMK mice, including phenotypic HSC expansion with loss of quiescence and antiapoptotic properties. These findings suggest that loss of RUNX1 R233/R237 methylation diminishes its transcriptional activity in vivo (Figure 2). We showed that phenotypic LT-HSCs increased in Runx1KTAMK/KTAMK mice and that Runx1KTAMK/KTAMK bone marrow cells exhibited increased short-term in vitro colony-forming activity and short-term myeloid lineage reconstitution in vivo. These findings are in line with previous reports in which RUNX1 deficiency expanded HSPCs, especially myeloid progenitors.38,41 However, we detected no improved long-term reconstitution activities of Runx1KTAMK/KTAMK cells. Premature initiation of the progenitor gene expression program in LT-HSCs may impair HSC properties in Runx1KTAMK/KTAMK HSCs and lead to HSC exhaustion, which is shown in Runx1flox/flox; Mx1-Cre mice39,40 (Figures 3 and 4).
UPR is a network of interconnected signaling pathways to restore ER homeostasis initiated by 3 signal transducers: inositol-requiring protein 1 (IRE1), activating transcription factor 6 (ATF6), and PERK.29 Under ER stress conditions, PERK inhibits general protein translation through the phosphorylation of eIF2α to decrease protein overload and also leads to the selective translation of ATF4 mRNA. Upregulation of ATF4 promotes an antioxidant response, the folding capacity of the ER, and macroautophagy. However, if homeostasis cannot be restored, sustained ATF4 expression initiates apoptosis. HSCs have higher basal PERK–eIF2α activation and preferentially activate the pro-apoptotic PERK–eIF2α–ATF4 branch of UPR, sensitizing them to ER stress–induced apoptosis to maintain HSC integrity.42 We have shown that ATF4 is a direct transcriptional target of RUNX1, a previously unrecognized direct link between RUNX1 and UPR genes (Figure 7). Recent studies have reported that 3 branches of UPR cross-react, and the PERK–eIF2α–ATF4 pathway can activate both the IRE143 and the ATF644,45 pathways. Thus, RUNX1 may activates all 3 branches of UPR via ATF4. However, the interrelationship among the 3 UPR branches has only been studied in specific cell types and may not apply ubiquitously to HSCs. It is possible, therefore, that RUNX1 directly activates UPR genes other than Atf4.
We have clarified that defects in RUNX1 methylation provide HSCs with a growth advantage to overcome endogenous and genotoxic stress (Figures 5 and 6). Impaired UPR and p53 pathways and resistance to stress were also reported in Runx1flox/flox; Vav1-Cre HSCs.17 Although the similarity between Runx1KTAMK/KTAMK mice and Runx1flox/flox; Vav1-Cre mice further fortifies the notion that loss of RUNX1 methylation suppresses its transcriptional activity in vivo, it is somewhat surprising in light of its modest effects in vitro and relatively weak phenotypes of Runx1KTAMK/KTAMK mice. These findings might suggest that a substantial proportion of RUNX1 activities in HSCs are regulated by RUNX1 methylation in vivo, or that RUNX1 methylation has a specific role in these pathways. Resistance to apoptosis is considered a hallmark of a preleukemic clone as programmed cell death by apoptosis serves as a natural barrier to cancer development.17,24-27 We speculate that defective RUNX1 methylation can confer resistance to apoptosis even in DNA damage–accumulated HSCs. Attenuated p53 pathways by loss of RUNX1 methylation may explain a complex karyotype in this pedigree, which is a typical feature of TP53 mutated leukemia.46
Runx1 deletion per se is not sufficient for leukemogenesis in mouse models,37-39 indicating that cooperating “second-hit” mutations are required. Of note, as mentioned earlier, the identical RUNX1 R237K mutation was reported as a somatic and sporadic mutation in −7/del(7q) AML, and one of our patients (II-1) also had a −7 karyotype (Table 1). Concomitant functional loss of RUNX1 and EZH2, one of the genes responsible for −7/del(7q) MDS/AML, results in a highly penetrant and fatal MDS phenotype,47 and an additional activating Flt3 mutation leads to aggressive acute leukemia.48 Although Runx1KTAMK/KTAMK mice do not exhibit any hematologic malignancies, additional loss of genes on chromosome 7q, including Ezh2 and Cux1,49 may cause leukemia. Further studies are required to clarify whether and how loss of RUNX1 methylation and additional mutations collaborate to initiate leukemia.
In conclusion, we present a new germline mutation of RUNX1 at the PTM site in a family with 3 occurrences of myeloid malignancy. By combining human and murine data, we have clearly shown that PTM of RUNX1 is associated with leukemogenesis. Our studies will lead to a better understanding of how PTM dysregulation and subsequent dysfunction of a transcription factor can contribute to human disease.
The RNA-sequencing and ATAC-sequencing data reported in this article have been deposited in the Gene Expression Omnibus database (accession numbers GSE148051 and GSE148201).
The online version of this article contains a data supplement.
The publication costs of this article were defrayed in part by page charge payment. Therefore, and solely to indicate this fact, this article is hereby marked “advertisement” in accordance with 18 USC section 1734.
Acknowledgments
The authors thank all patients and their families for participation in this research study. They also thank Hibiki Mochida, Deng Jianwen, and Chua Lee Hui for technical assistance.
This research was supported by the National Research Foundation Singapore and the Singapore Ministry of Education under its Research Centres of Excellence initiative (NMRC/STaR/MOH-000149, T.S.; NMRC/CNIG/1155/2016, T.M.), and JSPS Grant-in-Aid for Scientific Research (S) (18H05284, T.S.).
Authorship
Contribution: T.M. and T.S. conceived and designed the experiments; T.M., A.N.-I., S.S.N.A.M., D.Q.T., and C.Q.W. performed the experiments; T.M., K.T., N.A., and M.O. identified study subjects, performed clinical phenotyping, and contributed biologic samples; T.M., R.T.-M., S.S., and T.B. analyzed bioinformatics data; T.O. generated the mice model; T.M. and T.S. wrote the manuscript; and T.B., T.O., N.A., M.M., M.O., and T.S. jointly supervised the research.
Conflict-of-interest disclosure: The authors declare no competing financial interests.
Correspondence: Takayoshi Matsumura, Cancer Science Institute of Singapore, National University of Singapore, 14 Medical Dr, Singapore 117599; e-mail: csitkm@nus.edu.sg or Toshio Suda, Cancer Science Institute of Singapore, National University of Singapore, 14 Medical Dr, Singapore 117599; e-mail: csits@nus.edu.sg.

This feature is available to Subscribers Only
Sign In or Create an Account Close Modal