

Key Points
The primary CCND1 rearrangement is mediated by the same mechanisms in cMCL and nnMCL, but they differ in the (epi)genetic and driver makeup.
Genomic complexity and DNA methylation changes related to proliferative cell history stratify patients with distinct clinical outcomes.

Abstract
Mantle cell lymphoma (MCL) is a mature B-cell neoplasm initially driven by CCND1 rearrangement with 2 molecular subtypes, conventional MCL (cMCL) and leukemic non-nodal MCL (nnMCL), that differ in their clinicobiological behavior. To identify the genetic and epigenetic alterations determining this diversity, we used whole-genome (n = 61) and exome (n = 21) sequencing (74% cMCL, 26% nnMCL) combined with transcriptome and DNA methylation profiles in the context of 5 MCL reference epigenomes. We identified that open and active chromatin at the major translocation cluster locus might facilitate the t(11;14)(q13;32), which modifies the 3-dimensional structure of the involved regions. This translocation is mainly acquired in precursor B cells mediated by recombination-activating genes in both MCL subtypes, whereas in 8% of cases the translocation occurs in mature B cells mediated by activation-induced cytidine deaminase. We identified novel recurrent MCL drivers, including CDKN1B, SAMHD1, BCOR, SYNE1, HNRNPH1, SMARCB1, and DAZAP1. Complex structural alterations emerge as a relevant early oncogenic mechanism in MCL, targeting key driver genes. Breakage-fusion-bridge cycles and translocations activated oncogenes (BMI1, MIR17HG, TERT, MYC, and MYCN), generating gene amplifications and remodeling regulatory regions. cMCL carried significant higher numbers of structural variants, copy number alterations, and driver changes than nnMCL, with exclusive alterations of ATM in cMCL, whereas TP53 and TERT alterations were slightly enriched in nnMCL. Several drivers had prognostic impact, but only TP53 and MYC aberrations added value independently of genomic complexity. An increasing genomic complexity, together with the presence of breakage-fusion-bridge cycles and high DNA methylation changes related to the proliferative cell history, defines patients with different clinical evolution.
Medscape Continuing Medical Education online
In support of improving patient care, this activity has been planned and implemented by Medscape, LLC and the American Society of Hematology. Medscape, LLC is jointly accredited by the Accreditation Council for Continuing Medical Education (ACCME), the Accreditation Council for Pharmacy Education (ACPE), and the American Nurses Credentialing Center (ANCC), to provide continuing education for the healthcare team.
Medscape, LLC designates this Journal-based CME activity for a maximum of 1.00 AMA PRA Category 1 Credit(s)™. Physicians should claim only the credit commensurate with the extent of their participation in the activity.
Successful completion of this CME activity, which includes participation in the evaluation component, enables the participant to earn up to 1.0 MOC points in the American Board of Internal Medicine's (ABIM) Maintenance of Certification (MOC) program. Participants will earn MOC points equivalent to the amount of CME credits claimed for the activity. It is the CME activity provider's responsibility to submit participant completion information to ACCME for the purpose of granting ABIM MOC credit.
All other clinicians completing this activity will be issued a certificate of participation. To participate in this journal CME activity: (1) review the learning objectives and author disclosures; (2) study the education content; (3) take the post-test with a 75% minimum passing score and complete the evaluation at http://www.medscape.org/journal/blood; and (4) view/print certificate. For CME questions, see page 1469.
Disclosures
Author Xose S. Puente has ownership interest in DREAMgenics. Author Elias Campo is named inventor on 2 patents filed by the National Institutes of Health, National Cancer Institute: “Methods for selecting and treating lymphoma types,” licensed to NanoString Technologies, and “Evaluation of mantle cell lymphoma and methods related thereof.” Editor Michael Hallek, CME questions author Laurie Barclay, freelance writer and reviewer, Medscape, LLC, and the remaining authors declare no competing financial interests.
Learning objectives
Upon completion of this activity, participants will be able to:
Describe genomic and epigenomic characterization of mantle cell lymphoma (MCL) with CCND1 rearrangement, according to a genetic and epigenetic study
Compare structural alterations in conventional and leukemic nonnodal subtypes of MCL, according to a genetic and epigenetic study
Identify clinical implications of genetic and epigenetic changes in conventional and leukemic nonnodal subtypes of MCL, according to a genetic and epigenetic study
Release date: September 17, 2020; Expiration date: September 17, 2021
Introduction
Mantle cell lymphoma (MCL) is a mature B-cell neoplasm with very heterogeneous behavior genetically characterized by the translocation t(11;14)(q13;q32), leading to CCND1 overexpression.1-4 The World Health Organization recognizes 2 molecular subtypes that differ in their clinical and biological features.5-9 The most common conventional MCL (cMCL) derives from naive-like mature B cells, expresses the oncogenic transcription factor SOX11 and accumulates high numbers of genomic alterations. Patients usually have generalized lymphadenopathy and an adverse outcome. In contrast, leukemic non-nodal MCL (nnMCL) originates from memory-like B cells, is negative for SOX11, and is genetically stable. The disease usually involves peripheral blood and spleen but not lymph nodes in early stages, and follows an indolent behavior.10 Both MCL subtypes carry the t(11;14) translocation, but the mechanisms leading to this rearrangement in both subtypes and the subsequent molecular alterations that drive their different evolution are not well defined.
The mutational profile of MCL has been previously studied in a small series of cases using whole-exome, transcriptome, or targeted sequencing, revealing a heterogeneous set of mutated genes, most of them at low frequencies.11-15 However, these strategies did not explore the genome-wide mutational and structural alterations of the tumors, and have not properly addressed the differences between the 2 molecular subtypes of MCL. Furthermore, although the whole DNA methylome of MCL has been recently described, its relationship with genome-wide genetic events remains poorly characterized.16
To determine the influence of genome-wide (epi)genetic alterations in the heterogeneous behavior of MCL, we performed a combined analysis of whole-genome sequencing (WGS), transcriptome, and DNA methylome of a large cohort of MCL in the context of the reference epigenome of 5 representative cases from both MCL subtypes.
Methods
Patients and genomic studies
We performed WGS of paired tumor/normal samples from 61 MCL patients (44 cMCL, 17 nnMCL) (Table 1). We expanded the analysis with the whole-exome sequencing (WES) of 21 nonoverlapping cases previously reported (supplemental Table 1, available on the Blood Web site).11 Cases were classified as cMCL or nnMCL on the basis of gene expression signatures detected by expression arrays, NanoString platform or reverse transcription quantitative polymerase chain reaction (PCR), and/or SOX11 immunohistochemistry, depending on the available material, as previously described (supplemental Methods).6,17,18 Clinical status, morphological status, immunoglobulin heavy chain gene (IGHV) mutational status, genetic alterations, or epigenetic data were not used for the classification. WGS was performed using the TruSeq DNA PCR-free protocol and sequenced in a HiSeq X Ten (2 × 150 bp; Illumina) (supplemental Table 2). Raw reads were mapped to the human reference genome (GRCh37) using the BWA-mem algorithm,19 and somatic single-nucleotide variants were called using Sidrón,20 short insertions/deletions combining Sidrón and Pindel, and germline variants using HaplotypeCaller.21 Copy number alterations (CNA) were extracted using Battenberg22 and from Affymetrix Genome-wide Human SNP Array 6.0/Cytoscan using Nexus Biodiscovery.20 Structural variants (SV) were analyzed using SMuFin and LUMPY.23,24 Sanger sequencing, conventional cytogenetics, and fluorescence in situ hybridization (FISH) were used to verify selected mutations and rearrangements (supplemental Tables 3-6). Telomere length was determined using qMotif. Analysis of mutational signatures was performed as previously described.25-27 Driver genes were identified as previously described,20 whereas GISTIC was used to select driver CNA.28 SV were integrated in driver discovery analyses. Timing of driver alterations was inferred from the clonality of each alteration as described elsewhere.29
Clinicopathological features of the 61 MCL patients with WGS analysis
| Variable | Total (n) | cMCL (n = 44) | nnMCL (n = 17) | P |
|---|---|---|---|---|
| Clinical data (at diagnosis) | ||||
| Age, median (range), y | 64 (38-85) | 64 (38-85) | 64 (51-80) | .477 |
| Male/female, no. | 43/18 | 33/11 | 10/7 | .229 |
| Nodal presentation, % | 22/55 (40) | 22/40 (55) | 0/15 (0) | <.001 |
| Splenomegaly, % | 26/55 (47) | 24/40 (60) | 2/15 (13) | .002 |
| LDH (>ULN), % | 16/53 (30) | 16/39 (41) | 0/14 (0) | .005 |
| MIPI high risk, % | 42/46 (91) | 32/36 (89) | 10/10 (100) | .562 |
| ECOG (≥2), % | 8/48 (17) | 8/37 (22) | 0/11 (0) | .170 |
| Pathological and molecular data | ||||
| Cyclin D1 positive, % | 60/61 (98) | 43*/44 (98) | 17/17 (100) | 1 |
| Mutated IGHV genes | ||||
| Identity <98%, % | 24/61 (39) | 8/44 (18) | 16/17 (94) | <.001 |
| Identity, median (range) | 99 (91-100) | 99 (93-100) | 95 (91-99) | <.001 |
| Nanostring L-MCL16 assay, %† | <.001 | |||
| cMCL | 15/29 (52) | 15/16 (94) | 0/13 (0) | |
| nnMCL | 11/29 (38) | 0/16 (0) | 11/13 (85) | |
| Undetermined | 3/29 (10) | 1/16 (6) | 2/13 (15) | |
| Epigenetic COO, %‡ | <.001 | |||
| C1 (GC inexperienced) | 35/54 (65) | 34/37 (92) | 1/17 (6) | |
| C2 (GC experienced) | 17/54 (31) | 2/37 (5) | 15/17 (88) | |
| Undetermined | 2/54 (4) | 1/37 (3) | 1/17 (6) | |
| Complex karyotype, % | 17/37 (46) | 12/21 (57) | 5/16 (31) | .185 |
| Morphology, % | <.001 | |||
| Small cell | 15/57 (26) | 5/41 (12) | 10/16 (62) | |
| Classic | 30/57 (53) | 24/41 (59) | 6/16 (38) | |
| Blastoid | 12/57 (21) | 12/41 (29) | 0/16 (0) | |
| Light chain restriction, % | .259 | |||
| κ | 35/61 (57) | 23/44 (52) | 12/17 (71) | |
| λ | 26/61 (43) | 21/44 (48) | 5/17 (29) | |
| Sequenced sample, % | .023 | |||
| Lymph node | 12/61 (20) | 12/44 (27) | 0/17 (0) | |
| Other tissue§ | 2/61 (3) | 2/44 (5) | 0/17 (0) | |
| Peripheral blood | 46/61 (75) | 29/44 (66) | 17/17 (100) | |
| Bone marrow | 1/61 (2) | 1/44 (2) | 0/17 (0) | |
| Pretreatment sample, % | 56/60 (93) | 40/43 (93) | 16/17 (94) | 1 |
| Time from diagnosis to pretreatment sample, median (range), mo | 0.9 (0-101.6) | 0.4 (0-14) | 9.5 (0-101.6) | <.001 |
| Treatment at diagnosis, %║ | <.001 | |||
| High-dose therapy | 17/58 (29) | 17/41 (41) | 0/17 (0) | |
| Immunochemotherapy | 12/58 (21) | 12/41 (29) | 0/17 (0) | |
| Low-dose chemotherapy | 6/58 (10) | 6/41 (15) | 0/17 (0) | |
| Observation | 23/58 (40) | 6/41 (15) | 17/17 (100) | |
| Follow-up data | ||||
| Treated at 2 y, % (95% CI) | 67 (52-78) | 91 (76-97) | 7 (0-18) | <.001 |
| n treated, n censored, n missing | 38, 3, 4 | 37, 2, 3 | 1, 1, 1 | |
| 2-y OS, % (95% CI) | 81 (72-92) | 73 (61-88) | 100 (100-100) | .006 |
| n dead, n censored, n missing | 11, 4, 1 | 11, 4, 1 | 0, 0, 0 |
CI, confidence interval; ECOG, Eastern Cooperative Oncology Group; LDH, lactate dehydrogenase; MIPI, MCL International Prognostic Index; ULN, upper level of normal.
One case was negative for cyclin D1 expression and CCND1 rearrangement but had MCL morphologic and phenotypic criteria (including SOX11 positivity) according to the WHO classification.30
Clot et al.17
Queirós et al.16
Corresponding to 1 skin and 1 tonsil.
The treatment information in 3 patients could not be obtained. High-dose therapy includes Cytarabine-based immunochemotherapy and/or autologous stem-cell transplantation; Immunochemotherapy includes R-CHOP-like regimens; and Low-dose therapy includes alkylating agents alone or in combination.
Immunoglobulin gene rearrangements
Immunoglobulin gene rearrangements and identity were analyzed from WGS data using IgCaller31 (supplemental Table 7). The primary IG/CCND1 translocation was characterized from WGS data using a bespoke algorithm that mapped the breakpoints at base pair resolution and searched for evidences of aberrant V(D)J recombination (ie, recombination-activating gene [RAG] activity), class switch recombination (CSR), and somatic hypermutation (SHM) (supplemental Table 8).
Epigenetic and gene expression analyses
Infinium Methylation EPIC BeadChip was used to generate DNA methylation profiles (n = 70). The reference epigenome including the analysis of 6 histone marks (H3K4me3, H3K4me1, H3K27ac, H3K36me3, H3K9me3, and H3K27me3), chromatin accessibility (ATAC-seq), and RNA-seq of 15 normal B cells and 5 MCL (2 cMCL, 3 nnMCL) were generated within the Blueprint Consortium.32 In situ Hi-C data for the 5 MCL as well as naïve and memory B cell subpopulations were obtained from our recent study.33 Gene expression profiling was performed using Affymetrix U219 microarrays (n = 44). cMCL and nnMCL gene expression signatures were studied by the L-MCL16 assay (NanoString Technologies).17
Statistical analyses
The log-rank test (categorical) and Cox regression (continuous) were used to measure the association of the overall survival (OS) with clinicobiological variables. P values were adjusted using the Benjamini-Hochberg method.
Results
Whole-genome overview and active mutational processes
We detected a median of 3593 (range, 1691-6597) somatic mutations per case (1.2 mutations per megabase), including 33 (range, 13-56) coding mutations per tumor. MCL tumors carried a median of 9 (range, 1-56) SV and 9 (range, 0-37) CNA (supplemental Figures 1-3; supplemental Tables 9-11). The mutational burden was similar in both MCL subtypes, but cMCL carried higher number of SV (median, 13 vs 3; P < .001) and CNA (median, 12 vs 1; P < .001) than nnMCL (supplemental Figures 1-3). A complex genomic landscape, defined by the presence of ≥15 SV and/or ≥15 CNA (mean values in cMCL), was observed in 20 (45%) cMCL and 2 (12%) nnMCL (P = .018).
We identified 6 predominant signatures of mutational processes operative in MCL: clock-like signatures 1 (SBS1) and 5 (SBS5) present in all MCL; the noncanonical (SBS9) and canonical (SBS84) activation-induced cytidine deaminase (AID) enriched in nnMCL, with SBS84 predominantly associated with IG genes and active promoters/enhancers; and 2 APOBEC-related signatures (SBS2 and SBS13) occurring in regions of kataegis, particularly those associated with SV and chromothripsis, and enriched in cMCL, which is in line with their higher number of SV (supplemental Figures 4-7).
Genomic/epigenomic characterization of CCND1 rearrangement
CCND1 was rearranged with immunoglobulin (IG) genes (IG/CCND1) in the 60 cases overexpressing cyclin D1, 59 cases with IG heavy locus (IGH) and 1 with IG kappa locus (IGK) (Figure 1A; supplemental Table 12). One cMCL was a cyclin D1-negative MCL that overexpressed cyclin E1/E2.30 This unusual case had MCL morphology and phenotype (CD20+, CD5+) with strong expression of SOX11, and that were maintained in different relapses. In 55 cases, the IG breaks had evidence of being mediated by RAG enzymes during V(D)J recombination. As expected,34 this pattern was seen in 40 of 43 (93%) cMCL derived from naïve-like B cells, but also in 15 of 17 (88%) memory-like nnMCL. Intriguingly, the IG breaks in the remaining 5 cases (3 cMCL, 2 nnMCL) appeared to involve CSR in 3 cases and SHM in 2 cases (Figure 1A; supplemental Table 13).
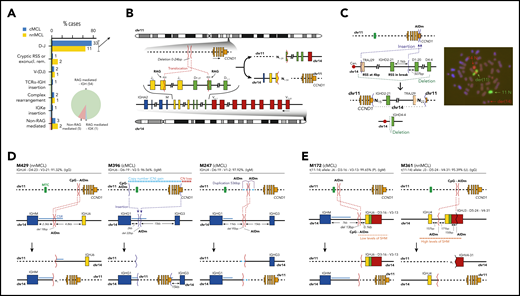
Characterization of the IG breaks of the IG/CCND1 translocation. (A) Distribution of the IG breaks according to their underlying mechanism (RAG or non-RAG mediated) and location of the breakpoints in chr14. (B) Schema of the most recurrent translocation pattern with breaks at IGHD and IGHJ genes, near RSS, likely generated during the first step of an IGH D-J rearrangement. The presence of N-nucleotides in both breakpoints (NX) supports a RAG-mediated process. (C) Unbalanced IG/CCND1 translocation in which virtually the entire 14q arm is inserted at the 3′ UTR of CCND1. In this case, a single event truncated the CCND1 3′ UTR region and placed the IG enhancer near CCND1. The FISH whole-chromosome painting for chr11 and chr14 verifies the ins(11;14)(q13;q11q32) identified by WGS. For the sake of clarity, an interphasic nuclei present in the lower left part of the original picture was masked using Adobe Photoshop. (D) Representation of 3 cases in which the IG breakpoint was likely mediated by AID during CSR. The switch regions 5′ of the IGH constant genes are indicated by a blue line. The productive V(D)J rearrangement, IGHV identity (%), and isotype expression is specified. (E) Representation of 2 cases showing evidence for the involvement of the SHM machinery in the breakpoints of chr14 in already V(D)J-rearranged alleles. P, productive rearrangement; U, unproductive rearrangement.
Characterization of the IG breaks of the IG/CCND1 translocation. (A) Distribution of the IG breaks according to their underlying mechanism (RAG or non-RAG mediated) and location of the breakpoints in chr14. (B) Schema of the most recurrent translocation pattern with breaks at IGHD and IGHJ genes, near RSS, likely generated during the first step of an IGH D-J rearrangement. The presence of N-nucleotides in both breakpoints (NX) supports a RAG-mediated process. (C) Unbalanced IG/CCND1 translocation in which virtually the entire 14q arm is inserted at the 3′ UTR of CCND1. In this case, a single event truncated the CCND1 3′ UTR region and placed the IG enhancer near CCND1. The FISH whole-chromosome painting for chr11 and chr14 verifies the ins(11;14)(q13;q11q32) identified by WGS. For the sake of clarity, an interphasic nuclei present in the lower left part of the original picture was masked using Adobe Photoshop. (D) Representation of 3 cases in which the IG breakpoint was likely mediated by AID during CSR. The switch regions 5′ of the IGH constant genes are indicated by a blue line. The productive V(D)J rearrangement, IGHV identity (%), and isotype expression is specified. (E) Representation of 2 cases showing evidence for the involvement of the SHM machinery in the breakpoints of chr14 in already V(D)J-rearranged alleles. P, productive rearrangement; U, unproductive rearrangement.
In 44 of the 55 cases with RAG-mediated IG rearrangements, the IG breaks occurred in IGHD and IGHJ genes, likely during the initial IGHD–IGHJ recombination. We identified the RAG recombination signal sequence (RSS) at the IGHD and IGHJ breakpoints with the addition of 1 to 59 nontemplated nucleotides (N-nucleotides) at both derivative junctions (Figure 1A-B). These N-nucleotide segments were longer than in physiological V(D)J recombination of B cells, likely because of the absence of selection to retain a limited length of the IGH third complementarity-determining region required for a functional B-cell receptor in these IGH/CCND1 rearrangements. The IGHJ and IGHD genes involved in these translocations were similar in cMCL and nnMCL and mainly related to those used in physiological recombination of normal B cells (supplemental Figure 8). The remaining 11 of 55 cases with RAG rearrangements (RSS and N-nucleotides) included 3 cases with breaks at canonical RSS of an IGHD and IGHV, suggesting that the translocation occurred during the second step of the V(D)J recombination; 3 cases with 1 of the breaks at an atypical cryptic RSS distant from the near IGHD or IGHJ segments, or missing a RSS potentially caused by exonucleolytic removal; 3 cases with complex rearrangements including small fragments of chromosomes other than chromosome (chr)11/14; and 2 cases with unbalanced translocations in which the IGK locus or virtually all 14q (TRAJ19-IGHD21 segment) were inserted upstream or at the 3′ untranslated region (UTR) of CCND1, respectively (Figure 1A-C; supplemental Figure 9).
Five MCL had a t(11;14) with breakpoints in the IGH gene consistent with the involvement of AID in CSR and SHM mechanisms and, therefore, generated in a mature B cell probably during a follicular germinal center reaction (Figure 1D-E; supplemental Figures 10 and 11). In 2 cases, the breakpoints were in the IGHM- and IGHG1-defined CSR regions, respectively. In 1 case, the breakpoint was between IGHG1 and IGHG3, but in the absence of N-nucleotides and RSS sites and the presence of point mutations, CSR was the most probable mechanism. In the last 2 cases, the mechanism seems to have involved the SHM machinery, with breakpoints at unusual sites of the IGHV/D/J genes. These translocations occurred in already V(D)J-rearranged alleles, reinforcing the idea of being acquired at a mature B-cell stage. The comparison of the percentage of cells carrying the translocation by FISH and the tumor cell content detected by flow cytometry available in 4 cases was relatively similar, suggesting that these translocations were clonal. These 5 translocations seem to trigger a similar overexpression of CCND1 as in conventional RAG rearrangements and do not confer different clinical or biological features to the tumors (supplemental Figure 12; supplemental Table 13).
We next analyzed the breakpoints on chr11. Nineteen translocations (14 cMCL, 5 nnMCL) occurred at a small region of 89 bp previously recognized as a major translocation cluster (MTC). The remaining breakpoints were similarly scattered at both sides of the MTC in cMCL and nnMCL, and their distribution was not associated with IG κ/λ expression. As previously suggested, most 5′ and MTC breaks occurred near CpG sites and AID motifs, whereas 3′ breaks were only found near AID motifs (Figure 2A; supplemental Figures 13 and 14).35,36

Integrative analysis of chr11 breaks of the IG/CCND1 translocation. (A) Distribution of breakpoints observed in chr11 in cMCL (top) and nnMCL (bottom). The number of cases with breakpoints in close proximity is summarized using a sliding window of 89 bp (MTC length) starting from the MTC region (shown in green). (B) Representation of the reference epigenomes of 5 MCL cases and 15 normal B cell samples spanning the B-cell maturation program. Numbers in brackets indicate the number of samples considered to build the consensus chromatin map of each cell type. (top) The breakpoints of each case are highlighted by a white square. (middle) Signal of H3K4me1 in B-cell acute lymphoblastic leukemia (B-ALL). (bottom) Chromatin accessibility (ATAC-seq peaks) showing the presence of an open chromatin region near the MTC region. B cells are grouped, and a consensus is depicted. (C) Reconstruction of the chromatin states of the IG/CCND1 translocated allele. Dashed lines indicate the junction of both chromosomes to maintain the breakpoints relative to the MTC and CCND1. (D) Hi-C contact matrices for memory B cells (MBC) and 2 nnMCL cases. The TAD associated with CCND1 and modulated upon the IG/CCND1 translocation is highlighted. GCBC, germinal center B cell; NBCB, naive B cell from peripheral blood; NBCT, naive B cell from tonsil; PC, plasma cell.
Integrative analysis of chr11 breaks of the IG/CCND1 translocation. (A) Distribution of breakpoints observed in chr11 in cMCL (top) and nnMCL (bottom). The number of cases with breakpoints in close proximity is summarized using a sliding window of 89 bp (MTC length) starting from the MTC region (shown in green). (B) Representation of the reference epigenomes of 5 MCL cases and 15 normal B cell samples spanning the B-cell maturation program. Numbers in brackets indicate the number of samples considered to build the consensus chromatin map of each cell type. (top) The breakpoints of each case are highlighted by a white square. (middle) Signal of H3K4me1 in B-cell acute lymphoblastic leukemia (B-ALL). (bottom) Chromatin accessibility (ATAC-seq peaks) showing the presence of an open chromatin region near the MTC region. B cells are grouped, and a consensus is depicted. (C) Reconstruction of the chromatin states of the IG/CCND1 translocated allele. Dashed lines indicate the junction of both chromosomes to maintain the breakpoints relative to the MTC and CCND1. (D) Hi-C contact matrices for memory B cells (MBC) and 2 nnMCL cases. The TAD associated with CCND1 and modulated upon the IG/CCND1 translocation is highlighted. GCBC, germinal center B cell; NBCB, naive B cell from peripheral blood; NBCT, naive B cell from tonsil; PC, plasma cell.
Next, we exploited the analysis of the reference epigenomes to define the local chromatin features associated with the t(11;14) (Figure 2B).33 The chr11 breakpoint was at the MTC locus in 2 cases, and 5′ or 3′ regions distant from the MTC in the other 3 cases. We observed that the MTC locus corresponds to an open chromatin region (defined by ATAC-seq) with histone marks of active regulatory elements (H3K4me1/H3K4me3/H3K27ac) in the 5 MCL and also in normal naïve and memory B cells, but not in germinal center or plasma cells. As the t(11;14) is mostly associated with the V(D)J rearrangement occurring at precursor B-cell stage, we analyzed the chromatin of B-cell acute lymphoblastic leukemias available through the Blueprint Consortium as a surrogate of precursor B cells.32 We observed that the MTC locus also corresponds to an enhancer region (H3K4me1) in these cells (Figure 2B). Interestingly, breakpoints occurring at the MTC lead to an extension of the existing enhancer/promoter marks of this locus, whereas 2 breakpoints distant from the MTC seemed to generate novel active enhancer/promoters. This gain of regulatory marks in chr11 breakpoints is most likely caused by the fusion of these regions with the active enhancer/promoter region of the IG (Figure 2C). HiC-seq performed in tumor cells from these 5 MCL and normal naïve and memory B cells showed a reconfiguration of the 3-dimensional (3D) chromatin structure of this region in all MCL as compared with their normal counterparts. The chr11 breakpoints overlapped with novel tumor-specific topologically associating domain (TAD) borders. Of note, CCND1 was always found at the distal border of the TAD, confirming that these IG-novel chr11 promoter/enhancer regions contribute to dysregulate CCND1 by creating specific build blocks (Figure 2D; supplemental Figure 15).
Landscape of structural alterations in MCL subtypes
The WGS analysis allowed the precise characterization of the multiple structural alterations in MCL. Complex alterations were significantly more frequent in cMCL (52%) than nnMCL (18%; P = .02; Figure 3A). Chromothripsis events were clonal in all but 1 case, mainly involving chromosomes 1, 5, 10, 12, and 13 and recurrently targeting RB1 in 4 (9%) cases and TERT in 2 (12%) nnMCL (Figure 3B). Chromoplexia affected 14 different chromosomes (chromosomes 2, 6, 12, and 19 in 2 cases each), with TERT the only cancer gene affected in 1 case (Figure 3Ci). Chromothripsis and chromoplexia occurred in both MCL subtypes, but breakage-fusion-bridge (BFB) cycles, a novel and frequent finding in MCL, was only observed in cMCL (20%). BFB cycles generated recurrent high-level amplification of BMI1 (4 cases) and MIR17HG (2 cases), and were associated with worse clinical outcome (Figure 3D). One cMCL presented features of a replication-based mechanism of templated insertions (Figure 3Cii).
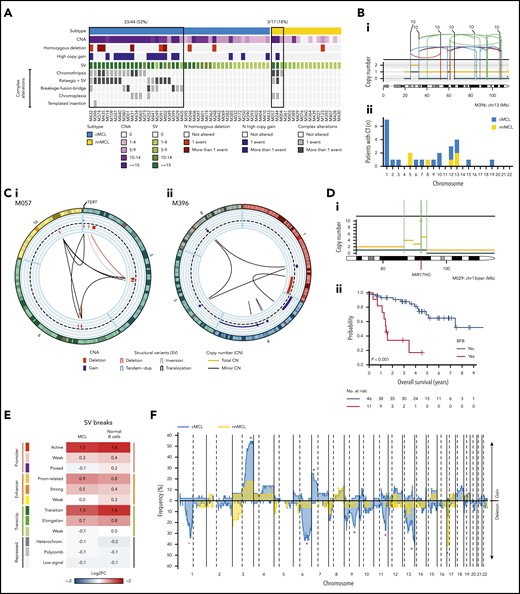
Complex genomic alterations in MCL identified by WGS. (A) Genomic complexity identified in both subtypes of MCL. Cases are depicted in columns. Rows illustrate CNA complexity, the number of homozygous deletions and amplifications, SV complexity, and different SV complex phenomena characterized by clustered SV (chromothripsis, kataegis overlapping with SV, BFB cycles, chromoplexia, and templated insertions). (B) Illustrative example of a whole chr13 affected by chromothripsis in a cMCL (i). (ii) Bar plot of chromosomes affected by chromothripsis (CT) in the 2 MCL subtypes. (C) Partial circos plot showing the 3 chromosomes involved in chromoplexia and TERT amplification and translocation in a nnMCL (i). (ii) Partial circos plot showing 4 chromosomes with crossed rearrangements and template insertions (focal gains) in 3 of them (chromosomes 1, 5, and 8) in a cMCL. (D) Illustrative example of BFB cycles resulting in amplification of MIR17HG in 13q accompanied by a terminal deletion (i). (ii) Kaplan-Meier curve of OS according to the presence of BFB cycles. (E) Enrichment of SV breakpoints in different chromatin states, as compared with background, in MCL and normal B cells. (F) Global profile of CNA in cMCL (blue) and nnMCL (yellow). The regions with different proportions of altered cases between subtypes (Q < 0.15) are indicated (*). Only regions with at least 6 altered cases were included in the comparison.
Complex genomic alterations in MCL identified by WGS. (A) Genomic complexity identified in both subtypes of MCL. Cases are depicted in columns. Rows illustrate CNA complexity, the number of homozygous deletions and amplifications, SV complexity, and different SV complex phenomena characterized by clustered SV (chromothripsis, kataegis overlapping with SV, BFB cycles, chromoplexia, and templated insertions). (B) Illustrative example of a whole chr13 affected by chromothripsis in a cMCL (i). (ii) Bar plot of chromosomes affected by chromothripsis (CT) in the 2 MCL subtypes. (C) Partial circos plot showing the 3 chromosomes involved in chromoplexia and TERT amplification and translocation in a nnMCL (i). (ii) Partial circos plot showing 4 chromosomes with crossed rearrangements and template insertions (focal gains) in 3 of them (chromosomes 1, 5, and 8) in a cMCL. (D) Illustrative example of BFB cycles resulting in amplification of MIR17HG in 13q accompanied by a terminal deletion (i). (ii) Kaplan-Meier curve of OS according to the presence of BFB cycles. (E) Enrichment of SV breakpoints in different chromatin states, as compared with background, in MCL and normal B cells. (F) Global profile of CNA in cMCL (blue) and nnMCL (yellow). The regions with different proportions of altered cases between subtypes (Q < 0.15) are indicated (*). Only regions with at least 6 altered cases were included in the comparison.
Although chromosomal translocations and inversions were relatively frequent in MCL, they were not recurrent and very few were associated with known cancer genes. Two cMCL had SV that truncated PAX5. One cMCL had a balanced 2p inversion that fused MYCN with IGK enhancer, leading to high overexpression of the gene, and the patient had central nervous system involvement.37 One cMCL carried an activating MYC non-IG rearrangement that remodeled the adjacent MYC regulatory regions associated with PVT138 and hijacked distant enhancers in chr8 (supplemental Figures 16-18).
We analyzed the presence of SV signatures and identified 3 patterns mainly related to the presence of clustered structural alterations, high SV/CNA complexity, and small alterations with low genomic complexity (supplemental Figure 19). Remarkably, SV breaks were enriched in active promoters and enhancers and in transcription elongation–associated chromatin regions, suggesting that open/active chromatin might facilitate SV formation, and they may impact gene expression (Figure 3E).
The CNA detected by WGS confirmed the specific MCL profile previously characterized by frequent losses of 1p22-p13, 6q, 9p21/CDKN2A, 9q22-q31, 11q22-q23/ATM, 13q14/RB1, 13q33-q34, and 17p/TP53, and gains of 3q25-q29 and 7p. We also identified novel recurrent losses at 10q21.1 and 15q14-q21.1 and significant differences in the distribution of specific alterations in cMCL (losses of 1p22-p13, 6q, 9q22-q31, 11q22-q23/ATM, 13q33-q34, and gains of 3q25-q29 and 7p) and nnMCL (loss of 17p/TP53) (Figure 3F; supplemental Figures 20 and 21).
MCL driver alterations
To discover genomic alterations involved in MCL lymphomagenesis we integrated mutations, CNA and SV combining the results of the 61 WGS with the WES of 21 nonoverlapping cases (supplemental Tables 14 and 15).11 The 82 cases encompassed 74% cMCL and 26% nnMCL. We identified 26 genes significantly altered in the whole cohort, and 4 genes mutated at lower frequency, but carrying known driver alterations (NOTCH1, NOTCH2, TLR2, and PAX5). In addition, we identified 13 chromosomal regions without a defined target gene significantly affected by CNA, resulting in deletions in most cases (Figure 4A; supplemental Figure 22; supplemental Tables 16-18). Overall, 81 of 82 (99%) MCL cases had at least 1 driver alteration in addition to the t(11;14) (median, 6; range, 0-14). The most frequently altered genes have been previously described in MCL and were ATM (48%), CCND1 (44%) with exon1/intron1 somatic mutations (26%) and/or 3′ UTR activating alterations (21%), TP53 (26%), KMT2D (23%), RB1 (23%), BIRC3 (22%), CDKN2A (21%), SP140 (13%), NSD2 (12%), BMI1 (11%), MIR17HG (10%), and UBR5 (6%). Furthermore, we identified 7 novel MCL driver genes altered by missense or truncating mutations and deletions, including CDKN1B (12%), SAMHD1 (10%), BCOR (9%), SYNE1 (6%), HNRNPH1 (6%), SMARCB1 (4%), and DAZAP1 (4%) (Figure 4A). The integration of WGS, gene expression and FISH analysis identified the relevance of TERT in MCL (15%) affected by promoter mutations (3 cases), gain/amplification (6 cases), and translocations (3 cases) with high TERT overexpression without an apparent impact on telomere length (supplemental Figure 23). However, cases with ATM alterations had significant shorter telomeres (supplemental Figure 24). No other recurrent mutations in expressed or regulatory noncoding regions were found. We identified a significant co-occurrence of several alterations such as ATM with +10p12/BMI1 or +8q24/MYC with −13q14/RB1, and recognized early driver events including ATM/11q alterations and −17p, or late events including +8q24/MYC and BIRC3 mutations, among others (supplemental Figure 25; supplemental Table 19). Collectively, 8 main pathways were frequently altered in MCL including proliferation, cell survival, DNA damage response (DDR), telomere maintenance, chromatin remodeling, B-cell receptor/Toll-like receptor/NF-κB signaling, NOTCH signaling, and RNA regulation (Figure 4A).
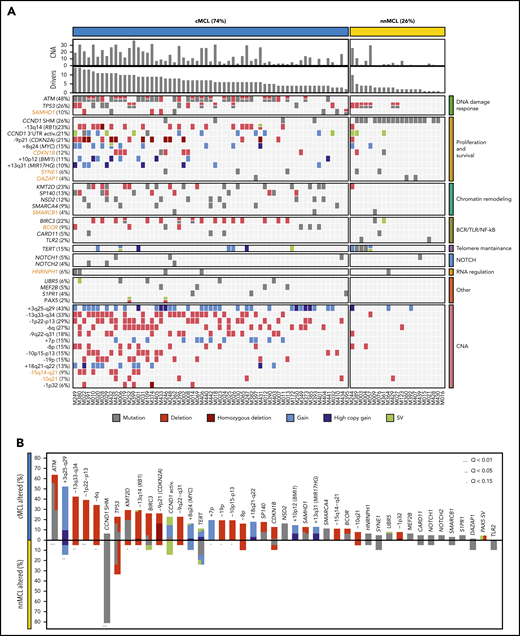
Significantly mutated genes/CNA and pathways. (A) Oncoprint representation of the 43 driver alterations identified in MCL. Drivers are depicted in rows, and cases are displayed in columns. Novel driver alterations identified in this study are highlighted in dark orange. (B) Distribution and type of driver alterations in the 2 different MCL subtypes. Drivers with a different proportion of altered cases between subtypes (Q < 0.15) are indicated.
Significantly mutated genes/CNA and pathways. (A) Oncoprint representation of the 43 driver alterations identified in MCL. Drivers are depicted in rows, and cases are displayed in columns. Novel driver alterations identified in this study are highlighted in dark orange. (B) Distribution and type of driver alterations in the 2 different MCL subtypes. Drivers with a different proportion of altered cases between subtypes (Q < 0.15) are indicated.
We also searched whether the MCL drivers described in this study and additional known cancer predisposing genes39,40 were recurrently mutated in the germline of the patients; we found 7 cases with ATM and 2 with CHEK2 mutations (supplemental Table 20). In 2 cases with germline ATM mutation, the wild-type allele was lost in the tumor. The 2 CHEK2 mutations had been previously recognized as pathogenic in cancer.41-43
Finally, most MCL drivers were found to be preferentially altered in cMCL cases, with the unique exception of SHM in CCND1 mainly found in nnMCL (Figure 4B). Of note, ATM alterations (64%); deletions of 1p, 10p, and 19p; and gain of 7p were exclusively seen in cMCL, whereas TP53 and TERT alterations were the only drivers slightly enriched in nnMCL, with all 5 cases with TERT alterations carrying concomitant TP53 aberrations (Figure 4A-B). Altogether, cMCL cases had a significant higher number of driver alterations than nnMCL (median, 7 vs 2; P < .001).
DNA methylome of MCL subtypes and interplay with genomic alterations
We next studied the DNA methylome of MCL and its relationship with driver genetic alterations. We previously classified MCL cases into 2 clusters (C1 and C2) on the basis of DNA methylation imprints of their postulated cell of origin, ie, pregerminal and postgerminal center B cells, respectively.16 We found that cMCL and nnMCL widely overlapped with C1 and C2 epigenetic subgroups, respectively (P < .001; Figure 5A). A principal component analysis showed that the main source of DNA methylation variability is related to the MCL cell of origin, and consequently is associated with its clinicobiological features, such as IGHV identity, total number of driver alterations, and ATM or CCND1 mutations in cMCL and nnMCL, respectively (Figure 5B; supplemental Figure 26). We have previously observed that an additional source of DNA methylation variability among MCL was the accumulation of DNA methylation changes in the tumors, which, in addition, was related to clinical outcome.16 The majority of these changes were located at transcriptionally silenced regions, particularly at low signal heterochromatin and H3K27me3 for hypomethylation and hypermethylation, respectively.16 Mounting lines of evidence indicate that these DNA methylation changes do not play a regulatory role, but instead seem to gradually accumulate during rounds of cell divisions.44-50 Based on this principle, we have recently built a DNA methylation-based mitotic clock called epiCMIT (epigenetically determined cumulative mitoses), which reflects the proliferative history of B-cell tumor samples (supplemental Methods).51 Interestingly, in the present MCL cohort, the second main source of DNA methylation variability after the cell of origin was related to this epiCMIT score (Figure 5B). As expected, the epiCMIT correlated with mutational signatures related to cell division (SBS1, SBS5, and SBS9) and Ki67-index (Figure 5C; supplemental Figure 26).
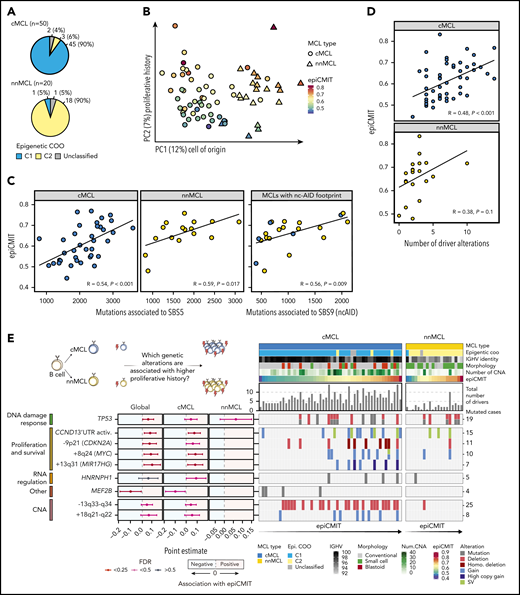
DNA methylome of MCL subtypes and its relationship with genomic alterations. (A) Overlap of cMCL and nnMCL with epigenetic subgroups on the basis of cell of origin methylation signature. (B) Principal component analysis of DNA methylation data for 70 MCL (first and second components are shown). MCL subtypes are represented as triangles or circles, whereas the color represents the proliferative history on the basis of DNA methylation of each MCL sample (epiCMIT score). (C) epiCMIT correlates with mutational signatures related to cell division, including SBS5 and SBS9 (ncAID). (D) epiCMIT correlates with the total number of driver alterations in MCL, particularly in cMCL. (E) Driver alterations associated with higher or lower epiCMIT. The 95% confidence intervals for the mean epiCMIT difference between the presence and absence of each alteration are shown. The effect in the whole cohort was adjusted by the cell of origin (C1/C2). (left) Colors depict different significant levels after false discovery rate (FDR) correction. Oncoprint with genetic alterations associated with the epiCMIT together with clinicobiological variables. (right) Patients are ordered according to the epiCMIT score, separately in the 2 MCL subtypes.
DNA methylome of MCL subtypes and its relationship with genomic alterations. (A) Overlap of cMCL and nnMCL with epigenetic subgroups on the basis of cell of origin methylation signature. (B) Principal component analysis of DNA methylation data for 70 MCL (first and second components are shown). MCL subtypes are represented as triangles or circles, whereas the color represents the proliferative history on the basis of DNA methylation of each MCL sample (epiCMIT score). (C) epiCMIT correlates with mutational signatures related to cell division, including SBS5 and SBS9 (ncAID). (D) epiCMIT correlates with the total number of driver alterations in MCL, particularly in cMCL. (E) Driver alterations associated with higher or lower epiCMIT. The 95% confidence intervals for the mean epiCMIT difference between the presence and absence of each alteration are shown. The effect in the whole cohort was adjusted by the cell of origin (C1/C2). (left) Colors depict different significant levels after false discovery rate (FDR) correction. Oncoprint with genetic alterations associated with the epiCMIT together with clinicobiological variables. (right) Patients are ordered according to the epiCMIT score, separately in the 2 MCL subtypes.
We next explored whether the proliferative history (epiCMIT) was related to genetic changes. Indeed, we observed a significant association between the epiCMIT and the number of driver alterations and CNA burden (Figure 5D; supplemental Figure 26). At a single driver level, 9 genetic alterations were associated with higher proliferation histories of MCL samples, which were related to pathways linked to proliferation, survival, and DDR such as +8q24/MYC, −9p21/CDKN2A, and TP53 alterations. Interestingly, MCL carrying mutations in HNRNPH1 and MEF2B were associated with significantly higher and lower proliferation histories of MCL cells, respectively (Figure 5E; supplemental Figure 27).
Clinical implications
Finally, we analyzed the clinical relevance of the previous findings in 57 cases, excluding patients managed with palliative measures or studied at relapse. The main parameters associated with shorter OS were high lactate dehydrogenase and MCL International Prognostic Index (both with P = .002) and cMCL molecular subtype (P = .02). In addition, TP53 alterations, −9p21/CDKN2A, −13q14/RB1, and −9q22−q31 impaired the OS of the patients. Interestingly, 5 novel drivers were also associated with significant shorter OS (−15q14−q21, +8q24/MYC, SP140, +18q21-q22, and −13q33-q34); Q < 0.1; Figure 6A).
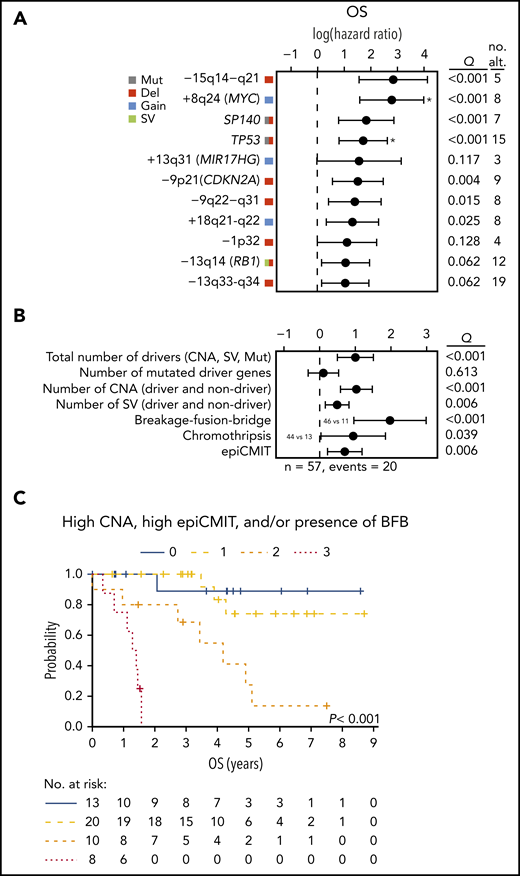
Clinical relevance of genomic and epigenomic alterations in MCL subtypes. (A) Impact of driver alterations on OS. The impact is quantified with the 95% confidence interval of the log hazard ratios. The Q value shown is the adjusted P value of the log-rank test. Only alterations with at least 3 altered cases and prognostic value are shown. Drivers with independent prognostic value (Q < 0.05) of the number of CNA are indicated (*). (B) Impact of the cumulative number of genetic and epigenetic changes to OS. The impact is quantified with the 95% CI of the log hazard ratios. Continuous variables were scaled. The Q value shown is the adjusted P value of the simple Cox regression for the continuous variables or the log-rank test for the binary variables (BFB and chromothripsis). The number of SV was available in 42 cases. The epiCMIT was available in 51 cases and its effect was adjusted by the cell of origin (C1/C2). (C) Kaplan-Meier curves of OS according to the number of risk features (high CNA, high epiCMIT, and/or presence of BFB). Number of CNA >7 (median) and epiCMIT >0.6 (valley of a bimodal distribution) were considered high. no. alt, number of altered cases.
Clinical relevance of genomic and epigenomic alterations in MCL subtypes. (A) Impact of driver alterations on OS. The impact is quantified with the 95% confidence interval of the log hazard ratios. The Q value shown is the adjusted P value of the log-rank test. Only alterations with at least 3 altered cases and prognostic value are shown. Drivers with independent prognostic value (Q < 0.05) of the number of CNA are indicated (*). (B) Impact of the cumulative number of genetic and epigenetic changes to OS. The impact is quantified with the 95% CI of the log hazard ratios. Continuous variables were scaled. The Q value shown is the adjusted P value of the simple Cox regression for the continuous variables or the log-rank test for the binary variables (BFB and chromothripsis). The number of SV was available in 42 cases. The epiCMIT was available in 51 cases and its effect was adjusted by the cell of origin (C1/C2). (C) Kaplan-Meier curves of OS according to the number of risk features (high CNA, high epiCMIT, and/or presence of BFB). Number of CNA >7 (median) and epiCMIT >0.6 (valley of a bimodal distribution) were considered high. no. alt, number of altered cases.
Next, we assessed the potential clinical relevance of the genomic complexity and epigenetic changes. The total number of CNA, number of SV, presence of BFB, chromothripsis, and the epiCMIT, but not the number of driver mutations, were associated with shorter OS (Q < 0.05; Figure 6B). TP53 and MYC alterations had prognostic value for OS independently of the total number of CNA (Q < 0.05; Figure 6A). Of note, the number of CNA, presence of BFB, and epiCMIT retained independent prognostic value for OS in a multivariate analysis (P < .05), and stratified patients with distinct clinical outcomes (Figure 6C).
Discussion
In this study we have provided a comprehensive characterization of the molecular development and progression of MCL. The primary CCND1 rearrangement is mediated by the same mechanisms in cMCL and nnMCL, but these subtypes differ in their epigenetic makeup, subsequent driver composition, and genomic complexity that influence their different clinical behavior.
The t(11;14) in both cMCL and nnMCL originates in precursor B cells mediated by RAG activity, even though the tumor cell expansion will arise in a pregerminal or postgerminal center cell, respectively, as supported by the different DNA methylation signatures related to naïve and memory-like B cells. The mechanism of diversification of these MCL subtypes may be determined in part by SOX11 overexpression in cMCL, as previously described.5 In this comprehensive study, we have not identified any genetic alteration leading to SOX11 overexpression, emphasizing the relevance of its epigenetic dysregulation.16 Intriguingly, the origin of the t(11;14) in 8% of the cases, including both cMCL and nnMCL, seems to occur in a mature B cell mediated by SHM/CSR mechanisms without apparent clinical or biological differences. This situation parallels the inverse findings in most cases of multiple myeloma, in which the t(11;14) occurs in a mature B cell mediated by AID/CSR, but it may also arise in a precursor B cell in a minority of tumors.52 These findings suggest that the development of these different lymphoid and plasma cell neoplasms is independent of the B-cell differentiation stage in which the initial oncogenic event occurs. Our integrative (epi)genomic analysis also suggests that the open and active chromatin structure of the MTC region may allow the access of AID to mediate the DNA breaks and subsequent translocation,53-56 and shows that a 3D chromatin reconfiguration of the CCND1 locus upon the translocation favors CCND1 overexpression.
We have identified novel driver genes involved in different mechanisms relevant for MCL pathogenesis such as cell cycle (CDKN1B), DNA replication and DDR (SAMHD1),57 RNA processing (HNRNPH1),58 or chromatin modification (SMARCB1).59 The more aggressive behavior of cMCL is associated with higher number of drivers, particularly CNA, compared with nnMCL. Interestingly, ATM alteration seems a specific and early event driving cMCL (64% of cases) that may even occur in the germline of some patients. The inactivation of this element may promote the shortening of telomeres, facilitating the development of the frequent structural genomic complexity of these tumors.37 On the contrary, nnMCL have very few driver alterations, with only TERT and TP53 slightly more enriched in this subgroup. The high genomic complexity in a small subset of nnMCL carrying these 2 alterations suggests that they may be an alternative mechanism facilitating tumor progression.
The WGS of this cohort shows the complex genomic landscape of MCL at unprecedented high resolution and uncovers novel mechanisms of oncogenic activation including BFB cycles amplifying BMI1 and MIR17HG,60,61 or inversions and translocations reorganizing regulatory regions (NMYC, MYC, TERT).62 Indeed, this genomic complexity emerges as one of the most relevant parameters determining the patient outcome, and is associated with increasing DNA methylation changes previously related to cell division.44-50 Our epiCMIT score captures these changes and correlates with higher proliferation, and specific genetic alterations such as −9p21 (CDKN2A), TP53, MYC, or the newly identified HNRNPH1, which collectively suggests that these alterations may provide to MCL cells a higher proliferative capacity.
Several individual drivers have prognostic value. However, their impact is mainly because of their association with the global genomic complexity captured by the number of CNA. Only TP53 and MYC alterations add prognostic information to CNA, reinforcing the prognostic relevance of these individual alterations observed in previous studies.17,63-66 Interestingly, the epiCMIT score also has independent prognostic value, indicating that the complex evolution of MCL may be better recognized by the integration of genomic and epigenomic parameters.
In conclusion, the integration of whole-genome and epigenomic analyses of MCL reveals the complexity and relationship of these alterations that determine the different evolution of the 2 MCL subtypes and define subsets of patients with marked distinct outcomes.
Our entire genomic data set, including whole-genome sequencing, SNP arrays, gene expression arrays, and DNA methylation arrays have been deposited at the European Genome-phenome Archive (accession number EGAS00001004165).
The online version of this article contains a data supplement.
The publication costs of this article were defrayed in part by page charge payment. Therefore, and solely to indicate this fact, this article is hereby marked “advertisement” in accordance with 18 USC section 1734.
Acknowledgments
The authors are grateful to have used the hematopathology collection registered at the Biobank of the Hospital Clinic–Institut d’Investigacions Biomèdiques August Pi i Sunyer (IDIBAPS) for sample procurement. The authors are indebted to the IDIBAPS Genomics core facility. We are grateful to Miriam Prieto, Silvia Martín, and Sílvia Ruiz for their technical and logistic assistance.
This work was supported by research funding from Fondo de Investigaciones Sanitarias, Instituto de Salud Carlos III (PI17/01061 to S.B.); National Institutes of Health, National Cancer Institute “Molecular Diagnosis, Prognosis, and Therapeutic Targets in Mantle Cell Lymphoma” (P01CA229100 to E.C.); Ministerio de Ciencia e Innovación (RTI2018-094274-B-I00 to E.C., SAF2017-87811-R to X.S.P., and SAF2017-86126-R to J.I.M.-S.); Generalitat de Catalunya Suport Grups de Recerca AGAUR (2017-SGR-1142 to E.C., and AGAUR 2017-SGR-736 to J.I.M.-S.); German Ministry of Science and Education in the framework of the ICGC MMML-Seq (01KU1002) and ICGC DE-Mining (01KU1505) to R.S. F.N. is supported by a predoctoral fellowship of the Ministerio de Ciencia e Innovación (BES-2016-076372). A.D.-N. is supported by the Department of Education of the Basque Government (PRE_2017_1_0100). E.C. is an Academia Researcher of the “Institució Catalana de Recerca i Estudis Avançats” of the Generalitat de Catalunya.
This work was mainly developed at the Centre Esther Koplowitz, Barcelona, Spain.
Authorship
Contribution: F.N. and D.M.-G. analyzed and interpreted data, wrote the manuscript, and contributed to the conception of the study; G. Clot performed statistical and clinical analyses; A.D.-N., A.N., R.R., J.G.-A., R.V.-M., C.L., M.P., G. Castellano, P.J., D. Costa, D.T., and R.K. analyzed and interpreted data; M.D.-F., R.V.-B., M.K., and V.C. analyzed and interpreted epigenetic data; A.N., M.A., B.E., A.M., I.R.-C., R.S., and D. Colomer performed sample preparation and/or provided clinical data; E.G. and A.L.-G. centralized clinical data and interpreted data; J.I.M.-S. and X.S.P. analyzed and interpreted data, and contributed to the conception of the study; S.B. and E.C. jointly designed the study, supervised the research, interpreted data, and wrote the manuscript; and all authors read, commented on, and approved the manuscript.
Conflict-of-interest disclosure: E.C. is named inventor on 2 patents filed by the National Institutes of Health, National Cancer Institute: “Methods for selecting and treating lymphoma types,” licensed to NanoString Technologies, and “Evaluation of mantle cell lymphoma and methods related thereof.” X.S.P. has ownership interest in DREAMgenics. The remaining authors declare no competing financial interests.
Correspondence: Elias Campo, Unitat Hematopatologia, Hospital Clínic, Villarroel 170, 08036 Barcelona, Spain; e-mail: ecampo@clinic.cat; and Sílvia Beà, Molecular Pathology of Lymphoid Neoplasms, Institut d’Investigacions Biomèdiques August Pi i Sunyer, Rosselló, 153, 08036 Barcelona, Spain; e-mail: sbea@clinic.cat.

This feature is available to Subscribers Only
Sign In or Create an Account Close Modal