

Key Points
In this phase 3 prospective clinical trial, ΔSUV on i-PET predicted OS in large cell lymphoma.
With appropriate standardization, ΔSUV may be an imaging biomarker that can help guide clinical trials using PET response-adapted therapy.

Abstract
As part of a randomized, prospective clinical trial in large cell lymphoma, we conducted serial fluorodeoxyglucose positron emission tomography (FDG-PET) at baseline, after 2 cycles of chemotherapy (interim PET [i-PET]), and at end of treatment (EoT) to identify biomarkers of response that are predictive of remission and survival. Scans were interpreted in a core laboratory by 2 imaging experts, using the visual Deauville 5-point scale (5-PS), and by calculating percent change in FDG uptake (change in standardized uptake value [ΔSUV]). Visual scores of 1 through 3 and ΔSUV ≥66% were prospectively defined as negative. Of 524 patients enrolled in the parent trial, 169 agreed to enroll in the PET substudy and 158 were eligible for final analysis. In this selected population, all had FDG-avid disease at baseline; by 5-PS, 55 (35%) remained positive on i-PET and 28 (18%) on EoT PET. Median ΔSUV on i-PET was 86.2%. With a median follow-up of 5 years, ΔSUV, as continuous variable, was associated with progression-free survival (PFS) (hazard ratio [HR] = 0.99; 95% confidence interval [CI], 0.97-1.00; P = .02) and overall survival (OS) (HR, 0.98; 95% CI, 0.97-0.99; P = .03). ΔSUV ≥66% was predictive of OS (HR, 0.31; 95% CI, 0.11-0.85; P = .02) but not PFS (HR, 0.47; 95% CI, 0.19-1.13; P = .09). Visual 5-PS on i-PET did not predict outcome. ΔSUV, but not visual analysis, on i-PET predicted OS in DLBCL, although the low number of events limited the statistical analysis. These data may help guide future clinical trials using PET response-adapted therapy. This trial was registered at www.clinicaltrials.gov as #NCT00118209.
Introduction
Diffuse large B-cell lymphoma (DLBCL) is the most common aggressive non-Hodgkin lymphoma, accounting for about 30% of the ∼55 000 newly diagnosed cases per year in the United States. Fluorodeoxyglucose positron emission tomography/computed tomography (FDG PET/CT) has become an established test for staging and response assessment in patients with this disease.1-3 Interim FDG-PET (i-PET) after a few cycles of chemotherapy has been advocated as an imaging test and potential biomarker to predict response to chemotherapy and possibly also long-term outcome after completion of treatment.4,5 This is based on the premise that a greater and more rapid decline in FDG uptake in lymphoma sites indicates greater sensitivity to chemotherapy.6 For visual characterization of FDG uptake and classification of PET response, the visual Deauville 5-point scale (5-PS) is recommended5,7,8 and widely applied. However, designation of 5-PS may vary between expert and nonexpert readers,9 and therefore quantitative analysis of decline in FDG avidity (known as change in standardized uptake value [ΔSUV]) on i-PET may be more reproducible and accurate for assessing treatment response.10,11 As part of a prospective, multicenter National Clinical Trials Network trial Cancer and Leukemia Group B (CALGB) 50303 (NCT 00118209),12 we conducted the imaging substudy CALGB 580603 with the primary objective of evaluating the role of FDG PET as a biomarker of response. CALGB is now part of the Alliance for Clinical Trials in Oncology. At the time CALGB 50303 opened, preliminary data suggested that both i-PET (after a few cycles of chemotherapy) and end of treatment (EoT) PET could predict the outcome of patients with DLBCL undergoing chemotherapy.13,14 Our aim was to prospectively validate those initial data using current PET/CT techniques, modern PET interpretation criteria, and modern drug regimens. The long-term clinical results of CALBG 50303 were published recently.12 In the current manuscript, we specifically report on the FDG-PET findings in this phase 3 clinical trial.
Methods
CALGB 50303 was a prospective clinical trial, randomizing patients with de novo DLBCL to 6 cycles of rituximab, cyclophosphamide, hydroxydaunorubicin-vincristine (oncovin), and prednisone (R-CHOP) chemotherapy,15,16 or dose-adjusted etoposide, prednisone, oncovin (vincristine), cyclophosphamide, hydroxydaunorubicin, and rituximab17 with the aim of comparing clinical outcome with these regimens. The study design and treatment strategies have been described previously.12 Patients provided institutional review board-approved, protocol-specific, written informed consent to participate in the clinical trial. As part of the informed consent, patients were given the choice to participate in the optional imaging substudy (CALGB 580603), which included FDG-PET at baseline (≤30 days before initiation of therapy), 17 to 21 days postcycle 2 (and 0-4 days before cycle 3), and at the end of treatment (4-8 weeks after completion of cycle 6). Objectives of the imaging substudy were to identify biomarkers of response by FDG-PET that are predictive of remission and survival and to evaluate the use of semiquantitative measures of FDG uptake in defining response. Interim scans were collected only for investigational purposes and treating physicians were blinded to the results unless an urgent finding was noted by local nuclear medicine physicians. The scans were not used to alter therapy.
Rigorous PET quality control procedures were established. To be eligible for the PET substudy, participating sites had to submit the results of a standardized uniformity phantom study and the imaging files of 2 random, anonymized patients to the imaging core laboratory. After qualifying for participation, each site underwent an online site initiation, during which technical issues and questions relating to data transfer were addressed.
After confirming plasma glucose level <200 mg/dL and at least a 4-hour fasting period, patients were injected with 8 to 20 mCi of FDG intravenously and PET/CT scans were obtained approximately 60 to 80 minutes afterward. All studies were obtained on PET/CT scanners, using low-dose CT for attenuation correction. The imaging data (CT, PET emission data with and without attenuation correction) and ancillary data (equipment, CT settings, injected activity, plasma glucose level, FDG uptake time) were electronically submitted to the imaging core laboratory.
Data analysis
PET image review and data analysis were performed centrally and in retrospect, after all scans and quality control parameters had been collected by the imaging core laboratory. All scans were interpreted by 2 independent observers (H.S., N.H.) with more than 10 years of experience in interpreting oncologic PET. Sites of abnormal FDG uptake (nonphysiologic uptake with intensity greater than background) were recorded. The intensity of FDG uptake was measured by maximum SUV (SUVmax). Reference background activity was measured in regions placed in normal liver and mediastinal blood pool and scans were graded as positive or negative. In cases where the 2 observers disagreed, a third experienced PET reader (M.V.K.) independently reviewed the scan and served as adjudicator.
For both interim and EoT scan, the 5-PS5,18 was applied, with scores 1 through 3 (less than or equal to liver) prospectively defined as negative and scores 4 and 5 as positive. SUVs for sites of residual FDG uptake were also recorded. The percent change in FDG uptake from baseline to follow-up was defined as the difference between the highest SUV in any disease site at baseline and the highest SUV in any site of residual FDG uptake on follow-up, as a fraction of the former: ΔSUV = 100% × (baseline SUVmax − follow-up SUVmax)/baseline SUVmax. We specifically tested the hypothesis that prospectively defined ΔSUV ≥66% on i-PET after 2 cycles of chemotherapy could identify patients with better response and prognosis and do so more accurately than qualitative visual analysis.10,11,18 Interobserver agreement was assessed using the κ statistic. In assessing the prognostic value of the imaging variables, we focused on 2 clinical endpoints: progression-free survival (PFS) and overall survival (OS). As in the treatment protocol, PFS was defined as the time from randomization to documented progression, relapse, or death from any cause, whichever occurred first. OS was defined as the time between randomization and death from any cause. The extent of clinical follow-up was summarized using the reverse Kaplan-Meier method.19 Kaplan-Meier curves were used to estimate PFS and OS. Log-rank test or the univariable Cox proportional hazards (PH) models were used to assess the prognostic values of imaging variables; multivariable Cox PH models were used to adjust for international prognostic index (IPI; the randomization stratification factor in the parent trial) in the models. The magnitudes of prognostic effect of the imaging variables are presented as hazard ratios (HRs) and their corresponding 95% confidence interval (CI) intervals. Because the parent trial was not specifically powered for the imaging objectives, no adjustment of multiple comparisons was made for these analyses; P values are descriptive only and, in all cases, P < .05 was declared statistically significant. Data collection and statistical analyses were conducted by the Alliance Statistics and Data Center. All analyses were performed with R version 3.4.0 on the study database frozen on November 1, 2017. The dates of randomization for the first and last eligible patient included in the imaging substudy were June 25, 2007, and May 9, 2013, respectively.
Clinical trial data sharing
Deidentified individual participant data underlying the reported results are currently being shared with the PET reanalysis (petralymphoma.org) consortium. Future requests for data sharing should be addressed to the corresponding or senior author of this work.
Results
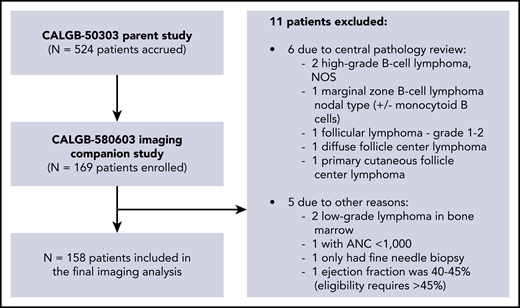
A total of 524 patients enrolled in the clinical trial.12 Of these, 169 patients also enrolled in the FDG-PET substudy. After exclusion of 11 ineligible patients, 158 patients were available for the final imaging substudy analysis (Figure 1), including 87 (55%) males and 71 (45%) females, with a median age of 55.6 years (range, 20-82). Two percent of these patients had stage I disease, 20% stage II, 28% stage III, and 50% stage IV disease. Other clinical and demographic parameters are shown in Table 1. There were no significant differences in baseline clinical parameters between patients included in the imaging substudy vs those enrolled only in the parent trial.
Patient characteristics of CALBG50303 parent study vs CALBG 580603 imaging substudy
| Imaging substudy (N = 158) | Parent study only (N = 333) | Total (N = 491) | P | |
|---|---|---|---|---|
| Age (y) | .595 | |||
| Mean (SD) | 55.6 (13.9) | 56.3 (15.1) | 56.1 (14.7) | |
| Q1, Q3 | 48, 66 | 47, 67 | 47, 67 | |
| Range | 20-82 | 18-86 | 18-86 | |
| Sex | .812 | |||
| Female | 71 (44.9%) | 155 (46.5%) | 226 (46%) | |
| Male | 87 (55.1%) | 178 (53.5%) | 265 (54%) | |
| ECOG | .635 | |||
| 0 | 66 (41.8%) | 149 (44.7%) | 215 (43.8%) | |
| 1 | 74 (46.8%) | 141 (42.3%) | 215 (43.8%) | |
| 2 | 18 (11.4%) | 43 (12.9%) | 61 (12.4%) | |
| Extranodal status | .222 | |||
| N-missing | 2 | 2 | 4 | |
| No | 115 (73.7%) | 262 (79.2%) | 377 (77.4%) | |
| Yes | 41 (26.3%) | 69 (20.8%) | 110 (22.6%) | |
| Stage | .913 | |||
| N-missing | 6 | 9 | 15 | |
| Stage I primary mediastinal | 3 (1.97%) | 10 (3.09%) | 13 (2.73%) | |
| Stage II de novo CD20 DLBCL | 31 (20.4%) | 68 (21%) | 99 (20.8%) | |
| Stage III de novo CD20 DLBCL | 42 (27.6%) | 88 (27.2%) | 130 (27.3%) | |
| Stage IV de novo CD20 DLBCL | 76 (50%) | 158 (48.8%) | 234 (49.2%) | |
| IPI | .374 | |||
| N-Missing | 7 | 8 | 15 | |
| Low risk | 46 (30.5%) | 77 (23.7%) | 123 (25.8%) | |
| Low-intermediate risk | 49 (32.5%) | 127 (39.1%) | 176 (37%) | |
| High-intermediate risk | 39 (25.8%) | 82 (25.2%) | 121 (25.4%) | |
| High risk | 17 (11.3%) | 39 (12%) | 56 (11.8%) | |
| Treatment | .569 | |||
| Dose-adjusted etoposide, prednisone, oncovin (vincristine), cyclophosphamide, hydroxydaunorubicin, rituximab | 81 (51.3%) | 160 (48%) | 241 (49.1%) | |
| R-CHOP | 77 (48.7%) | 173 (52%) | 250 (50.9%) |
ECOG, Eastern Cooperative Oncology Group; SD, standard deviation.
Quality control data
For the eligible patients, median plasma glucose before PET scans was 104 mg/dL (range, 68-206). The median FDG uptake time was 62 minutes at baseline (range, 43-117); 62 minutes for i-PET (range, 50-117), and 64 minutes (range, 38-133) for EoT PET. The median difference in uptake time between baseline and interim scans was 1 minute (range, −24 to +42).
Regarding background activity in normal reference regions, the median SUV in liver was 2.2 (range, 0.8-4.1) at baseline, 2.3 (range, 1.2-3.8) at interim, and 2.4 (range, 1.1-4.0) at end of treatment. Median SUV in mediastinal blood pool at baseline was 1.7 (range, 0.5-3.0), at interim 1.7 (range, 0.8-2.9), and at EoT 1.8 (range, 0.8-2.7).
Interobserver agreement for visual analysis was high: the 2 expert readers agreed in their classification as PET-positive vs PET-negative for 98% (κ = 0.96; 95% CI, 0.91-1.0) of interim scans and 97% (κ = 0.91; 95% CI, 0.82-1.0) of EoT scans. Cases with disagreement between the 2 expert readers were classified by the adjudicator as PET-positive (n = 6) and PET-negative (n = 1).
PET imaging findings
Baseline PET findings
All 158 eligible patients had at least 1 site of FDG-positive disease on their baseline scan. Most patients had lymph node involvement, whereas 3 patients showed FDG-positive disease only in the liver, 2 only in lung or pleura, 3 only in the gastrointestinal tract, and 1 only in bone (large lytic lesion). Among the 149 patients with nodal involvement, 32 (21%) also had bone involvement (defined as focal FDG uptake ≥ regional background activity in normal marrow); 29 (19%) had splenic involvement; 15 (10%) had liver involvement; and 17 (11%) had gastrointestinal tract involvement (stomach, small bowel, colon). Median SUV across all disease sites was 16.9, with a range of 2.4 to 77.0. The highest SUV of 77 was recorded in a lytic lesion of the sternum with adjacent chest wall involvement. When considering only the lesion with the highest FDG uptake per scan, the median SUV for these sites was 24.3 (range, 5.9-77; supplemental Figure 1, available on the Blood Web site).
Interim PET findings
After adjudication, residual abnormal FDG uptake was noted by visual scale in 55 (35%) of the 158 interim PET scans (score 4, n = 51; score 5, n = 4). Ninety-four interim scans were classified as negative (scores 1, n = 26; score 2, n = 34; score 3, n = 34). Data were missing for 9 patients (supplemental Table 1). The median SUV across all sites at the time of interim scans was 1.2 (range, 0-18.0). Among sites with scores 1 through 3, median SUV was 0.0 (range, 0-4.9); the highest SUV of 4.9 was noted in a vertebral body and thought to be related to continued remodeling rather than residual disease. Among lesions with scores 4 and 5, median SUV was 6.6 (range, 2.6-18.0). The highest SUV of 18.0 (10% decrease from baseline) was observed in a vertebral body in a patient with widespread disease; additional lesions, in bone and liver, showed a 20% decrease in SUV, whereas chest lymphadenopathy had resolved at interim. Median ΔSUV between baseline and i-PET was 86.0%, with a range from −35% (increasing intensity of abnormal uptake) to 100% (complete resolution of all abnormal uptake). Eighty-nine percent of patients had a ΔSUV ≥66%.
EoT PET findings
A total of 142 EoT PET scans were obtained. Of these, 114 (80%) were considered negative (score 1, n = 71; score 2, n = 24; score 3, n = 19) and 28 (20%) were considered positive (score 4, n = 23; score 5, n = 5). Sixteen scans were not available for analysis (supplemental Table 2). Eighty-three patients with negative i-PET remained negative on EoT PET, and 29 with positive i-PET had a negative EoT PET (supplemental Tables 3-5). The median SUV for all sites and scores 1-3 was 0.0 (range, 0.0-4.4), and for sites with scores 4 and 5, it was 6.8 (range, 2.3-14.7). Median ΔSUV between baseline and EoT PET was 92.9% (range, 6.7-100).
Clinical outcome and survival analysis
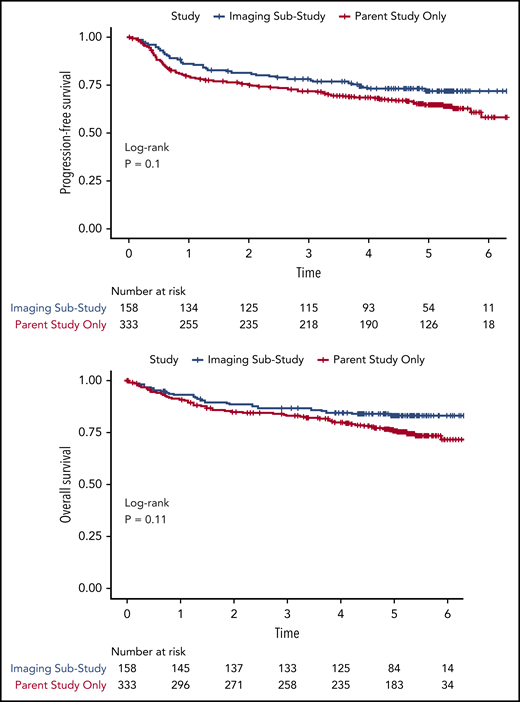
The median follow-up for PFS for the imaging cohort was 5.0 years (95% CI, 4.8-5.2). The 2-year PFS and 2-year OS were 81.5% (95% CI, 75.6-87.8) and 88.0% (95% CI, 83.6-93.6), respectively. PFS and OS for the imaging patient cohort and parent trial only cohort were similar (Figure 2). At the time of analysis, a total of 44 PFS events and 28 OS events were observed.
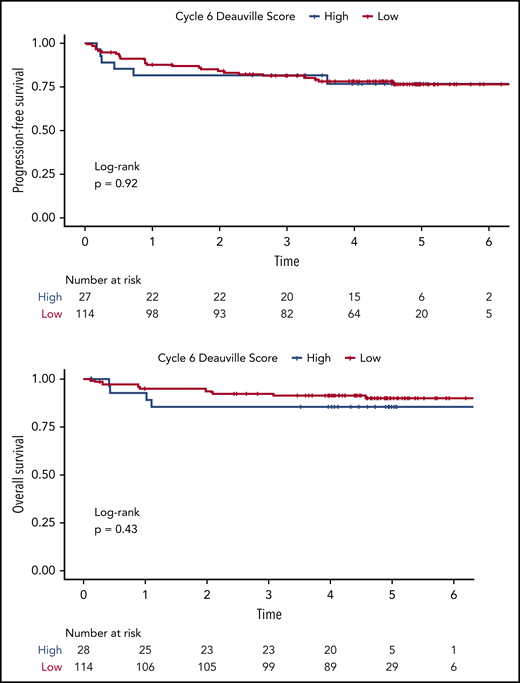
Using visual analysis and the 5-PS, we first analyzed the relationship between patient outcome and imaging findings on i-PET and EoT PET. The 2-year PFS for i-PET-positive vs i-PET-negative patients was 77.9% (95% CI, 67.6-89.7) vs 86.0% (95% CI, 79.3-93.4), respectively. The 2-year OS for i-PET-positive vs i-PET-negative patients was 83.3% (95% CI, 74.0-93.9) vs 94.7% (95% CI, 90.3-99.3). Although the Kaplan-Meier estimates of PFS and OS among patients with interim scores 1 through 3 were numerically higher than among patients with interim scores 4 to 5 (Figure 3), neither difference reached statistical significance (PFS: HR, 0.72; 95% CI, 0.37-1.40; P = .34; OS: HR, 0.70, 95% CI, 0.30-1.66; P = .42). This lack of correlation between i-PET visual score and outcome was similarly observed in both treatment arms. Moreover, we did not observe any significant association between visual EoT-PET findings and patient outcomes (log-rank P = .92; Figure 4).

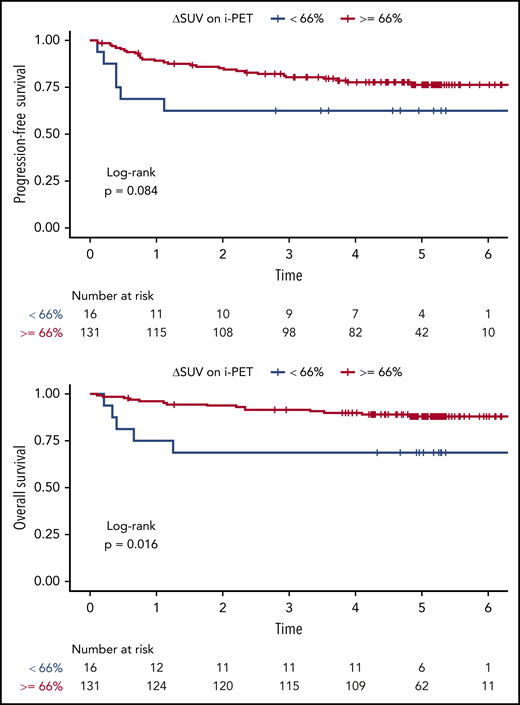
At the time of i-PET, the univariable Cox analysis showed that a greater ΔSUV (continuous variable) was associated with better PFS (HR, 0.99; 95% CI, 0.97-1.00; P = .02) and OS (HR, 0.98; 95% CI, 0.97-0.99; P = .03) (Table 2; supplemental Table 6). The multivariable Cox analysis (adjusting for IPI) suggested similar trends (PFS: HR, 0.99; 95% CI, 0.97-1.00; P = .03; OS: HR, 0.99; 95% CI, 0.97-1.00; P = .08), although the association with OS did not reach statistical significance. We were able to validate the prospectively defined cutoff ΔSUV ≥66% on i-PET for OS (HR, 0.31; 95% CI, 0.11-0.85; P = .02), but not for PFS (HR, 0.47; 95% CI, 0.19-1.13; P = .09). The respective Kaplan-Meier curves are shown in Figure 5. The 2-year PFS for patients with i-PET ΔSUV <66% vs ΔSUV ≥66% was 62.5% (95% CI, 42.8-91.4) vs 85.3% (95% CI, 79.4-91.6), respectively. The 2-year OS for patients with i-PET ΔSUV <66% vs ΔSUV ≥66% were 68.8% (95% CI, 49.4-95.7) vs 93.8% (95% CI, 89.8-98.1).
Cox proportional hazards models of PFS and OS on SUVmax and percent change in SUVmax from baseline
| PFS | OS | |||
|---|---|---|---|---|
| HR (95% CI) | P | HR (95% CI) | P | |
| Univariable Cox PH models | ||||
| Baseline SUVmax | 0.99 (0.97-1.02) | .55 | 0.99 (0.96-1.03) | .75 |
| Cycle 2 SUVmax | 1.08 (1.00-1.16) | .05 | 1.09 (0.99-1.20) | .06 |
| Cycle 6 SUVmax | 1.02 (0.90-1.14) | .79 | 1.06 (0.91-1.22) | .46 |
| Δ2 = (baseline − cycle 2)/baseline × 100% | 0.99 (0.97-1.00) | .02 | 0.98 (0.97-0.99) | .03 |
| Multivariable Cox PH models (adjusting for IPI) | ||||
| Baseline SUVmax | 0.99 (0.96-1.01) | .30 | 0.99 (0.95-1.02) | .46 |
| Cycle 2 SUVmax | 1.06 (0.98-1.14) | .15 | 1.05 (0.96-1.16) | .30 |
| Cycle 6 SUVmax | 0.99 (0.88-1.13) | .96 | 1.03 (0.88-1.22) | .69 |
| Δ2 = (baseline − cycle 2)/baseline × 100% | 0.99 (0.97-1.00) | .03 | 0.99 (0.97-1.00) | .08 |
At the time of EoT PET, a ΔSUV ≥ 66% was associated with better PFS (HR, 0.31; 95% CI, 0.11-0.90; P = .03) as well as OS (HR, 0.22; 95% CI, 0.06-0.80; P = .02) (supplemental Figures 2 and 3).
Discussion
In this prospective, randomized, multicenter trial in patients with newly diagnosed DLBCL, quantitative analysis of i-PET after 2 cycles of chemotherapy using the ΔSUV predicted OS, but not PFS, regardless of the treatment regimen used. These data may be helpful in designing future response-adapted trials in large cell lymphoma.
i-PET is a potential biomarker to predict treatment response and clinical outcome early during chemotherapy, aimed at improving the outcome of patients unlikely to respond to standard chemotherapy through implementation of novel response-adapted treatment strategies. For this aim, it is first necessary to establish the predictive and prognostic power of PET as part of prospective clinical trials; once validated, separate studies can then test alternative treatment regimens in patients with expected poor response to current standard therapy. Ours is 1 of only a few quality-controlled, prospective clinical trials aimed at implementing this strategy by first establishing the utility of i-PET.
Our data are largely concordant with those from 2 other recent large prospective trials.10,20 In the largest study to date (Positron Emission Tomography-Guided Therapy of Aggressive Non-Hodgkin Lymphomas [PETAL]),20 862 patients with a variety of aggressive lymphomas (83% DLBCL) were randomized based on findings on their i-PET after 2 cycles of therapy. Interim PET positivity was also defined as ΔSUV < 66%. With a median follow-up of 44 months in patients with positive i-PET and 55 months in those with negative i-PET, the study showed significant differences in 2-year event-free survival, PFS, and OS. No difference in outcome was seen when i-PETs were categorized by 5-PS (4 and 5 vs 1-3). Relative median ΔSUV in PETAL (81.7%; U. Duehrsen, e-mail, 23 February 2019) and in our study (86.2%), as well as the fraction of positive i-PET when using ΔSUV 66% (12.5% and 10%) and overall patient demographics and risk appeared quite similar in the 2 trials. However, the fraction of patients with advanced stage (III/IV) disease was higher in the present study (77%) than in PETAL (60%). Both 2-year PFS and OS were slightly higher in the current study than among R-CHOP-treated patients in PETAL, although relative differences in outcome between the 2 prognostic groups were quite similar.
In the second randomized study, Casasnovas et al10 assessed the utility of i-PET initially in 113 younger patients with high-risk DLBCL. Upfront treatment consisted of R-CHOP-14 (49%) or R-ACVBP-14 (51%). Depending on the findings on i-PET-2 and i-PET-4, patients were directed to 1 of 4 different treatment strategies. With a median follow-up of 19 months, visual assessment of i-PET-2 using IHP criteria or the 5-PS also did not predict patient outcome. In contrast, quantitative assessment using a ΔSUV cut-point of 66% clearly separated 2 prognostic groups. Long-term follow-up data were recently published for the expanded cohort of 222 patients,21 confirming the predictive power of ΔSUV (4-year PFS 56% vs 80%, P < .01; and 4-year OS 69% vs 87%, P = .03 for ΔSUV <66% vs ≥66%). As pointed out previously, our study showed a significant association between ΔSUV and patient outcome regarding both PFS and OS, but the prespecified ΔSUV 66% cutoff was predictive only of OS but not PFS (P = .09). It is conceivable that the latter lack of statistical significance may be attributed to the lower than expected number of events in both the parent clinical trial and our imaging substudy.
Similar to the 2 aforementioned trials, visual PET analysis using the 5-PS5,7 was not predictive of patient outcome in our study, contradicting prior publications.9,10,18,20,22-24 Notably, our results contradict findings in the Swiss SAKK 38/07 prospective study by Mamot et al,9 showing that 5-PS on i-PET, but not ΔSUV66%, predicted outcome, with 2-year event-free survival of 41% vs 75% (P < .001) by 5-PS and central review as compared with 42% vs 61% (P = NS) when using ΔSUV66%. Conceivably, the higher fraction of patients with more advanced disease in our study (stage III/IV: 78% vs 53% in SAKK 38/07; high or high-intermediate IPI: 37% vs 28%) contributed to these discrepancies. However, some other recent large studies using modern PET technology and updated i-PET interpretation criteria have also cast doubt on the utility of i-PET by visual analysis alone.9,23 It is generally acknowledged that quantitative analysis using ΔSUV improves interobserver agreement and reproducibility of scan interpretation, at least when scans are interpreted by non-experts. Measuring SUV is part of routine scan interpretation and easily standardized for routine clinical practice.25
The lack of predictive accuracy of the 5-PS at EoT was surprising. This may have been affected by false-positive findings in patients with initially large soft-tissue masses or soft-tissue organ (bowel, spleen, lung) or frank bone involvement (supplemental Table 3). Residual FDG uptake at EoT with scores ≥4 in some of these cases may have been due to inflammation or bone remodelling. In practice, treatment decisions should not be made on such EoT scans with scores ≥4 in isolation. Experienced PET readers, aware of the potential for false-positive EoT scans, will often recommend a follow-up scan about 2 months later or, rarely, a biopsy for verification.
Compared with previous studies, our patient population was more homogeneous, with all patients diagnosed with DLBCL. By visual analysis, our fraction of i-PET-positive scans (35%) was at the lower end of a range of findings in similar studies (33%-54%).18,20,23,26,27 Lower fractions of positive i-PET-2 are generally seen when quantitative rather than visual analysis is applied, and this was also noted in our trial: using ΔSUV <66%, we observed an i-PET-2 positivity rate of 11%, again at the lower end of a spectrum ranging from 12% to 22% in prior studies.10,18,20 Median ΔSUV in our study was 86%, higher than the 70% to 75% reported by others,18,23 albeit similar to the 82% in the PETAL study. These prior studies may have enrolled patients with more aggressive disease, as evidenced by higher fractions of patients with stage III/IV disease and higher IPI scores than in the current trial.
Legitimate questions have been raised about the potential clinical utility of i-PET in diffuse large cell lymphoma. Many earlier studies included patients scanned with PET-alone technique; PET/CT improves reader confidence and accuracy in scan interpretation.28 Further heterogeneity within and across studies relates to patient inclusion criteria (DLBCL only vs a variety of aggressive lymphomas), as well as the use of variable time points for i-PET, different induction chemotherapy regimens, adjuvant radiotherapy (in 16% to 34% of patients),9,23,26,27,29 and the choice of variable clinical endpoints. With evolving criteria for the visual interpretation of i-PET,2,7,8 the fraction of positive i-PETs has decreased over time, likely reflecting fewer false-positive scans.9,10 Finally, most of the frequently cited studies are retrospective analyses30 that sometimes rely on scan interpretations by local readers, whereas interobserver agreement is generally better among expert readers, when studies are reviewed centrally.31 Indeed, our analysis showed near-perfect agreement between the 2 primary expert readers.
Many of the limitations hampering prior retrospective analyses may be overcome through rigorous and prospective trial design, as proven in our study and PETAL. Moreover, given the 5-year PFS and OS rates of 54% and 58% in high-risk and older patients with the current standard R-CHOP regimen,32,33 there is a clear need to identify patients likely to fail therapy and to develop novel drug regimens that improve the clinical outcome for this disease. Concordant with other recent larger studies, we have shown that clinical outcome can be predicted, albeit only when applying ΔSUV analysis. Thus, it is now critical to identify effective alternative regimens to improve the outcome for patients likely to progress despite initial therapy. To date, no study has shown that changing treatment after i-PET in DLBCL improves survival. Most recently, the PETAL study failed in its effort to improve outcome for patients with positive i-PET by using a Burkitt-like regimen. Further efforts using current standard chemotherapy drugs may also prove futile. However, novel and tentatively more effective approaches, such as CAR T-cell therapies, bispecific antibodies, and other targeted approaches may successfully overcome treatment resistance among i-PET-positive patients.34-36
Our study had some limitations. First, strictly speaking, our results may only be generalized to patients who satisfied trial eligibility criteria, participated in this imaging substudy, and stayed on study for clinical and imaging follow-up. Second, the sample size for the imaging substudy was considerably smaller than for the parent study12 because participation in the imaging component was not mandatory for patients enrolled in the clinical trial, thereby limiting statistical analysis. For this reason and because patient outcome was not affected by the treatment regimen in the parent clinical trial,12 we performed combined analysis for all patients. Third, i-PET or EoT PET data were missing for a few patients. We appropriately used landmark analysis by calculating the time-to-event outcomes from the respective imaging dates. This analytical approach provides an unbiased estimate to the prognostic value of i-PET. Fourth, the better than expected outcome among patients in the parent trial,12 similar to our imaging substudy, makes it conceivable that patients at highest risk or unable to undergo the prescribed regimens were not enrolled in the trial because they may have required immediate treatment, hence decreasing the event rate on this study. The power of a study with a time-to-event outcome depends on the number of observed events.37,38 Limited sample size and fewer than expected events during follow-up in our imaging substudy may have contributed to a lack of statistical power to detect any predictive value of i-PET analyzed by 5-PS. However, superior predictive power of quantitative i-PET analysis was similarly noted in 2 other large prospective trials.20,21 Nevertheless, although the risk for relapse and death is lower among patients with (in some studies) negative i-PET and those with ΔSUV ≥66% on i-PET, it remains true that most relapses occur in these groups simply because most patients are found to have negative i-PETs. Consequently, in the larger clinical context of DLBCL, there is a growing interest in identifying prognostic and predictive factors beyond i-PET, including, for instance, other imaging parameters such as PET of the total metabolic tumor volume,23,39 genomic analysis,40 studies of the tumor microenvironment,40 or studies of circulating tumor DNA as early predictors of outcome.41 It is likely that a combination of clinical, imaging, and cellular/genomic markers will ultimately improve the prediction of outcomes and treatment selection among patients with large cell lymphoma.
In summary, quantitative analysis of i-PET using ΔSUV predicted OS but not PFS of patients with DLBCL in this prospective study. In concordance with other large prospective trials, this supports the notion that ΔSUV may be a biomarker of response and a suitable criterion for designing prospective clinical trials with PET response-adapted therapy in patients with DLBCL.
The online version of this article contains a data supplement.
The publication costs of this article were defrayed in part by page charge payment. Therefore, and solely to indicate this fact, this article is hereby marked “advertisement” in accordance with 18 USC section 1734.
Deidentified individual participant data underlying the reported results are currently being shared with the PET Re-analysis (petralymphoma.org) consortium. Future requests for data sharing should be addressed to the corresponding or senior author of this work.
Acknowledgments
The content is solely the responsibility of the authors and does not necessarily represent the official views of the National Institutes of Health.
Research reported in this publication was supported by the National Institutes of Health, National Cancer Institute (U10CA180821, U10CA180882) to the Alliance for Clinical Trials in Oncology and U10CA180791, U10CA180833, U10CA180850, and UG1CA189960 (https://acknowledgments.alliancefound.org). Scientific and financial support for the Foundation for the National Institutes of Health (FNIH) Biomarkers Consortium project “FDG-PET in Lymphoma” and the current study were made possible through funding to the FNIH by Amgen, AstraZeneca, Bristol-Myers Squibb, GlaxoSmithKline, Johnson & Johnson, Leukemia & Lymphoma Society, Merck, Pfizer, and Wyeth (HHSN261200800001E). This research was also funded in part through a National Institutes of Health National Cancer Institute Cancer Center Support Grant (P30 CA008748).
Authorship
Contribution: H.S. designed and performed research, analyzed and interpreted data, and wrote the manuscript; M.-Y.C.P. performed statistical analysis and wrote the manuscript; M.V.K. designed and performed research, contributed vital new reagents or analytical tools, collected data, analyzed and interpreted data, and reviewed, edited, and approved the manuscript; N.H. performed research, analyzed and interpreted data, and reviewed, edited, and approved the manuscript; J.Z. contributed vital new reagents or analytical tools, collected data, and reviewed, edited, and approved the manuscript; H.R.H. analyzed and interpreted data, and reviewed, edited, and approved the manuscript; G.K. analyzed and interpreted data, and reviewed, edited, and approved the manuscript; H.L. performed statistical analysis and reviewed, edited, and approved the manuscript; A.D.Z. designed the research and reviewed, edited, and approved the manuscript; W.H.W. designed the research and reviewed, edited, and approved the manuscript; N.L.B. designed the research, analyzed and interpreted data, and wrote the manuscript; and L.K., B.D.C., N.W.-J., B.S.K., J.W.F., E.D.H., J.P.L., and L.S. reviewed, edited, and approved the manuscript.
Conflict-of-interest disclosure: H.S. was a consultant to Aileron Therapeutics until June 30, 2018 (unrelated to current work). A.D.Z. serves or has served as a consultant for Genentech/Roche, Gilead, Celgene, Janssen, Amgen, Novartis, Adaptive Biotechnology, and Verastem; he serves on the advisory board of MorphoSys, Gilead, Genentech, Abbvie, and AstraZeneca Pharmacyclics and receives research support from MEI Pharmaceuticals, Roche, Gilead, and Beigene; he also serves as the DMC Chair for Beigene. N.W.-J. serves or has served on the advisory boards for Bayer, Gilead, ADC Therapeutics, and Janssen. B.K. serves as a consultant for Genentech and Roche, and receives research funding from Genentech. J.F. has received honoraria from Bayer and Ascerta for data and safety monitoring committee activities. E.H. receives research support from Eli Lilly & Co. and Abbvie and serves on the honoraria advisory boards of Seattle Genetics, Celgene, and Jazz Pharmaceuticals. J.P.L. serves or has served as a consultant for Sutro, Bayer, Gilead, AstraZeneca, Celgene, Roche/Genentech, ADC Therapeutics, Sandoz, Karyopharm, Miltenyi, Novartis, Biotest, Merck, Morphosys, Beigene, Nordic Nanovector, BMS, Akcea Therapeutics, Epizyme, and MEI Pharma. L.H.S. has received third-party payments from Merck, Roche, and Pfizer for participating on data safety monitoring and endpoint committees and has served as a consultant for Boehringer and Imaging Endpoints. The remaining authors declare no competing financial interests.
Correspondence: Heiko Schöder, Molecular Imaging and Therapy Service, Memorial Sloan Kettering Cancer Center, 1275 York Ave, S-212, New York, NY 10065; e-mail: schoderh@mskcc.org.

This feature is available to Subscribers Only
Sign In or Create an Account Close Modal