

TO THE EDITOR:
Cytotoxic therapy has been associated with both clonal hematopoiesis (CH) and therapy-related leukemia,1-3 and mutations in DNA repair genes such as TP53 and PPM1D are strongly associated with prior chemotherapy exposure.1,4,5 However, data on the origin and longitudinal dynamics of CH during and after chemotherapy are sparse and only exist for smaller, heterogeneous patient cohorts.6-12 Therefore, in this study, we analyzed the development and evolution of CH in a homogeneous cohort of mantle cell lymphoma (MCL) patients before, during, and after first-line chemotherapy, autologous stem cell transplantation (ASCT), and long-term follow-up after end of therapy.
We investigated 335 DNA samples from 149 patients treated in 2 Nordic Lymphoma Group front-line trials for younger patients (age <66 years) with MCL; MCL2 and MCL3. Both trials consisted of an induction phase of immunochemotherapy followed by consolidation with high-dose chemotherapy (HDT) and ASCT.13,14 All patients provided written consent, and the study was approved by local ethics committees and conducted in accordance with the Declaration of Helsinki. For initial screening, minimal residual disease (MRD)-negative DNA samples from bone marrow and peripheral blood were collected according to availability (Figure 1A). In patients with detected CH in a screening sample, additional follow-up samples from time points before, during, and after therapy were collected regardless of MRD status (Figure 2A). All samples underwent error-corrected NGS of 21 CH-related genes (supplemental Tables 1 and 2, available on the Blood Web site) and general variant calling with a VAF cutoff of 1.0%. Next, consecutive samples from CH+ patients underwent focused variant calling to identify specific low-frequency mutations already detected in other samples from the same patients (supplemental Methods).
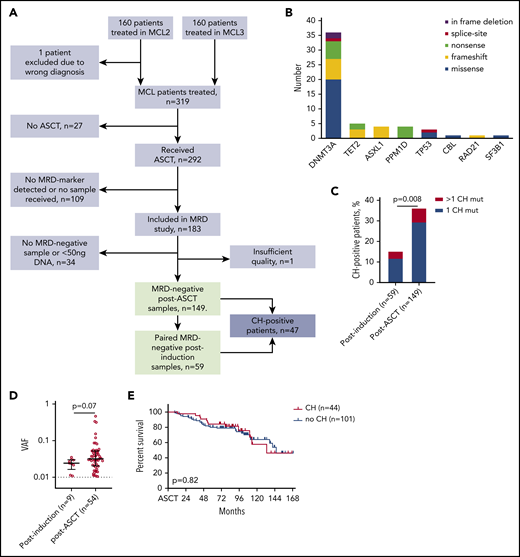
CH mutations detected in the MRD−samples of 149 patients. (A) Flowchart of study patients. (B) Landscape of CH mutations in 149 MRD− post-ASCT samples. (C) Prevalence of CH mutations in MRD− samples from postinduction (n = 59) and post-ASCT (n = 149) time points. Statistics by χ2 test. (D) Variant allele frequency (VAF) of 9 postinduction CH mutations and 54 post-ASCT CH mutations. Analyzed by Mann-Whitney U test. (E) Overall survival of patients with and without CH mutations at post-ASCT time point, compared by log-rank test.
CH mutations detected in the MRD−samples of 149 patients. (A) Flowchart of study patients. (B) Landscape of CH mutations in 149 MRD− post-ASCT samples. (C) Prevalence of CH mutations in MRD− samples from postinduction (n = 59) and post-ASCT (n = 149) time points. Statistics by χ2 test. (D) Variant allele frequency (VAF) of 9 postinduction CH mutations and 54 post-ASCT CH mutations. Analyzed by Mann-Whitney U test. (E) Overall survival of patients with and without CH mutations at post-ASCT time point, compared by log-rank test.
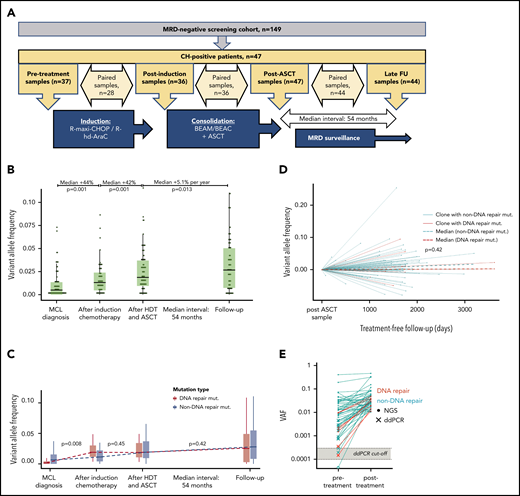
Longitudinal investigation of CH mutations in 47 patients. (A) Overview of samples for longitudinal investigation. (B) Evolution of CH mutation at the 4 time points. Black horizontal lines represent medians; boxes, interquartile ranges (IQRs); and vertical lines, 1.5 × IQRs. Percentages at the top indicate the relative change in VAF size of the CH mutations in paired samples. P values were calculated by Wilcoxon rank sum test for paired samples. (C) Evolution of DNA repair mutations (red) and non-DNA repair mutations (turquoise) at the 4 time points. Black horizontal lines indicate medians; boxes, IQRs; and vertical lines, 1.5 × IQRs. P values indicate the differences in VAF change between the 2 groups (for paired samples only) by Mann-Whitney U test. (D) Evolution of DNA repair (red) and non-DNA repair (turquoise) mutations during chemotherapy-free follow-up. P values indicate the comparison of the coefficients of the 2 linear regression models for the DNA repair and non-DNA repair VAFs, respectively. (E) Illustrates the presence of posttreatment CH mutations at the time point before any chemotherapy was administered. Closed circles represent mutations detected by next-generation sequencing (NGS); Xs, mutations detected by droplet digital polymerase chain reaction (ddPCR); and the open circle, the 1 undetected mutation. Gray area represents the range of detection limits for the ddPCR assays; red, DNA repair mutations; turquoise, non-DNA repair mutations. BEAC, carmustine, etoposide, cytarabine, and cyclophosphamide; BEAM, carmustine, etoposide, cytarabine, and melphalan; FU, follow-up; R hd AraC, rituximab plus high-dose cytarabine; R-maxi-CHOP, rituximab, cyclophosphamide (1200 mg/m2), doxorubicin (75 mg/m2), vincristine (2 mg), prednisolone (100 mg) day 1-5.
Longitudinal investigation of CH mutations in 47 patients. (A) Overview of samples for longitudinal investigation. (B) Evolution of CH mutation at the 4 time points. Black horizontal lines represent medians; boxes, interquartile ranges (IQRs); and vertical lines, 1.5 × IQRs. Percentages at the top indicate the relative change in VAF size of the CH mutations in paired samples. P values were calculated by Wilcoxon rank sum test for paired samples. (C) Evolution of DNA repair mutations (red) and non-DNA repair mutations (turquoise) at the 4 time points. Black horizontal lines indicate medians; boxes, IQRs; and vertical lines, 1.5 × IQRs. P values indicate the differences in VAF change between the 2 groups (for paired samples only) by Mann-Whitney U test. (D) Evolution of DNA repair (red) and non-DNA repair (turquoise) mutations during chemotherapy-free follow-up. P values indicate the comparison of the coefficients of the 2 linear regression models for the DNA repair and non-DNA repair VAFs, respectively. (E) Illustrates the presence of posttreatment CH mutations at the time point before any chemotherapy was administered. Closed circles represent mutations detected by next-generation sequencing (NGS); Xs, mutations detected by droplet digital polymerase chain reaction (ddPCR); and the open circle, the 1 undetected mutation. Gray area represents the range of detection limits for the ddPCR assays; red, DNA repair mutations; turquoise, non-DNA repair mutations. BEAC, carmustine, etoposide, cytarabine, and cyclophosphamide; BEAM, carmustine, etoposide, cytarabine, and melphalan; FU, follow-up; R hd AraC, rituximab plus high-dose cytarabine; R-maxi-CHOP, rituximab, cyclophosphamide (1200 mg/m2), doxorubicin (75 mg/m2), vincristine (2 mg), prednisolone (100 mg) day 1-5.
We identified 149 cases with MRD− bone marrow (n = 134) or peripheral blood (n = 15) samples after HDT-ASCT (Figure 1A). By NGS, we identified 54 CH mutations in 44 (30%) of these samples, with a median VAF of 3.2% (Figure 1B; supplemental Tables 3 and 4). Both prevalence (12%) and clone size (median VAF, 2.4%) were lower in 59 paired MRD− postinduction samples taken between induction-therapy and HDT-ASCT, indicating a CH-promoting effect of HDT-ASCT (Figure 1C-D). We observed no differences in baseline characteristics between patients with and without CH (supplemental Table 5). Mutations in DNA repair genes (PPM1D, n = 4; TP53, n = 3; RAD21, n = 1; and BRCC3, n = 0) were present in only 8 patients (5.4%), fewer than in previous reports.1,5 We suspect this reflects the lower cumulative dose of chemotherapy received in our cohort of first-line–treated patients compared with the heterogeneous cohort of more heavily pretreated patients published by Gibson et al1 (median, 2 prior lines of therapy; range, 1-6 prior lines).
With a median follow-up of 8.0 years from ASCT, median overall survival was not influenced by CH (hazard ratio, 0.92; 95% confidence interval, 0.48-1.8; log-rank P = .82; Figure 1E). Increasing the VAF cutoff for CH mutations to 2% or 10% did not alter this result (data not shown). Only 4 patients developed TMN disease, with a median time from post-ASCT sample to TMN diagnosis of 30 months (range, 18-42 months), and only 1 of these patients carried a CH mutation in the post-ASCT screening sample (DNMT3A P904L; VAF, 1.9%). Of note, compared with the similar study by Gibson et al,1 in which CH clearly showed poor prognostic impact at time of ASCT, our cohort represented relatively good-risk MCL patients (MRD negativity after ASCT) who all received ASCT in the first line.
Forty-seven patients carried a CH mutation in an MRD− sample at either the postinduction or post-ASCT time point. In these patients, a total of 77 CH mutations were tracked in the consecutive samples (Figure 2A-B). Comparing 28 paired samples before and after induction chemotherapy, 9 new CH mutations appeared, whereas no mutations disappeared. Of 39 mutations detected at both time points, the median VAF increased from 0.97% (IQR, 0.38%-2.6%) to 1.6% (IQR, 0.90%-3.3%; Wilcoxon P = .001), corresponding to a median relative VAF increase of 44% (IQR, −0.88%-230%; Figure 2B). Similarly, comparing 36 postinduction and post-ASCT samples, 3 mutations appeared and 2 disappeared, and the median VAF of 53 shared mutations increased from 1.5% (IQR, 0.91%-3.1%) to 2.8% (IQR, 1.4%-4.8%; P = .001), corresponding to a median relative VAF increase of 42% (IQR, −8.0%-157%; Figure 2B).
During induction therapy, the median increment of clones with DNA repair mutations was significantly greater than CH with non-DNA repair mutations (+1.7; IQR, 1.1-3.3 vs +0.48; IQR, 0.008-1.4; Mann-Whitney P = .008; Figure 2C; supplemental Figures 1, 3, and 4). In contrast, during HDT-ASCT, expansion of clones with DNA repair mutations was less pronounced and similar to that of clones with non-DNA repair mutations (Figure 2C; supplemental Figures 2-4).
We hypothesized that mutations with relatively more COSMIC references for myeloid malignancies were more likely to represent CH drivers. Mutations with ≥3 COSMIC references compared with <3, respectively, showed a significantly larger increase during HDT-ASCT (+1.4; IQR, 0.61-2.1 vs +0.20; IQR −0.55-1.4; P = .029; supplemental Figure 4D). This may represent either an increased resistance to HDT or faster engraftment after ASCT.
During follow-up of 44 CH+ patients after end of therapy, 6 new mutations appeared and 6 disappeared. The median interval from post-ASCT to late follow-up sample was 54 months (IQR, 42-57 months). The median VAF of the remaining 62 mutations continued to increase (from 2.9% [IQR, 1.4%-4.7%] to 3.8% [IQR, 1.6%-6.6%]; P = .013), but the median growth rate was only 5.1% per year (IQR, −9%-55%), which is likely to reflect an age-related increment (Figure 2D).
Clones carrying DNA repair mutations or mutations with a higher number of COSMIC references did not behave differently after end of therapy (Figure 2C; supplemental Figure 4). However, we observed an overall negative correlation between VAF change during treatment and VAF change during chemotherapy-free follow-up (Spearman’s ρ = −0.32; 95% CI, −0.53 to −0.064; P = .013), suggesting that clones expanding during chemotherapy tend to diminish after end of therapy, possibly because of withdrawal of the selective pressure of chemotherapy (supplemental Figure 5). Fifteen mutations expanded both during treatment and follow-up: 10 DNMT3A mutations (including 3 at the 882 codon), 3 PPM1D mutations, and 2 TET2 mutations. With a median follow-up of 7.7 years (IQR, 6.8-8.8 years), of these 15 patients, none developed TMN disease. We did not find any association between posttreatment behavior of CH clones and VAF size or number of mutations per patient.
To explore the origin of the chemotherapy-associated CH, we investigated the presence of CH clones before exposure to chemotherapy. Selecting all mutations with VAF >1% in postinduction or post-ASCT samples, 42 (78%) of 54 mutations were detectable by NGS in pretreatment samples. Importantly, exploring the remaining 12 mutations, which were not found by NGS, by sensitive ddPCR, we were able to detect 11 additional mutations. Therefore, taken together, 53 (98%) of 54 posttreatment CH mutations were already detectable before exposure to any chemotherapy (Figure 2E). The undetected mutation (ASXL1 p.A627fs) occurred a patient who also carried 2 other CH mutations (ASXL1 p.Arg774fs and DNMT3A p.Arg598*). Whether this mutation was in fact induced by chemotherapy or was present at VAF below the detection limit of the ddPCR assay (0.018%) remains unknown (supplemental Table 6). Similarly, we also investigated mutations that seemed to disappear during chemotherapy-free follow-up. By ddPCR, we were able to detect 5 of 6 mutations at a low VAF in the late follow-up samples (supplemental Table 4). Therefore, in total, 66 (99%) of 67 post-ASCT mutations remained detectable during follow-up after end of therapy.
Several previous studies have demonstrated cases where post-chemotherapy CH mutations could be tracked back to a prechemotherapy time point.3,6,8-12,15-17 We here confirm in a large cohort of chemotherapy-naïve patients that nearly all (98%) post-chemotherapy CH mutations could be detected before any treatment was administered, which suggests that CH clones are always expanded, and not induced, by chemotherapy (supplemental Figure 6).
In conclusion, we show for the first time in MRD− samples from a large, homogeneously treated cohort that CH clones, especially those carrying DNA repair mutations, expand consistently during chemotherapy and HDT-ASCT, whereas CH clones generally stabilize after end of therapy. We found no clinical impact of CH in our cohort of relatively good-risk MCL patients treated in the first-line setting, and thus, our data do not support using CH as a biomarker for choice of treatment in patients undergoing first-line intensive chemotherapy and ASCT. Interestingly, 54 of 55 postchemotherapy CH mutations were already detectable before any chemotherapy was administered. This provides support for a model with expansion of preexisting clones, in a permissive microenvironment, rather than induction of new clones by chemotherapy (supplemental Figure 6).
For original data, please e-mail the corresponding author.
The online version of this article contains a data supplement.
Acknowledgments
The authors thank the medical and nursing staffs of all contributing departments of the MCL2 and MCL3 trials and the patients for their willingness to participate.
This work was supported by grants from the Independent Research Fund Denmark, Novo Nordisk Foundation, Rigshospitalet’s Research Foundation, Lundbeck Foundation, and Danish Cancer Research Foundation. Furthermore, the K.G. laboratory is funded by center grants from the Danish Cancer Society (Danish Research Center for Precision Medicine in Blood Cancer grant 223-A13071-18-S68), the Novo Nordisk Foundation (Novo Nordisk Foundation Center for Stem Cell Biology, DanStem, grant NNF17CC0027852), and the Greater Copenhagen Health Science Partners (Clinical Academic Group in Translational Hematology).
Authorship
Contribution: C.W.E., S.H., K.G., and J.W. conceived and designed the experiments; C.W.E., S.H., F.F., F.G.R.-G., and L.B.P. performed the experiments; C.W.E., S.H., F.F., and T.W.K. analyzed data; M.J., C.H.G., A.K., and R.K.R. conducted the clinical trials, handled patient material, and collected clinical data; C.W.E., S.H., K.G., and J.W. wrote the manuscript; and all authors critically reviewed the final version of the manuscript.
Conflict-of-interest disclosure: The authors declare no competing financial interests.
Correspondence: Kirsten Grønbæk, Department of Hematology, Rigshospitalet, Copenhagen, Denmark; e-mail: kirsten.groenbaek@regionh.dk.

This feature is available to Subscribers Only
Sign In or Create an Account Close Modal