

Key Points
DLBCL cell lines exhibit chronic NFAT activation, which is independent of B-cell receptor-mediated signals.
Long-term treatment of ABC DLBCL with calcineurin inhibitors induces cytotoxicity and synergizes with BCL-2 and MCL-1 inhibition.

Abstract
Diffuse large B-cell lymphoma (DLBCL) represents the most common adult lymphoma and can be divided into 2 major molecular subtypes: the germinal center B-cell-like and the aggressive activated B-cell-like (ABC) DLBCL. Previous studies suggested that chronic B-cell receptor signaling and increased NF-κB activation contribute to ABC DLBCL survival. Here we show that the activity of the transcription factor NFAT is chronically elevated in both DLBCL subtypes. Surprisingly, NFAT activation is independent of B-cell receptor signaling, but mediated by an increased calcium flux and calcineurin-mediated dephosphorylation of NFAT. Intriguingly, although NFAT is activated in both DLBCL subtypes, long-term calcineurin inhibition with cyclosporin A or FK506, both clinically approved drugs, triggers potent cytotoxicity specifically in ABC DLBCL cells. The antitumor effects of calcineurin inhibitors are associated with the reduced expression of c-Jun, interleukin-6, and interleukin-10, which were identified as NFAT target genes that are particularly important for the survival of ABC DLBCL. Furthermore, calcineurin blockade synergized with BCL-2 and MCL-1 inhibitors in killing ABC DLBCL cells. Collectively, these findings identify constitutive NFAT signaling as a crucial functional driver of ABC DLBCL and highlight calcineurin inhibition as a novel strategy for the treatment of this aggressive lymphoma subtype.
Introduction
Diffuse large B-cell lymphoma (DLBCL) is the most common type of malignant lymphoma in adults and represents a heterogeneous entity with respect to morphology, biology, and clinical presentation.1,2 Roughly 65% of affected patients can be cured by cyclophosphamide, doxorubicin hydrochloride, vincristine sulfate, and prednisone chemotherapy combined with the anti-CD20 antibody rituximab. However, in the remaining cases, either no response to first-line therapy or relapse after an initial response are documented and associated with adverse prognosis.3 Gene expression profiling of DLBCL allows the discrimination of 2 major subtypes, termed activated B-cell-like (ABC) and germinal center B-cell-like (GCB) DLBCL.4-7 GCB DLBCLs frequently carry alterations in tumor suppressor genes, such as PTEN, ING1, or TP53, and tonic B-cell receptor (BCR) signaling promotes cell survival.8,9 In contrast, constitutive activation of the transcription factor NF-κB driven by different mutations in genes encoding regulators of immune receptor signaling is a hallmark of the ABC DLBCL subgroup.10-12 Chronic BCR signaling caused by either self-antigens or abnormal expression of key components of the BCR pathway, such as CD79, CARD11, or A20, activates NF-κB and thus promotes the outgrowth of ABC DLBCL.10,11,13-15 However, therapeutic intervention in humans is challenging because of the high toxicity of pan-NF-κB inhibitors.
Recently, it became evident that not only NF-κB, but also transcription factors of the activator protein-1 (AP-1) family are deregulated in ABC DLBCL.16,17 Members of the Jun, Fos, ATF, and MAF families form various hetero- and homodimeric AP-1 complexes regulating genes essential for cell growth, differentiation, and survival.16,18,19 Furthermore, the Jun family was shown to be important for the interaction of the DLBCL cells with the microenvironment and associated with in vivo lymphoma dissemination.20
Besides NF-κB and AP-1, the transcription factor NFAT has been implicated in DLBCL pathogenesis.21-25 Four of 5 NFAT proteins (NFATc1-4) are activated by calcium and calcineurin, whereas the activity of NFAT5 is induced by osmotic stress.26,27 Several kinases can phosphorylate NFAT, including GSK3, CK1, and DYRK1/2, thus keeping the transcription factor in an inactive state. Dephosphorylation of several amino acid residues in the N terminus of NFAT by the phosphatase calcineurin exposes its nuclear localization sequence, leading to the nuclear translocation of NFAT and target gene expression. Calcineurin itself is activated by calcium through binding to the calcium-sensor calmodulin.27 Calcium mobilization can be induced by antigen receptors, which promote the activation of phospholipase Cγ leading to inositol 1,4,5-trisphosphate production.27 Inositol 1,4,5-trisphosphate induces the release of calcium from endoplasmic reticulum stores, which is recognized by stromal interaction molecule. Upon interaction with ORAI proteins, stromal interaction molecule stimulates the permeability of the calcium release-activated channel in the plasma membrane, a process referred to as store-operated calcium entry.27
In this study, we demonstrate a constitutive NFAT activation in DLBCL cells. Long-term inhibition of calcineurin by cyclosporin A or FK506 was selectively cytotoxic for ABC but not for GCB DLBCLs. Calcineurin blockade further synergized with BCL-2 and MCL-1 inhibitors in killing ABC DLBCL cells, suggesting inhibition of the NFAT-calcineurin axis as a novel strategy for the treatment of ABC DLBCL.
Material and methods
Cell culture, lentiviral and retroviral transduction, survival assay
Protocols are available in the supplemental Materials and methods, available on the Blood Web site.
Antibodies
Immunoblot protocols and a list of primary antibodies are available in the supplemental Materials and methods.
ELISA
Secreted interleukin-6 (IL-6) and IL-10 were quantified using human IL-6 and IL-10 Ready-SET-Go enzyme-linked immunosorbent assay (ELISA) kits (eBioscience).
Gene expression profiling, gene set enrichment analysis, and dual luciferase reporter assay
Protocols are available in the supplemental Materials and methods.
Cell death analysis, calcium measurement and quenching assay, quantitative polymerase chain reaction, adhesion assay, and nuclear fractionation
Protocols are available in the supplemental Materials and methods.
DNA-binding of NFAT (TransAM)
NFATc1 TransAM (ActiveMotif) was performed according to the manufacturer’s protocol after incubation with the indicated inhibitors for 24 hours.
Xenograft mouse model, zebrafish husbandry, and yolk sac transplantation
Protocols are available in the supplemental Materials and methods.
Results
Treatment with calcineurin inhibitors induces selective cytotoxicity in ABC DLBCL
To investigate whether calcineurin activity is important for the survival of DLBCL, we treated cell lines of the ABC or GCB subtypes with the calcineurin inhibitors cyclosporin A (CsA) or tacrolimus (FK506) for 12 days. Intriguingly, cell numbers were markedly decreased in several ABC DLBCL cell lines (Figure 1A), whereas all GCB DLBCLs tested exhibited unimpaired growth in the presence of calcineurin inhibitors (Figure 1B). This differential response of the DLBCL subtypes to calcineurin inhibition did apparently not correlate to the levels of calcineurin protein expression (supplemental Figure 1). The largest decrease in cell numbers in ABC DLBCL models occurred between days 4 and 6 after initiation of treatment with the calcineurin inhibitors (Figure 1A), which is slower than reported effects of small-molecule inhibitors targeting BCR or NF-κB signaling or other cytotoxic drugs. This delayed cytotoxicity might be reason why calcineurin inhibitors have so far not been reported as antiproliferative agents in ABC DLBCL. Calcineurin inhibition also led to increased numbers of annexin V-positive cells and elevated caspase activity in various ABC DLBCL cell lines, but not in the GCB DLBCL models HT and BJAB (Figure 1C-D), indicating that calcineurin inhibition induced apoptotic cell death of ABC DLBCL. Mantle cell lymphoma (MCL) also depend on BCR signaling for their survival.28 Therefore, we next tested the influence of calcineurin inhibition on the growth of various MCL cell lines. Neither the MCL cell lines depending on canonical (Mino, Rec-1) nor those relying on alternative (JVM2, Z138) NF-κB signaling showed any sensitivity toward CsA (Figure 1E). Thus, sensitivity toward calcineurin inhibition is unique for ABC DLBCL.
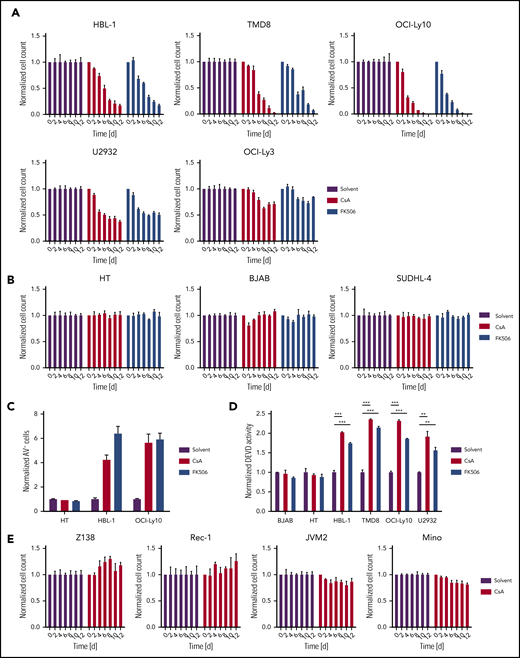
Calcineurin inhibition triggers cytotoxicity in ABC DLBCL. (A) ABC DLBCL or (B) GCB DLBCL cells lines were treated with DMSO, 300 nM CsA, or 300 nM FK506, and cell numbers were counted every second day as indicated. (C) Annexin V-positive cells were measured by flow cytometry after 4 days of DMSO, CsA, or FK506 treatment. (D) GCB (BJAB and HT) and ABC (HBL-1, TMD8, OCI-Ly10, U2932) DLBCL cell lines were treated with DMSO, CsA, or FK506 for 4 days and caspase activity was determined using DEVD-AMC as substrate. (E) Cell count of MCL cell lines treated with either DMSO or 300 nM CsA as indicated. (A-E) Cell counts, frequency of cells, or caspase activity were normalized to the solvent control. Error bars correspond to the mean ± SD. Statistical significance was calculated using Student t test (*P < .05, **P < .01, ***P < .001). Data are representative of at least 3 (A-C,E) or 2 (D) independent experiments. d, days; DMSO, dimethyl sulfoxide; SD, standard deviation.
Calcineurin inhibition triggers cytotoxicity in ABC DLBCL. (A) ABC DLBCL or (B) GCB DLBCL cells lines were treated with DMSO, 300 nM CsA, or 300 nM FK506, and cell numbers were counted every second day as indicated. (C) Annexin V-positive cells were measured by flow cytometry after 4 days of DMSO, CsA, or FK506 treatment. (D) GCB (BJAB and HT) and ABC (HBL-1, TMD8, OCI-Ly10, U2932) DLBCL cell lines were treated with DMSO, CsA, or FK506 for 4 days and caspase activity was determined using DEVD-AMC as substrate. (E) Cell count of MCL cell lines treated with either DMSO or 300 nM CsA as indicated. (A-E) Cell counts, frequency of cells, or caspase activity were normalized to the solvent control. Error bars correspond to the mean ± SD. Statistical significance was calculated using Student t test (*P < .05, **P < .01, ***P < .001). Data are representative of at least 3 (A-C,E) or 2 (D) independent experiments. d, days; DMSO, dimethyl sulfoxide; SD, standard deviation.
Chronic activation of the calcineurin-NFAT pathway in DLBCL cells
The selective sensitivity of ABC DLBCL cells toward calcineurin inhibitors indicates an involvement of the calcium-calcineurin-NFAT pathway in the survival of this subgroup. To visualize the activity of this pathway in DLBCL, we investigated 4 hallmarks of NFAT activation: (1) the increase of intracellular calcium; (2) the permeability of calcium channels; (3) the phosphorylation status of NFAT; and (4) its nuclear translocation. First, we determined the frequency of cells with increased intracellular calcium by flow cytometry using a fluorescent sensor. Surprisingly, not only ABC DLBCL, but all investigated DLBCL cell lines exhibited increased intracellular calcium levels compared with primary B cells, the Burkitt lymphoma cell line Ramos or the T-cell line Jurkat (Figure 2A; supplemental Figure 2A). Using an Mn2+ quenching approach, we demonstrated that all DLBCL cell lines exhibit a higher cation influx compared with the control cell lines Ramos or Jurkat, indicating an increased permeability of calcium channels in the plasma membrane (Figure 2B; supplemental Figure 2B).29 Because increased intracellular calcium levels result in the activation of the phosphatase calcineurin and dephosphorylation of NFAT,27 we visualized NFAT phosphorylation by immunoblotting. We focused on NFATc1 and NFATc2 because these are the most abundant NFAT proteins in lymphocytes.30 Several NFAT isoforms were expressed in the investigated B-cell lines, so we treated the cells either with CsA, FK506, or solvent control to discriminate the hyperphosphorylated from the hypophosphorylated NFAT species. Whereas the control cell lines Ramos or Jurkat showed neither NFATc1 nor NFATc2 hypophosphorylation in an unstimulated condition, all NFATc1/2 isoforms were hypophosphorylated and hence activated in both GCB and ABC DLBCL cells, which could be reversed by CsA or FK506 treatment (Figure 2C-E; supplemental Figure 2C). Similar to the DLBCL cells, MCL cell lines also showed constitutive NFATc1/2 hypophosphorylation (supplemental Figure 2D), even though GCB DLBCL and MCL cell lines were not sensitive toward calcineurin inhibitors. To assess whether the observed increased permeability of cation channels was responsible for NFATc1/2 dephosphorylation, we cultured DLBCL cells in calcium-free medium. Under these conditions, the lack of external calcium rapidly reduced NFATc1/2 dephosphorylation, suggesting that open calcium channels at the plasma membrane are essential for NFATc1/2 activation in DLBCLs (Figure 2F; supplemental Figure 2E).
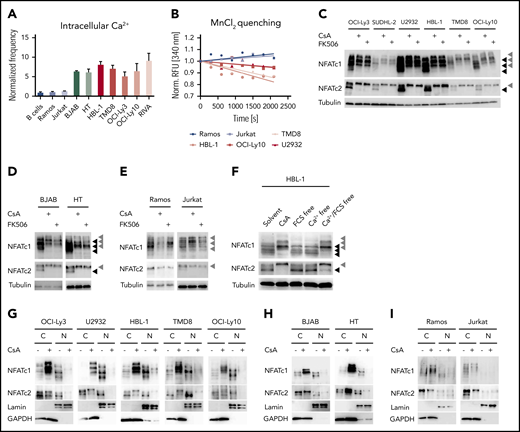
Calcium-mediated NFAT activation is deregulated in DLBCL cell lines. (A) Intracellular calcium levels of splenic primary mouse B cells or of the indicated cell lines measured by flow cytometry. Frequencies of positive cells were normalized to the control cell line Ramos. (B) To measure the permeability of cation channels at the plasma membrane, MnCl2 was added to the medium and Fura-2 quenching was assessed by flow cytometry over time. Fura-2 excitation was normalized to the fluorescence of each individual cell line before MnCl2 was added. Immunoblot analysis of (C) ABC DLBCL, (D) GCB DLBCL, or the (E) control cell lines Ramos and Jurkat, which were either treated with solvent, 600 nM CsA, or 600 nM FK506 for 4 hours to assess the phosphorylation status of NFATc1 and NFATc2. Tubulin served as loading control. (F) To investigate the importance of extracellular calcium, HBL-1 cells were kept for 4 hours in calcium-free and/or in fetal calf serum-free medium as indicated and analyzed for NFATc1/2 phosphorylation status by immunoblotting. Subcellular localization of NFATc1/2 in cytoplasmic and nuclear fractions of (G) solvent- or CsA-treated ABC DLBCL, (H) GCB DLBCL, or (I) control cell lines. Lamin A/C and GAPDH served as markers for N or C fractions, respectively. Data in panels A-E and G-I are representative of at least 3 independent experiments, in panel F of 2 independent experiments. (C-E) Black arrowheads mark hypophosphorylated and hence activated NFAT isoforms, whereas gray arrowheads indicate the hyperphosphorylated forms of the transcription factors. C, cytoplasmic; N, nuclear.
Calcium-mediated NFAT activation is deregulated in DLBCL cell lines. (A) Intracellular calcium levels of splenic primary mouse B cells or of the indicated cell lines measured by flow cytometry. Frequencies of positive cells were normalized to the control cell line Ramos. (B) To measure the permeability of cation channels at the plasma membrane, MnCl2 was added to the medium and Fura-2 quenching was assessed by flow cytometry over time. Fura-2 excitation was normalized to the fluorescence of each individual cell line before MnCl2 was added. Immunoblot analysis of (C) ABC DLBCL, (D) GCB DLBCL, or the (E) control cell lines Ramos and Jurkat, which were either treated with solvent, 600 nM CsA, or 600 nM FK506 for 4 hours to assess the phosphorylation status of NFATc1 and NFATc2. Tubulin served as loading control. (F) To investigate the importance of extracellular calcium, HBL-1 cells were kept for 4 hours in calcium-free and/or in fetal calf serum-free medium as indicated and analyzed for NFATc1/2 phosphorylation status by immunoblotting. Subcellular localization of NFATc1/2 in cytoplasmic and nuclear fractions of (G) solvent- or CsA-treated ABC DLBCL, (H) GCB DLBCL, or (I) control cell lines. Lamin A/C and GAPDH served as markers for N or C fractions, respectively. Data in panels A-E and G-I are representative of at least 3 independent experiments, in panel F of 2 independent experiments. (C-E) Black arrowheads mark hypophosphorylated and hence activated NFAT isoforms, whereas gray arrowheads indicate the hyperphosphorylated forms of the transcription factors. C, cytoplasmic; N, nuclear.
NFAT dephosphorylation by calcineurin is important for the unmasking of the nuclear localization sequence and thus for its rapid transport to the nucleus.27 To check whether the detected dephosphorylated NFATc1/2 species in DLBCL indeed undergo nuclear translocation, we purified cytoplasmic and nuclear fractions from DLBCL and control cell lines and visualized NFATc1/2 localization by immunoblotting. In ABC and GCB DLBCL cell lines, NFATc1/2 was clearly detected in the nuclear fraction and treatment with CsA or FK506 resulted in the export of NFATc1/2 (Figure 2G-I; supplemental Figure 2F). Collectively, an increased intracellular calcium level, an enhanced permeability of cation channels, as well as dephosphorylation and nuclear translocation of NFATc1/2 indicate a chronic activation of the calcineurin-NFATc1/2 pathway in DLBCL cells.
Increased NFAT activity in DLBCL does not derive from BCR signaling
Because autoreactive BCRs, CD79 mutations, and chronic BCR signaling were suggested to drive the growth of ABC DLBCLs,8,10,11,14 we speculated that the activation of the calcium-calcineurin-NFAT axis might be triggered by antigen receptor signaling. We therefore treated ABC and GCB DLBCL cell lines with small-molecule kinase inhibitors targeting Src, BTK, SYK, or phosphatidylinositol 3-kinase (PI3K) to block upstream BCR signaling and measured intracellular calcium levels over time. Surprisingly, none of the upstream kinase inhibitors was able to reduce calcium flux in DLBCL cells (Figure 3A). To validate the reliability of the fluorescent calcium probe used, we either added the calcium chelator EGTA, which indeed lowered the fluorescence intensity of the calcium sensor over time, or induced calcium flux with the ionophore ionomycin or an agonistic anti-immunoglobulin M (IgM) antibody (Figure 3A). Both ionomycin and anti-IgM induced a transient increase in calcium flux in all cells except for the GCB DLBCL cell line HT, which did not react to anti-IgM stimulation because of its lack of IgM surface expression (Figure 3A).8 Both the SYK inhibitor GS-9973 and the BTK inhibitor ibrutinib efficiently blocked anti-IgM-induced calcium flux in HBL-1 cells, but did not affect the increased steady-state calcium levels (Figure 3A; supplemental Figure 3A).
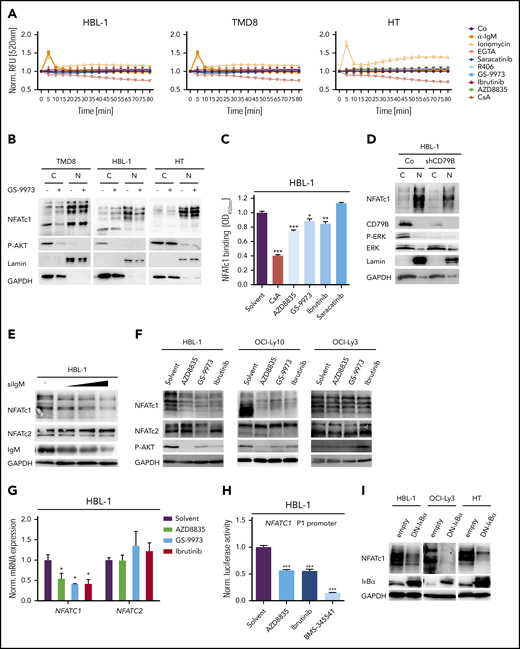
NFAT dephosphorylation and nuclear translocation are not driven by BCR signaling. (A) Measurement of intracellular calcium levels in the presence of either agonistic anti-IgM antibodies, the ionophore ionomycin, the Ca2+ chelator EGTA, the Src kinase inhibitor saracatinib, the SYK inhibitors GS-9973 and R406, the BTK inhibitor ibrutinib, or the PI3K inhibitor AZD8835. The intensity of the calcium sensor Calbryte 520 was measured over time by flow cytometry. (B) Cytoplasmic and nuclear fractions of DLBCL cell lines treated with solvent or the SYK inhibitor GS-9973 for 4 hours. NFATc1 localization was visualized by immunoblotting. P-AKT was used to control the efficacy of SYK inhibition in the ABC DLBCL cell lines TMD8 and HBL-1. Lamin A/C and GAPDH served as nuclear and cytoplasmic markers, respectively. (C) HBL-1 cells were treated with either solvent or the indicated inhibitors for 4 hours before quantification of NFATc1 binding to its consensus nucleotide sequence by TransAM assay. (D) Localization of NFATc1 in control or CD79B-silenced HBL-1 cells visualized by immunoblot analysis. (E) HBL-1 cells were transfected with scrambled or with increasing amounts of small interfering RNA targeting IgM. NFATc1/2 expression was analyzed by immunoblotting. (F) The ABC DLBCL cell lines were treated with solvent or the indicated inhibitors for 24 hours, before NFATc1/2 levels were measured by immunoblotting. (G) HBL-1 cells were treated with inhibitors targeting PI3K, SYK, or BTK and NFATc1/2 mRNA levels were quantified by qPCR. All samples were normalized to the solvent control. (H) The NFATc1 P1 luciferase-based reporter construct was transfected into HBL-1 cells, which were subsequently treated with inhibitors targeting PI3K, BTK, or IKK for 24 hours. Luciferase signals were normalized to the DMSO-treated sample. (I) The ABC DLBCL cell lines HBL-1 and OCI-Ly3 as well as the GCB cell line HT were lentivirally transduced with a DN-IκBα expression construct and NFATc1 levels were visualized by immunoblotting. (A-I) Data are representative of at least 3 independent experiments. Error bars correspond to the mean ± SD. Statistical significance was calculated using Student t test (*P < .05, **P < .01, ***P < .001). GAPDH, glyceraldehyde-3-phosphate dehydrogenase; qPCR, quantitative polymerase chain reaction.
NFAT dephosphorylation and nuclear translocation are not driven by BCR signaling. (A) Measurement of intracellular calcium levels in the presence of either agonistic anti-IgM antibodies, the ionophore ionomycin, the Ca2+ chelator EGTA, the Src kinase inhibitor saracatinib, the SYK inhibitors GS-9973 and R406, the BTK inhibitor ibrutinib, or the PI3K inhibitor AZD8835. The intensity of the calcium sensor Calbryte 520 was measured over time by flow cytometry. (B) Cytoplasmic and nuclear fractions of DLBCL cell lines treated with solvent or the SYK inhibitor GS-9973 for 4 hours. NFATc1 localization was visualized by immunoblotting. P-AKT was used to control the efficacy of SYK inhibition in the ABC DLBCL cell lines TMD8 and HBL-1. Lamin A/C and GAPDH served as nuclear and cytoplasmic markers, respectively. (C) HBL-1 cells were treated with either solvent or the indicated inhibitors for 4 hours before quantification of NFATc1 binding to its consensus nucleotide sequence by TransAM assay. (D) Localization of NFATc1 in control or CD79B-silenced HBL-1 cells visualized by immunoblot analysis. (E) HBL-1 cells were transfected with scrambled or with increasing amounts of small interfering RNA targeting IgM. NFATc1/2 expression was analyzed by immunoblotting. (F) The ABC DLBCL cell lines were treated with solvent or the indicated inhibitors for 24 hours, before NFATc1/2 levels were measured by immunoblotting. (G) HBL-1 cells were treated with inhibitors targeting PI3K, SYK, or BTK and NFATc1/2 mRNA levels were quantified by qPCR. All samples were normalized to the solvent control. (H) The NFATc1 P1 luciferase-based reporter construct was transfected into HBL-1 cells, which were subsequently treated with inhibitors targeting PI3K, BTK, or IKK for 24 hours. Luciferase signals were normalized to the DMSO-treated sample. (I) The ABC DLBCL cell lines HBL-1 and OCI-Ly3 as well as the GCB cell line HT were lentivirally transduced with a DN-IκBα expression construct and NFATc1 levels were visualized by immunoblotting. (A-I) Data are representative of at least 3 independent experiments. Error bars correspond to the mean ± SD. Statistical significance was calculated using Student t test (*P < .05, **P < .01, ***P < .001). GAPDH, glyceraldehyde-3-phosphate dehydrogenase; qPCR, quantitative polymerase chain reaction.
To confirm that the increased calcium flux does not originate from a BCR-induced signal, we treated several DLBCL cell lines with the SYK inhibitors GS-9973 or R406 and assessed the nuclear pool of NFATc1. Whereas CsA profoundly reduced the nuclear localization of NFATc1 (Figure 2G), both SYK inhibitors had only a mild impact on the localization of NFATc1 in DLBCL cells (Figure 3B; supplemental Figure 3B-C). Accordingly, neither Src, BTK, nor PI3K inhibitors altered NFATc1/2 phosphorylation and only mildly affected NFATc1 DNA binding (Figure 3C; supplemental Figure 3D-E). Silencing of IgM, CD79A, or CD79B in the ABC DLBCL cell line HBL-1 also confirmed that neither phosphorylation nor nuclear localization of NFATc1/2 were controlled by BCR-derived signals (Figure 3D-E).
Increased NFATc1 expression is regulated by NF-κB
Interestingly, we and others noticed that ABC DLBCLs on average express higher levels of NFATc1 compared with GCB DLBCLs and that silencing of IgM, CD79A, or CD79B for 48 hours as well as inhibition of BCR upstream signaling by SYK, BTK, or PI3K inhibitors for 24 hours lowered the protein levels of NFATc1, but not of NFATc2 (Figure 3D-F; supplemental Figure 3F-I).22 The reduction of NFATc1 expression was apparently the result of impaired transcription because messenger RNA (mRNA) levels of NFATC1, but not of NFATC2, were decreased by SYK, BTK, or PI3K inhibitor treatment (Figure 3G). One of the main factors driving NFATc1 expression is the transcription factor NF-κB.31 To test if NF-κB was involved in the expression of NFATc1 in DLBCL, we transfected an NFATc1 reporter into HBL-1 cells and blocked NF-κB activity with an IKK inhibitor. Indeed, inhibition of IKK, but also of PI3K or BTK, strongly reduced the NFATc1 reporter activity (Figure 3H).32 Accordingly, expression of a dominant-negative mutant of IκBα (DN-IκBα) to block canonical NF-κB activity strongly interfered with NFATc1 expression in various ABC DLBCL cell lines (Figure 3I). In line with a previous report, NF-κB induced NFATC1 expression by activating the distal, but not the proximal promoter in DLBCL cells (supplemental Figure 3J).31 Collectively, these results suggest that the increased intracellular calcium levels, the calcineurin-mediated dephosphorylation, and nuclear translocation of NFAT are independent of signals from the BCR, whereas the strong expression of NFATc1 in ABC DLBCL cells is driven by a BCR-mediated activation of NF-κB. In line with this hypothesis, we were unable to block NFATc1 expression with inhibitors targeting BCR signaling in OCI-Ly3 cells, which harbor a CARD11 mutation that promotes NF-κB activity independently of the BCR (Figure 3F).15 In contrast, NF-κB inhibition downstream of CARD11, through the expression of DN-IκBα, efficiently reduced NFATc1 in the OCI-Ly3 cell line (Figure 3I).
Calcineurin inhibition impairs IL-6, IL-10, and c-Jun expression
To better understand the mechanism underlying the toxicity of calcineurin inhibition in ABC DLBCL, we analyzed the global gene expression profiles of the ABC DLBCL cell line HBL-1 after 12, 24, 36, and 48 hours of CsA treatment (Figure 4A; supplemental Figure 4A; supplemental Table 3). Gene set enrichment analysis revealed that calcineurin inhibition affected numerous NF-κB target genes as well as genes regulated by the PI3K inhibitor AZD8835 (supplemental Figure 4B; supplemental Table 4). Because PI3K inhibition impairs NF-κB activity in DLBCLs, but luciferase-based reporter assay analysis did not reveal any reduction in NF-κB activity by CsA or FK506 (supplemental Figure 4C), we speculated that NFAT and NF-κB regulate common target genes in B cells.33 Indeed, in addition to typical NFAT target genes such as EGR2, we identified IL10, NFKBIA, and JUN, previously described as NF-κB target genes in DLBCL, as genes that are also regulated by NFAT (Figure 4B-D; supplemental Figure 4D-E).34,35 This is in agreement with recent findings that NFATc1 regulates IL10 and thus PD-L1 expression.22 Additionally, we detected decreased mRNA expression of STAT3 and SOCS3, which might result from reduced IL-10 production (Figure 4B; supplemental Figure 4D).35,36 Interestingly, only the expression of JUN, but not of JUNB or JUND, was affected by calcineurin inhibition (Figure 4C; supplemental Figure 4D). CsA treatment of the GCB DLBCL cell line HT did not affect JUN, SOCS3, or IL10 expression, indicating that NFAT regulates a different subset of target genes in the 2 DLBCL subtypes (supplemental Figure 5A-B; supplemental Table 5).
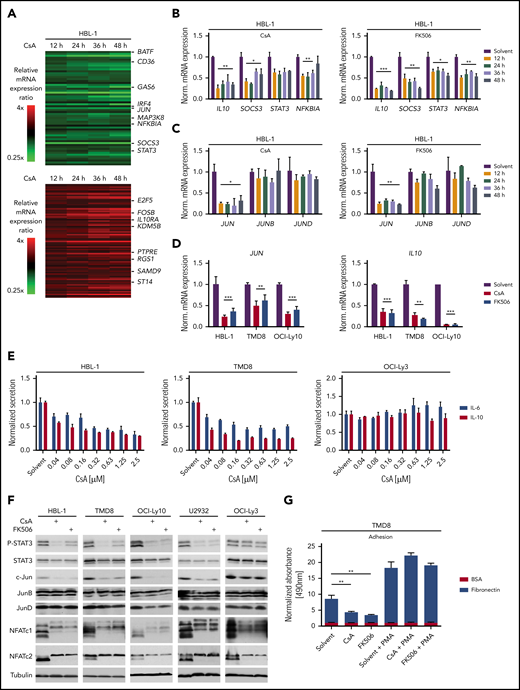
NFAT controls the expression of IL-6, IL-10, and c-Jun. (A) Heatmaps of differentially expressed genes in HBL-1 treated for 12, 24, 36, and 48 hours with CsA compared with the solvent control. Gene expression changes are depicted according to the color scale. (B,C) HBL-1 cells were treated with solvent, CsA, or FK506; mRNA levels of the indicated genes were quantified by qPCR analysis. (D) JUN and IL10 mRNA expression were measured by qPCR in the indicated ABC DLBCL cell lines. (E) IL-6 and IL-10 protein levels were quantified in the medium of solvent- or CsA-treated ABC DLBCL cell lines by ELISA and normalized to the DMSO control. (F) The indicated ABC DLBCL cell lines were treated for 48 hours with solvent, CsA or FK506 and cell lysates were analyzed by western blotting. (G) TMD8 cells were treated with solvent or the calcineurin inhibitors for 48 hours and part of the cells were incubated with PMA for 6 hours subsequently. Adhesion to BSA- or fibronectin-coated plates was measured by an MTS assay. Adhesion was normalized to solvent-treated cells bound to BSA-coated plates. (A-G) Data are representative of at least 3 independent experiments. Error bars correspond to the mean ± SD. Statistical significance was calculated using Student t test (*P < .05, **P < .01, ***P < .001). PMA, phorbol 12-myristate 13-acetate.
NFAT controls the expression of IL-6, IL-10, and c-Jun. (A) Heatmaps of differentially expressed genes in HBL-1 treated for 12, 24, 36, and 48 hours with CsA compared with the solvent control. Gene expression changes are depicted according to the color scale. (B,C) HBL-1 cells were treated with solvent, CsA, or FK506; mRNA levels of the indicated genes were quantified by qPCR analysis. (D) JUN and IL10 mRNA expression were measured by qPCR in the indicated ABC DLBCL cell lines. (E) IL-6 and IL-10 protein levels were quantified in the medium of solvent- or CsA-treated ABC DLBCL cell lines by ELISA and normalized to the DMSO control. (F) The indicated ABC DLBCL cell lines were treated for 48 hours with solvent, CsA or FK506 and cell lysates were analyzed by western blotting. (G) TMD8 cells were treated with solvent or the calcineurin inhibitors for 48 hours and part of the cells were incubated with PMA for 6 hours subsequently. Adhesion to BSA- or fibronectin-coated plates was measured by an MTS assay. Adhesion was normalized to solvent-treated cells bound to BSA-coated plates. (A-G) Data are representative of at least 3 independent experiments. Error bars correspond to the mean ± SD. Statistical significance was calculated using Student t test (*P < .05, **P < .01, ***P < .001). PMA, phorbol 12-myristate 13-acetate.
The observed reduction in IL10 mRNA levels in CsA-treated HBL-1 cells correlated with a decreased secretion of IL-10 in the supernatants of the ABC DLBCL cell lines HBL-1 and TMD8 upon CsA or FK506 treatment (Figure 4E; supplemental Figure 4F). The cytokines IL-10 and IL-6 stimulate the growth of ABC DLCBL in an auto- and paracrine manner via the JAK/STAT3 pathway.35 Therefore, we next investigated whether the calcineurin inhibitor-mediated downregulation of IL-10 affected STAT3 phosphorylation. Strikingly, P-STAT3 levels were strongly reduced after CsA or FK506 treatment in the majority of ABC DLBCL cell lines, indicating that secretion of IL-10 and possibly also of IL-6 might be affected by calcineurin inhibition (Figure 4F; supplemental Figure 6A). Indeed, secretion of both, IL-10 and IL-6, was dependent on NFAT activity, explaining the strong reduction in STAT3 phosphorylation (Figure 4E-F; supplemental Figure 4F). Thus, the CsA-mediated cytotoxicity observed for ABC DLBCL cell lines likely results from the inhibition of the NFAT-dependent production of these growth-promoting cytokines.
The transcription factor c-Jun was strongly downregulated at both the mRNA and protein level upon calcineurin inhibition in most ABC DLBCL cell lines (Figure 4C-D,F; supplemental Figure 6B). c-Jun plays at least 2 important roles in DLBCL tumor biology. First, c-Jun regulates the interaction of tumor cells with the microenvironment and is required for efficient metastasis.20 This might be due to a Jun-mediated control of adhesion to extracellular matrix proteins, such as fibronectin. Because calcineurin inhibitors reduce c-Jun expression in ABC DLBCL cells, we tested whether CsA or FK506 treatment affects the adhesion of lymphoma cells to fibronectin. Indeed, both calcineurin inhibitors decreased the capability of the ABC DLBCL cell line TMD8 to adhere to fibronectin-coated plates (Figure 4G). The reduction of adhesion was not caused by cytotoxicity of the calcineurin inhibitors because phorbol 12-myristate 13-acetate treatment restored c-Jun protein levels and adhesion to fibronectin (Figure 4G; supplemental Figure 6C). Another important role of c-Jun, as a constituent of the heterodimeric transcription factor AP-1, is to regulate the expression of IL-6, IL-10, and other pro-survival factors.16,20 To investigate whether c-Jun deficiency or the reduced IL-6/IL-10 expression contributes to the cytotoxic effects of calcineurin inhibitors, we transduced OCI-Ly10 cells with a c-Jun expression vector or reconstituted IL-6/IL-10 in the culture medium and assessed cell growth upon calcineurin inhibition. c-Jun expression and IL-6/IL-10 supplementation partially rescued the impaired survival caused by calcineurin inhibition, whereas the combination of both c-Jun and IL-6/IL-10 had no further significant effect (Figure 5A-B; supplemental Figure 6D). Thus, CsA-mediated reduction of c-Jun levels not only affects the adhesiveness of ABC DLBCL cells, but also controls the growth and survival together with other NFAT targets like IL-6 and IL-10.
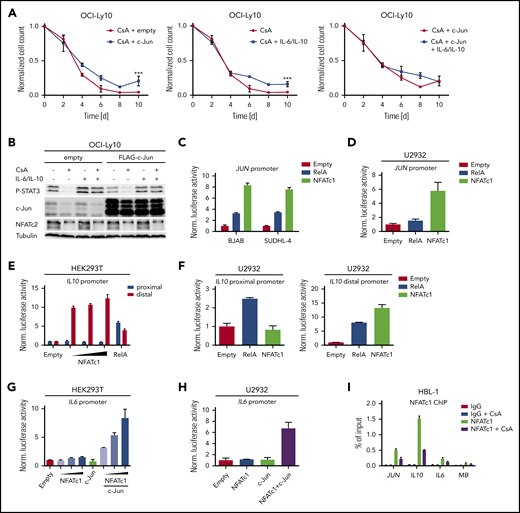
IL6, IL10, and JUN expression is directly regulated by NFAT. (A) c-Jun overexpressing or control OCI-Ly10 cells were treated every second day with CsA and/or IL-6/IL-10 as indicated. Treated cells were counted and normalized to the solvent controls. (B) OCI-Ly10 cells, which had been transduced with either a c-Jun or an empty expression vector, were treated for 48 hours with solvent, CsA, and/or IL-6/IL-10 as indicated. P-STAT3 and c-Jun protein levels were assessed by immunoblotting. A JUN reporter construct was cotransfected with either empty vector control, RelA, or NFATc1/αA in the indicated (C) GCB DLBCL cell lines or (D) in U2932. Luciferase activity was measured (C) 48 or (D) 36 hours after transfection and normalized to the empty vector control. (E,G) HEK293T cells were transfected with IL-6 or IL-10 reporter constructs in combination with RelA, c-Jun, and NFATc1/αA as indicated. Luciferase activity was measured 24 hours after transfection and normalized to the empty vector control. (F,H) The ABC DLBCL cell line U2932 was electroporated with either a proximal/distal IL10 or an IL6 reporter construct. Expression vectors containing RelA, NFATc1/αA, or c-Jun were cotransfected as indicated. Thirty-six hours after transfection, luciferase activity was quantified and normalized to the empty vector control. (I) ChIP analysis from CsA- or solvent-treated (4 hours) HBL-1 cells. NFATc1 binding to the JUN, IL10, IL6, and myoglobin (MB) promoters was compared with the IgG control. The data are representative of (A-H) at least 3 or (I) 2 independent experiments. Error bars correspond to the mean ± SD. Statistical significance was calculated using Student t test (*P < .05, **P < .01, ***P < .001).
IL6, IL10, and JUN expression is directly regulated by NFAT. (A) c-Jun overexpressing or control OCI-Ly10 cells were treated every second day with CsA and/or IL-6/IL-10 as indicated. Treated cells were counted and normalized to the solvent controls. (B) OCI-Ly10 cells, which had been transduced with either a c-Jun or an empty expression vector, were treated for 48 hours with solvent, CsA, and/or IL-6/IL-10 as indicated. P-STAT3 and c-Jun protein levels were assessed by immunoblotting. A JUN reporter construct was cotransfected with either empty vector control, RelA, or NFATc1/αA in the indicated (C) GCB DLBCL cell lines or (D) in U2932. Luciferase activity was measured (C) 48 or (D) 36 hours after transfection and normalized to the empty vector control. (E,G) HEK293T cells were transfected with IL-6 or IL-10 reporter constructs in combination with RelA, c-Jun, and NFATc1/αA as indicated. Luciferase activity was measured 24 hours after transfection and normalized to the empty vector control. (F,H) The ABC DLBCL cell line U2932 was electroporated with either a proximal/distal IL10 or an IL6 reporter construct. Expression vectors containing RelA, NFATc1/αA, or c-Jun were cotransfected as indicated. Thirty-six hours after transfection, luciferase activity was quantified and normalized to the empty vector control. (I) ChIP analysis from CsA- or solvent-treated (4 hours) HBL-1 cells. NFATc1 binding to the JUN, IL10, IL6, and myoglobin (MB) promoters was compared with the IgG control. The data are representative of (A-H) at least 3 or (I) 2 independent experiments. Error bars correspond to the mean ± SD. Statistical significance was calculated using Student t test (*P < .05, **P < .01, ***P < .001).
Molecular mechanism of NFAT-mediated JUN, IL6, and IL10 expression
To assess if JUN, IL6, and IL10 are direct NFAT target genes, we generated luciferase-based reporter constructs comprising their promoters. Coexpression of the JUN reporter with RelA or NFATc1 in the ABC cell line U2932 or the GCB cell lines BJAB and SUDHL-4 showed that JUN transcription can be induced not only by NF-κB but also by NFATc1 (Figure 5C-D). Based on published chromatin immunoprecipitation (ChIP) data and in silico analyses, a proximal and a distal region of the IL10 promoter might be responsible for the control of IL10 expression.37 Although the reporter containing the proximal IL10 promoter was only responsive to RelA, the distal promoter was activated by both RelA and NFATc1 (Figure 5E-F).
In contrast to the JUN and IL10 promoters, simple coexpression of NFATc1 or NFATc2 was not sufficient to drive IL6 reporter gene activity (Figure 5G-H; supplemental Figure 6E). Interestingly, several reports suggested that NFAT can form complexes with AP-1 to regulate a unique set of genes.38 Indeed, although NFATc1 or c-Jun expression alone was unable to activate the IL6 promoter, coexpression of both proteins induced IL6 reporter gene activity in a dose-dependent manner (Figure 5G-H; supplemental Figure 6E). NFATc1 ChIP analyses confirmed that NFATc1 is constitutively bound to the JUN, IL6, and the distal IL10 promoters in the ABC DLBCL cell line HBL-1 and that CsA treatment reduces DNA binding to these sites (Figure 5I).
In accordance to the JUN and IL10 reporter gene assay, silencing of NFATc1 led to reduced expression of IL10 and JUN mRNA in the ABC DLBCL cell line HBL-1 (supplemental Figure 7A). Interestingly, NFATc1 silencing by 2 independent short hairpin RNAs impaired the growth of the ABC DLBCL cell lines HBL-1, TMD8 and U2932, but not of the GCB cell line HT (supplemental Figure 7B-C), suggesting that calcineurin inhibitors mediate its cytotoxic effects in ABC DLBCL via NFATc1 inhibition. Collectively, we propose that JUN, IL10, and IL6 are direct NFATc1 target genes in ABC DLBCLs and that their expression is regulated by an interplay of NFATc1 with other transcription factors, such as NF-κB and AP-1.
Several NFATc1/2 target genes are also controlled by NF-κB. We therefore hypothesized that DLBCL cells with an activating CARD11 mutation, leading to constitutive NF-κB activation,15 should be less sensitive toward calcineurin inhibitors. We noticed that neither IL-6/IL-10 nor P-STAT3 or c-Jun levels were affected by CsA or FK506 in OCI-Ly3 cells, which express the activating CARD11 mutation L244P (Figure 4E-F; supplemental Figure 4F).15 To confirm that activating CARD11 mutations indeed weaken the toxicity of calcineurin inhibitors, we transduced OCI-Ly10 cells with CARD11L244P and treated those cells with CsA and FK506. Indeed, CARD11L244P-expressing cells not only showed improved survival upon CsA and FK506 treatment, but also exhibited enhanced c-Jun and P-STAT3 levels compared with control cells (supplemental Figure 7D-E).
Inhibition of BCL-2 or MCL-1 synergizes with calcineurin blockade in ABC DLBCL
To investigate the potential of calcineurin inhibitors in vivo, we used a TMD8 xenograft mouse model, administered FK506 for 5 consecutive days and quantified tumor growth over time. FK506 treatment reduced both tumor volume and weight significantly (Figure 6A-B). To screen for combinatorial effects of calcineurin inhibitors with drugs previously described to be active in patients with B-cell lymphomas in vivo, we transplanted the ABC DLBCL cell line TMD8 into the yolk of zebrafish embryos that were subsequently cultured in solvent- or inhibitor-supplemented medium. Whereas the solvent control group developed tumors in ∼60% of animals after 3 days, CsA and FK506 treatment impaired tumor formation (Figure 6C-D). Interestingly, we noticed that combination of the BCL-2 inhibitor ABT-199 with CsA prevented tumor formation in more than two-thirds of the animals. The BCL-2 inhibitor ABT-199 (venetoclax), a BH3 mimetic, which exhibited a partial efficacy in a phase 1 first-in-human study and in a recent trial combined with rituximab, cyclophosphamide, doxorubicin hydrochloride, vincristine sulfate, and prednisone,39,40 was further characterized in combination with CsA in several DLBCL cell lines. Whereas ABT-199 only weakly interfered with the survival of ABC DLBCL at low concentrations, calcineurin inhibitors strongly sensitized the cells to BCL-2 inhibition (Figure 6E; supplemental Figure 8A). Because the BCL-2 member MCL-1 is frequently overexpressed in DLBCL and also fulfills an antiapoptotic function,41,42 we tested an MCL-1 inhibitor, S63845, for its potential to synergize with calcineurin inhibitors. Comparable to ABT-199, S63845 synergized with CsA in the killing of various ABC DLBCL cell lines (Figure 6F; supplemental Figure 8B). Collectively, our data suggest that the use of calcineurin inhibitors in combination with BH3 mimetics targeting BCL-2 or MCL-1 might represent a promising novel strategy in targeting the survival of ABC DLBCL cells.
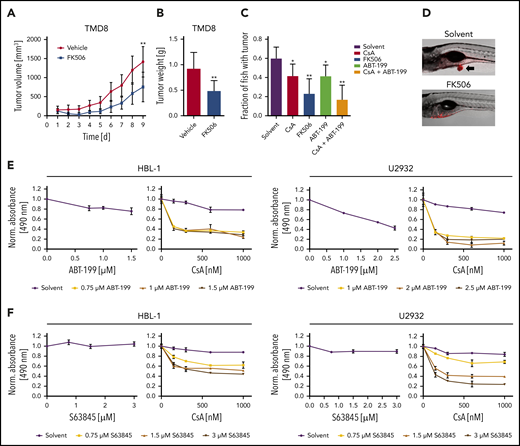
BCL-2 or MCL-1 inhibition synergizes with calcineurin blockade. (A) TMD8 xenograft mice were treated for 5 consecutive days with vehicle (n = 7) or 4 mg/kg FK506 (n = 6) and tumor volume was quantified by caliper measurements. FK506 significantly reduces tumor growth (P = .0093). (B) Average tumor weight of TMD8 xenograft mice after treatment of 9 days with vehicle (n = 7) or FK506 (n = 6). FK506 significantly reduces tumor mass (P = .0058). (C) TMD8 cells were transplanted in zebrafish embryos and tumor formation of treated animals was counted after 3 days by microscopy (n ≥ 20). (D) Representative images of transplanted zebrafish embryos after solvent or FK506 treatment. Arrow indicates the formation of a tumor. The ABC DLBCL cell lines HBL-1 or U2932 were treated with either (E) ABT-199 or (F) the MCL-1 inhibitor S63845 in the absence (left) or presence of CsA (right). Cell survival was quantified by an MTS assay. The combination index for CsA and ABT-199 in HBL-1 and U2932 is ≤0.17 and ≤0.34, respectively. For CsA and S68432, the combination index is ≤0.19 for HBL-1 and ≤0.23 for U2932. The data are representative of (E-F) at least 3 independent experiments. Error bars correspond to the mean ± SD. Statistical significance was calculated using Student t test (*P < .05, **P < .01, ***P < .001).
BCL-2 or MCL-1 inhibition synergizes with calcineurin blockade. (A) TMD8 xenograft mice were treated for 5 consecutive days with vehicle (n = 7) or 4 mg/kg FK506 (n = 6) and tumor volume was quantified by caliper measurements. FK506 significantly reduces tumor growth (P = .0093). (B) Average tumor weight of TMD8 xenograft mice after treatment of 9 days with vehicle (n = 7) or FK506 (n = 6). FK506 significantly reduces tumor mass (P = .0058). (C) TMD8 cells were transplanted in zebrafish embryos and tumor formation of treated animals was counted after 3 days by microscopy (n ≥ 20). (D) Representative images of transplanted zebrafish embryos after solvent or FK506 treatment. Arrow indicates the formation of a tumor. The ABC DLBCL cell lines HBL-1 or U2932 were treated with either (E) ABT-199 or (F) the MCL-1 inhibitor S63845 in the absence (left) or presence of CsA (right). Cell survival was quantified by an MTS assay. The combination index for CsA and ABT-199 in HBL-1 and U2932 is ≤0.17 and ≤0.34, respectively. For CsA and S68432, the combination index is ≤0.19 for HBL-1 and ≤0.23 for U2932. The data are representative of (E-F) at least 3 independent experiments. Error bars correspond to the mean ± SD. Statistical significance was calculated using Student t test (*P < .05, **P < .01, ***P < .001).
Discussion
Here we provide several lines of evidence that NFAT signaling is chronically activated in DLBCL and controls biological key processes, such as cell survival and interaction with the tumor environment. Unlike the GCB subtype, ABC DLBCL cells were particularly sensitive to inhibition of the NFAT pathway, identifying calcineurin inhibitors as a promising therapeutic approach for these aggressive tumors. Because the survival of ABC DLBCL cells critically depends on chronic BCR signaling, which originates from autoreactive BCRs or mutations in BCR proximal signaling components (eg, CD79), it has been assumed that the BCR-derived signal might represent the molecular basis for the nuclear localization of NFAT found in human biopsies.22 Intriguingly, our work clearly reveals that neither silencing of IgM or CD79 nor inhibition of BCR associated kinases, such as BTK, SYK, or Src kinase family members, affected NFATc1/2 phosphorylation or localization to the nucleus. Accordingly, whereas SYK and Src kinase inhibitors efficiently abrogated the anti-IgM-induced calcium flux, they did not alter the increased basal calcium levels observed in DLBCL cell lines. These surprising findings suggest that NFAT is not activated by BCR signaling in DLBCL, and that future efforts are required to elucidate the molecular mechanism underlying constitutive NFAT activation. Interestingly, even though DLBCLs show only a moderate increase in intracellular calcium concentrations, this is sufficient to trigger a substantial translocation of NFATc1/2 to the nucleus. Although chronic BCR activation in DLBCL is not responsible for the increased calcium levels or NFATc1/2 dephosphorylation, it still promotes NFAT signaling indirectly, by inducing transcription of NFATC1, but not NFATC2. NFATC1 induction is driven by NF-κB because an IKK inhibitor or expression of the IκB super-repressor interfered with NFATC1 expression.
We propose a model in which calcineurin inhibitors induce cytotoxicity in ABC DLBCL by preventing the NFAT-mediated expression of critical genes, including the STAT3 activators IL-6 and IL-10 and the AP-1 member c-Jun, which are crucial for the survival of ABC but not of GCB DLBCL cells.16,35 Reporter gene analyses revealed that NFATc1 can directly control the transcription of IL10 and JUN, whereas IL6 expression relied on the activity of both NFATc1 and c-Jun, suggesting that a previously described AP-1:NFAT complex is able to activate IL6 transcription.38,43 Interestingly, our global gene expression profiling and gene set enrichment analysis suggested that expression of NF-κB target genes, such as IL10 and JUN, was particularly affected by calcineurin inhibition. This indicates that NFATc1/2 and NF-κB synergize on the promoter of these pro-survival genes and thus orchestrate their expression in ABC DLBCL. Whereas general NF-κB inhibitors have not made their way into clinical application because of their high toxicity, therapeutic inhibition of NFAT by calcineurin inhibitors has proven to be beneficial and comparably safe over the past decades. Both CsA and FK506 are potent immunosuppressive drugs that have been extensively used in patients receiving allogeneic transplants as well as in autoimmune diseases.44 Repurposing of calcineurin inhibitors might represent therefore a promising strategy for ABC DLBCL treatment. It should not be ignored however that in simultaneous combination regimens immunosuppressive effects of calcineurin inhibitors might weaken the efficacy of immunotherapies with, for example, T-cell engagers or checkpoint inhibitors. Further studies are therefore needed to evaluate the therapeutic potential of sequential treatment regimes.
Roughly 40% to 80% of primary DLBCL samples exhibit high levels of BCL-2 expression, identifying this pro-survival protein as another promising target for the treatment of DLBCL patients.45-48 The BCL-2 inhibitor ABT-199 is highly selective and has shown very promising results in chronic lymphocytic leukemia.19,49 MCL-1, which is also overrepresented especially in the ABC DLBCL subtype, can overcome BCL-2 inhibition. Therefore, targeting of both proteins might represent an approach superior to monotherapy.41,42 Our data reveal that calcineurin inhibitors synergize with both the BCL-2 inhibitor ABT-199 and the MCL-1 inhibitor S63845, resulting in improved targeting of cells from the ABC DLBCL subtype. In conclusion, our results suggest that a combination of these drugs with calcineurin inhibitors could provide a promising therapeutic strategy for ABC DLBCL treatment.
The gene expression data are available from the Gene Expression Omnibus of the National Center for Biotechnology Information (www.ncbi.nlm.nih.gov/geo) through GEO accession number GSE140882.
The online version of this article contains a data supplement.
The publication costs of this article were defrayed in part by page charge payment. Therefore, and solely to indicate this fact, this article is hereby marked “advertisement” in accordance with 18 USC section 1734.
Acknowledgments
The authors thank Margot Thome for critical reading of the manuscript and for reagents.
This work was supported by the Collaborative Research Center Transregio SFB/TR 156 (S.H. and D.K.), SFB/TR 209 (K.S.-O. and S.H.), the Emmy-Noether program of the DFG and the DFG under Germany’s Excellence Strategy EXC2180 (S.H.), the Deutsche Krebshilfe (G.L. and S.H.), the Ministry of Health of the Czech Republic (grant NV19-08-00144) (P.K.), and the Charles University Center of Excellence (UNCE/MED/016) (P.K.).
Authorship
Contribution: P.B., T.E., C.S., P.G., W.X., A.S., P.K., and C.S. performed experiments; P.B., T.E., E.S., D.K., M.Z., M.G., K.S.-O., C.L., P.K., G.L., and S.H. analyzed data; P.B., G.L., and S.H. wrote the manuscript, which all other authors commented on; and G.L. and S.H. conceived and coordinated the study.
Conflict-of-interest disclosure: G.L. has received honoraria from Bayer, AstraZeneca, NanoString, Celgene, Gilead, Janssen, and Roche; has participated in a consulting or advisory role for AstraZeneca, Bayer, Celgene, Gilead, Janssen, NanoString, and Roche; has been on a speaker’s bureau for Bayer, Celgene, Gilead, Janssen, and Roche; has received research funding from AQUINOX, AstraZeneca, Bayer, Celgene, Gilead, Janssen, and Roche; and has had travel, accommodation, and expenses reimbursed by Bayer, Celgene, Gilead, Janssen, Roche, and Verastem. The remaining authors declare no competing financial interests.
Correspondence: Stephan Hailfinger, Interfaculty Institute for Biochemistry, University of Tübingen, Hoppe-Seyler-Str 4, D-72076 Tübingen, Germany; e-mail: stephan.hailfinger@uni-tuebingen.de.

This feature is available to Subscribers Only
Sign In or Create an Account Close Modal