

Key Points
We developed and validated a prognostic index that assigns patient-specific risk scores and defines clinically relevant risk groups.
Our prognostic index, PIUKALL, integrates existing risk factors and leverages continuous data to outperform existing risk algorithms.

Abstract
Risk stratification is essential for the delivery of optimal treatment in childhood acute lymphoblastic leukemia. However, current risk stratification algorithms dichotomize variables and apply risk factors independently, which may incorrectly assume identical associations across biologically heterogeneous subsets and reduce statistical power. Accordingly, we developed and validated a prognostic index (PIUKALL) that integrates multiple risk factors and uses continuous data. We created discovery (n = 2405) and validation (n = 2313) cohorts using data from 4 recent trials (UKALL2003, COALL-03, DCOG-ALL10, and NOPHO-ALL2008). Using the discovery cohort, multivariate Cox regression modeling defined a minimal model including white cell count at diagnosis, pretreatment cytogenetics, and end-of-induction minimal residual disease. Using this model, we defined PIUKALL as a continuous variable that assigns personalized risk scores. PIUKALL correlated with risk of relapse and was validated in an independent cohort. Using PIUKALL to risk stratify patients improved the concordance index for all end points compared with traditional algorithms. We used PIUKALL to define 4 clinically relevant risk groups that had differential relapse rates at 5 years and were similar between the 2 cohorts (discovery: low, 3% [95% confidence interval (CI), 2%-4%]; standard, 8% [95% CI, 6%-10%]; intermediate, 17% [95% CI, 14%-21%]; and high, 48% [95% CI, 36%-60%; validation: low, 4% [95% CI, 3%-6%]; standard, 9% [95% CI, 6%-12%]; intermediate, 17% [95% CI, 14%-21%]; and high, 35% [95% CI, 24%-48%]). Analysis of the area under the curve confirmed the PIUKALL groups were significantly better at predicting outcome than algorithms employed in each trial. PIUKALL provides an accurate method for predicting outcome and more flexible method for defining risk groups in future studies.
Introduction
Accurate risk stratification is essential for the delivery of optimal treatment in pediatric acute lymphoblastic leukemia (ALL). Experimental therapeutic approaches are needed to improve cure rates for high-risk (HR) patients. Conversely, treatment deintensification to reduce long-term toxicity can only be justified for patient subgroups with a very low relapse risk. Minimal residual disease (MRD) during the first month of therapy is the most powerful prognostic factor in both pediatric and adult ALL and can be used to guide both therapy intensification and reduction.1-3 However, MRD alone is not sufficient to fully predict outcome. We have recently shown that the prognostic effect of MRD differs significantly according to the genetic makeup of the leukemic clone.4 Other patient- or disease-specific characteristics, including age and white cell count (WCC), have also been shown to independently influence outcome.5
The multitude of risk factors in pediatric ALL poses significant challenges to the development of risk algorithms. Risk factors have been used in different ways, which has hindered the direct comparison of cure rates. Crucially, the requirement for simple clinical stratification has driven the use of categorical thresholds of continuous variables. However, dichotomization of continuous variables leads to significant loss of statistical power.6 Moreover, categorizing continuous variables that are unevenly distributed produces risk groups of unequal and fixed size. This approach reduces flexibility when defining treatment groups by both size and relapse risk when designing clinical trials.
We recently analyzed MRD data as a continuous variable for the first time in pediatric ALL and demonstrated that at the end of induction (EOI) disease levels were log normally distributed and that each log reduction in disease burden achieved by EOI decreased the risk of relapse by 20%.4 In addition, a metaanalysis of 39 MRD studies concluded that achieving MRD negativity (<0.01%) by EOI reduced a patient’s risk of relapse fourfold.2 These results are consistent with one another and are both clinically important.
In this study, we used continuous data from >4,700 patients across four large international contemporaneous trials to build and validate an integrated prognostic index that enhances predictive power in pediatric ALL.
Methods
Study participants, treatment, and oversight
Individual patient data used in this post hoc analysis were derived from patients who consented to treatment in the following trials: UKALL2003 (registered at www.isrctn.com as #ISCTRN07355119), Nordic Society of Pediatric Haematology and Oncology (NOPHO)–ALL2008 (registered at https://eudract.ema.europa.eu as #Eudract-2008-003235-02),7 and Dutch Children’s Oncology Group (DCOG)–ALL10 or German Co-operative Study Group (CoALL)–07-03. Full details of recruitment, treatment, and outcome have been published: UKALL2003,1,3 NOPH0-ALL2008,7 DOCG-ALL10,8 and CoALL-07-03.9 All 4 protocols excluded infants (age <1 year) but had variable upper age limits: 18 (DCOG-ALL10 and CoALL-07-03), 24 (UKALL2003), and 45 years (NOPHO-ALL2008). Each protocol risk stratified patients into 2 or 3 risk groups based on a combination of risk factors that included age, WCC, genetics, and MRD (supplemental Table 1, available on the Blood Web site). Each trial was approved by the relevant ethics committee, and patients or parents provided written informed consent in accordance with the Declaration of Helsinki.
MRD and genetic studies
MRD was evaluated by polymerase chain reaction analysis of immunoglobulin/T-cell receptor rearrangements (UKALL2003, DCOG-ALL10, and CoALL-07-03) or flow cytometry using 6-color MRD panels to detect leukemia-associated immunophenotypes (NOPHO-ALL2008). To examine MRD as a continuous variable, we log transformed the raw MRD value calculated at EOI: τ(MRD) [−ln(MRD)].4 Patients with undetectable MRD were assigned a value of 1 × 10⁻⁶ (1 log below the minimum detection level of 1 × 10⁻⁵). MRD values <1 × 10⁻⁵ were rounded up to 1 × 10⁻⁵, whereas values ≥1 were rounded down to 0.99999.
For the discovery cohort, pretreatment cytogenetic and immunophenotyping analyses were used to classify patients into 4 mutually exclusive subtypes: (1) cytogenetic good risk: ETV6-RUNX1, and high hyperdiploidy 51-67 chromosomes; (2) cytogenetic HR: KMT2A fusions, near haploidy (<30 chromosomes), low hypodiploidy (30-39 chromosomes), and intrachromosomal amplification of chromosome 21q (iAMP21) and t(17;19)(q23;p13)/TCF3-HLF; (3) cytogenetic intermediate risk (IR): t(1;19)(q23;p13)/TCF3-PBX1 and B-other; and (4) T-cell ALL (T-ALL).10 For the validation cohort, we collected the data required to calculate the prognostic index (ie, the presence or absence of good and HR cytogenetics). Copy-number data derived from multiplex ligation-dependent probe amplification analysis using the P335 SALSA kit (MRC Holland) were available for UKALL2003 and DCOG-ALL10 and analyzed and coded as previously described.11,12
Eligibility criteria, end points, and statistical analysis
Figure 1 provides details of the cases included in this analysis. To enable meaningful cross-cohort comparison, we applied multiple exclusion criteria. The excluded cohort was enriched, by definition, for HR patients, but overall, the analyzed cohort was representative of a vast majority of pediatric and adolescent ALLs (supplemental Table 2).
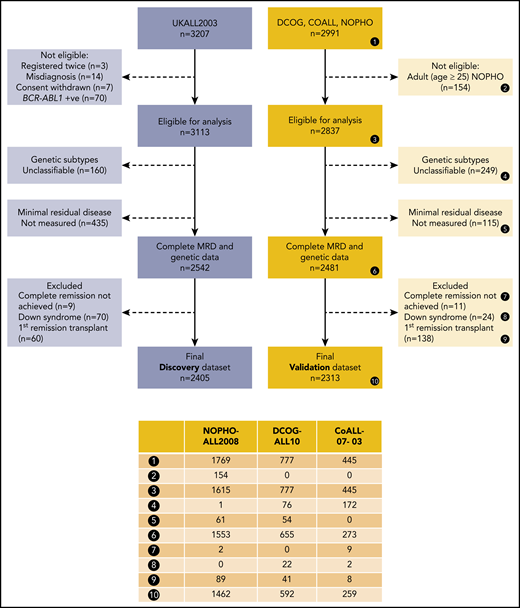
CONSORT diagram for the discovery and validation data sets. To enable meaningful cross-cohort comparison, we applied multiple exclusion criteria. Patients who did not achieve complete remission were excluded, because no meaningful MRD value could be measured. Patients who underwent stem cell transplantation (SCT) in first remission were excluded because each trial used different selection criteria. Patients with BCR-ABL1 fusion or Down syndrome and those age >25 years were excluded because they were not eligible for ≥1 cohort. Excluded patients (dotted boxes) were counted in each applicable category.
CONSORT diagram for the discovery and validation data sets. To enable meaningful cross-cohort comparison, we applied multiple exclusion criteria. Patients who did not achieve complete remission were excluded, because no meaningful MRD value could be measured. Patients who underwent stem cell transplantation (SCT) in first remission were excluded because each trial used different selection criteria. Patients with BCR-ABL1 fusion or Down syndrome and those age >25 years were excluded because they were not eligible for ≥1 cohort. Excluded patients (dotted boxes) were counted in each applicable category.
Event-free survival was defined as time to relapse, second tumor, or death, with censoring at date of last contact. Relapse rate (RR) was defined as time to relapse for those achieving complete remission, with censoring at date of death in remission or last contact. Overall survival (OS) was defined as time to death, with censoring at date of last contact. Detailed definitions of relapses have been published.1,3,7-9 Briefly, relapses were defined by morphology and site involvement by the presence of leukemic blasts (marrow, ≥5%; central nervous system, ≥5 × 10⁶/L). Standard-risk (SR) relapses comprised late (>6 months after stopping frontline therapy) isolated extramedullary (EM) relapses, BCP-ALL late relapses involving the bone marrow or early (<6 months from stopping frontline therapy) isolated EM and combined relapses, and T-ALL patients with early isolated EM relapses. HR relapses comprised patients with a very early relapse (<18 months from initial diagnosis), all patients with HR cytogenetics, T-ALL relapses involving the marrow, and BCP-ALL patients with early isolated bone marrow relapses.13
Univariate Cox regression analysis was used to estimate the risk of relapse associated with individual risk factors. Multivariate Cox regression analysis was used to build a model for predicting relapse. We used 2 modeling strategies: forward selection (adding each variable to the model [according to the univariate hazard ratio and P value] and only retaining variables if they improved the fit of the model) and backward selection (all variables started off in the model, with nonsignificant variables removed according to their P value and checking that their removal did not reduce the fit of the model). Models were checked for interactions (collinearity) and were compared using the likelihood ratio test, and a threshold of P = .05 was applied to retain or exclude individual variables. The proportionality assumption of the models was assessed by visualizing the log-log plot of survival and the Kaplan-Meier and predicted survival plots and tested using Schoenfeld residuals. The final model was internally validated using cross-validation techniques (100 repeats of a random 70% selection) and bootstrapping (1000-fold).14 The fit of the final model was assessed using Harrell’s concordance index. The discrimination, calibration, and fit of the model was validated using the principles and methods described by Royston and Altman.15 The model was calibrated by comparing the predicted and observed even probabilities. Forest plots and the test of heterogeneity were used to examine hazard ratios across different patient subgroups or cohorts. The area under the receiver operator characteristic curve was used to compare the predictive power of the prognostic index and the original trial risk groups. To identify the thresholds for the exemplar risk groups, we sorted the prognostic index, divided the cohort into bins comprising 25 cases (∼1% cohort), and sequentially tested each threshold until the exemplar clinical criteria were met. Because of the investigative nature of this analysis, all tests were conducted at the 1% significance level. All analyses were performed using Intercooled Stata 15.0 (Stata Corporation, College Station, TX).
Results
Development of the prognostic index using the discovery cohort
Univariate Cox regression analysis of 2405 patients treated on UKALL2003 revealed all major risk factors were associated with significant increases or decreases in the risk of relapse (Table 1). Next, we performed multivariate Cox regression modeling to identify the minimum number of independent variables required to predict relapse. The final model comprised τ(MRD), WCC, and genetics (Table 1). None of the other variables considered improved the ability of this model to predict relapse. Using the coefficients from this model, we derived a linear model (Figure 2A) from which we calculated patient-specific risk scores. This prognostic index (PIUKALL) was directly associated with risk of relapse (Figure 2B). Univariate models of the PI as a linear variable gave hazard ratios of 2.5 to 3.2 for event-free survival, RR, and OS (Figure 2D). Sensitivity analyses revealed that these hazard ratios were consistent across all major patient and treatment subgroups, including T-ALL, illustrating the robustness of PIUKALL to predict outcome independently of other risk factors and at different treatment intensities (supplemental Figure 1).
Univariable and multivariable Cox models for the risk of relapse for patients treated on UKALL2003
| Model | Variable structure | Hazard ratio for risk of relapse (95% CI) | Coefficient (95% CI) | P |
|---|---|---|---|---|
| Univariate | ||||
| Sex | Male vs female | 1.39 (1.04-1.84) | 0.33 (0.05-0.61) | .022 |
| Age, y | Continuous | 1.06 (1.03-1.08) | 0.06 (0.03-0.08) | <.001 |
| WCC, × 109/L* | Continuous (log) | 1.27 (1.16-1.39) | 0.24 (0.15-0.33) | <.001 |
| CNS disease† | Yes vs no | 3.09 (1.59-6.03) | 1.12 (0.46-1.80) | .001 |
| T-cell status | Yes vs no | 1.85 (1.30-2.63) | 0.61 (0.26-0.96) | .001 |
| τ(MRD)‡ | Continuous (log) | 0.79 (0.75-0.82) | −0.24 (−0.28 to −0.20) | <.001 |
| Slow early responder | Yes vs no | 2.99 (2.18-4.11) | 1.09 (0.78-1.41) | <.001 |
| Cytogenetic risk group | ||||
| Good risk§ | Yes vs no | 0.39 (0.30-0.52) | −0.94 (−1.22 to −0.66) | <.001 |
| High risk‖ | Yes vs no | 3.92 (2.45-6.28) | 1.37 (0.89-1.84) | <.001 |
| Multivariate¶ | ||||
| τ(MRD)‡ | Continuous (log) | 0.80 (0.77-0.84) | −0.22 (−0.26 to −0.18) | <.001 |
| Cytogenetic good risk§ | Yes (1) vs no (0) | 0.64 (0.47-0.88) | −0.43 (−0.75 to −0.13) | .005 |
| Cytogenetic HR‖ | Yes (1) vs no (0) | 2.90 (1.79-4.72) | 1.07 (0.58-1.55) | <.001 |
| WCC* | Continuous (log) | 1.15 (1.05-1.26) | 0.14 (0.05-0.23) | .003 |
WCC was transformed as follows: ln(WCC)+1.
Central nervous system (CNS) disease at diagnosis defined as the presence of >5 unequivocal lymphoblasts per mm3 in the cerebrospinal fluid (CSF) or cranial nerve palsy, parenchymal brain infiltrate, or ocular infiltrate even in the absence of CSF blasts.
τ(MRD) described in “Methods.”
HR cytogenetics: KMT2A fusions, near haploidy, low hypodiploidy, iAMP21, and TCF3-HLF.
All variables significant in univariate analysis were included in multivariate modeling.
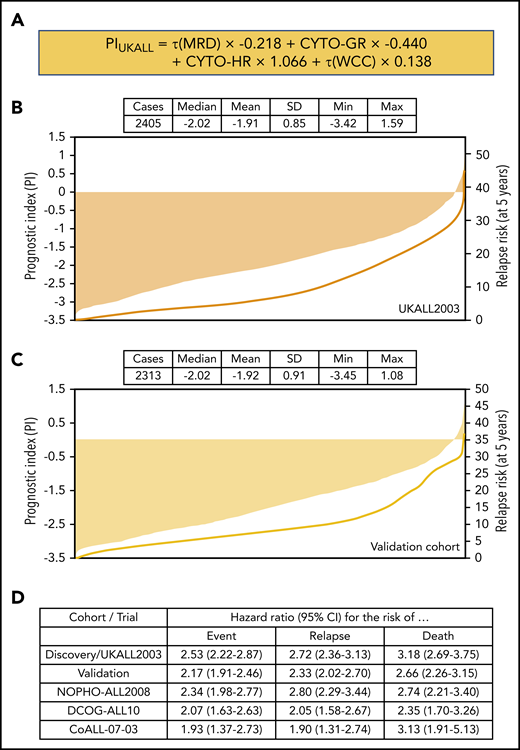
Definition and distribution of the UKALL prognostic index, along with association with risk of relapse. (A) The linear model derived from the coefficients of the multivariate model. (B-C) Bar charts show the distribution of the patient-specific prognostic index values derived from the model for the discovery (B) and validation (C) cohorts. The in-laid table gives the mean, median, standard deviation (SD), and minimum/maximum values of the distribution. The line shows the smoothed risk of relapse estimated for 10 equal-sized subgroups. (D) Table shows hazard ratios for the UKALL prognostic index as a continuous variable from univariate Cox models across the 2 cohorts and 3 trials within the validation cohort. CYTO-GR, cytogenetic good risk; CYTO-HR, cytogenetic HR; τ(WCC), log-transformed WCC value.
Definition and distribution of the UKALL prognostic index, along with association with risk of relapse. (A) The linear model derived from the coefficients of the multivariate model. (B-C) Bar charts show the distribution of the patient-specific prognostic index values derived from the model for the discovery (B) and validation (C) cohorts. The in-laid table gives the mean, median, standard deviation (SD), and minimum/maximum values of the distribution. The line shows the smoothed risk of relapse estimated for 10 equal-sized subgroups. (D) Table shows hazard ratios for the UKALL prognostic index as a continuous variable from univariate Cox models across the 2 cohorts and 3 trials within the validation cohort. CYTO-GR, cytogenetic good risk; CYTO-HR, cytogenetic HR; τ(WCC), log-transformed WCC value.
Validation of the prognostic index
PIUKALL was validated using 2313 patients derived from 3 contemporaneous clinical trials with equivalent baseline characteristics and outcomes (Figure 1; supplemental Figure 2; supplemental Table 2). The distribution of EOI MRD was significantly different across the trials (supplemental Figure 4), reflecting the different induction regimens (supplemental Table 1). We calculated a PIUKALL score for each patient in the validation cohort using the same linear model (Figures 2A and 3A) and observed equivalent distributions in the combined validation cohort, in individual data sets, by National Cancer Institute (NCI) risk group, and by immunophenotype despite differences in MRD methodology and EOI distributions (Figure 2B-C; supplemental Figures 3 and 5). As in the discovery cohort, a rising PIUKALL was associated with relapse, and each unit increase produced comparable hazard ratios for all 3 end points considered (Figure 2D), which were stable across patient and treatment subgroups (supplemental Figure 5). Additional validation tests confirmed the ability of PIUKALL to predict outcome in both low-risk (LR) and HR patients (supplemental Figure 6) and confirmed that each component of the prognostic index contributed equivalently in the individual validation data sets (supplemental Figure 7).
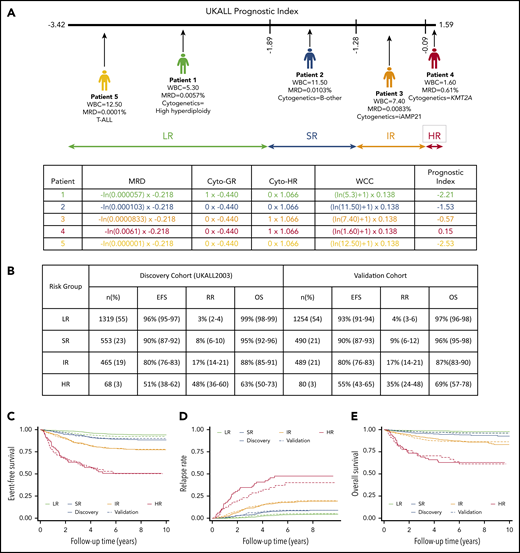
Demonstration of the clinical utility of PIUKALL. (A) Visualization of 4 example patients on a pseudonomogram. The precise thresholds for defining each risk group were as follows: LR, ≤ −1.894893; SR, ≤ −1.279577; IR, ≤ −0.0856656; and HR, > −0.0856656. Table shows details of how the index was calculated for each patient. (B) Number of cases and event-free survival (EFS) rate, RR, and OS rate at 5 years for the 4 risk groups in both the discovery and validation cohorts. (C-E) Kaplan-Meier plots of EFS (C), RR (D), and OS (E). ln, natural log.
Demonstration of the clinical utility of PIUKALL. (A) Visualization of 4 example patients on a pseudonomogram. The precise thresholds for defining each risk group were as follows: LR, ≤ −1.894893; SR, ≤ −1.279577; IR, ≤ −0.0856656; and HR, > −0.0856656. Table shows details of how the index was calculated for each patient. (B) Number of cases and event-free survival (EFS) rate, RR, and OS rate at 5 years for the 4 risk groups in both the discovery and validation cohorts. (C-E) Kaplan-Meier plots of EFS (C), RR (D), and OS (E). ln, natural log.
Using PIUKALL as a linear variable resulted in significantly improved C-indexes compared with the SR groups (Table 2). Furthermore, we used PIUKALL to define comparable risk groups, in terms of number and size, for NOPHO-ALL2008 and DOCG-ALL10 patients (n = 2053; supplemental Table 4). Using the PIUKALL-defined risk groups would have resulted in 762 patients (37%) being assigned to a different risk group, with 384 (19%) assigned to more treatment and 378 (18%) to less therapy. Importantly, the outcome of the patients who would have moved risk groups fitted more closely with the PIUKALL-defined risk group than the original risk group (supplemental Table 4).
Cox models for RR, EFS, and OS using the UKALL prognostic index and original risk definition in the discovery and validation cohorts
| Outcome measure/prognostic factor | Harrell’s concordance index (95% CI) | |||
|---|---|---|---|---|
| Discovery cohort | Validation cohorts | |||
| EFS | ALL2003 | DCOG-ALL10 | COALL-07-03 | NOPHO-ALL2008 |
| Model 1: PIUKALL, linear variable | 0.73 (0.69-0.76) | 0.68 (0.61-0.74) | 0.70 (0.61-0.78) | 0.70 (0.66-0.75) |
| Model 2: PIUKALL, 4 categories | 0.70 (0.67-0.74) | 0.64 (0.57-0.70) | 0.68 (0.60-0.76) | 0.68 (0.63-0.72) |
| Model 3: Original risk groups | 0.60 (0.57-0.64) | 0.59 (0.52-0.65) | 0.51 (0.43-0.60) | 0.66 (0.62-0.71) |
| RR | ALL2003 | DCOG | COALL | NOPHO |
| Model 1: PIUKALL, linear variable | 0.74 (0.70-0.77) | 0.68 (0.61-0.75) | 0.69 (0.60-0.79) | 0.76 (0.72-0.81) |
| Model 2: PIUKALL, 4 categories | 0.72 (0.68-0.75) | 0.64 (0.57-0.71) | 0.69 (0.59-0.78) | 0.73 (0.69-0.78) |
| Model 3: Original risk groups | 0.61 (0.57-0.64) | 0.55 (0.49-0.62) | 0.50 (0.41-0.59) | 0.68 (0.62-0.73) |
| OS | ALL2003 | DCOG | COALL | NOPHO |
| Model 1: PIUKALL, linear variable | 0.79 (0.75-0.82) | 0.73 (0.65-0.81) | 0.83 (0.76-0.90) | 0.74 (0.68-0.80) |
| Model 2: PIUKALL, 4 categories | 0.76 (0.72-0.80) | 0.67 (0.58-0.77) | 0.80 (0.71-0.89) | 0.73 (0.67-0.79) |
| Model 3: Original risk groups | 0.65 (0.61-0.69) | 0.67 (0.59-0.74) | 0.59 (0.48-0.70) | 0.70 (0.64-0.76) |
EFS, event-free survival; OS, overall survival; RR, relapse rate.
Clinical benefit of using the prognostic index in protocol design
To explore the usefulness of PIUKALL to define novel clinically meaningful risk groups, we used a scenario whereby a hypothetical new trial required patients to be assigned to 4 risk groups. The criteria for the groups were: LR group comprising ∼50% of cases, with an RR of <5% and OS ∼98%, which could be considered for treatment deintensification; HR group comprising ∼5% of cases, with an RR >40%, which could be considered for experimental therapy; and equal-sized SR and IR groups with RR <10% or >10%, respectively, which could be randomized to novel agents or schedules. Because PIUKALL is a continuous variable, thresholds that define subgroups of the required size and outcome were readily identifiable (Figure 3). Importantly, applying the same thresholds to the validation cohort produced subgroups of near-identical size and outcome (Figure 3).
To demonstrate how a PIUKALL-driven system improved the classification of UKALL2003 patients, we compared the distribution and outcome of patients using the 2 systems (supplemental Figure 8). There was a strong correlation between the 2 classifications (eg, NCI HR and T-ALL patients were more common in IR/HR than in BCP-ALL or NCI SR patients [P < .001]; supplemental Figure 3). Such a correlation was expected because they use the same risk factors. However, the PIUKALL-driven classification offered greater granularity. In particular, there were 229 patients (12%) treated with lower-intensity regimens (A/B), which PIUKALL identified as IR/HR. These patients had a higher RR compared with those patients classified as LR/SR (4% vs 21%; P < .0001). In contrast, the RR of the 250 patients (45%) treated as HR on regimen C,3 but identified by PIUKALL as LR/SR, was significantly lower than that of the remaining patients treated with regimen C3 (6% vs 21%; P < .0001). The RR in the 4 PIUKALL-defined risk groups was clearly distinct, rising from 3% to 48% in the discovery cohort (Figure 3). Examining the distribution of relapses also showed significant benefit for PIUKALL, with the LR group accounting for 55% cases but only 25% relapses, significantly better than regimen A, which accounted for 51% cases and 36% relapses (P = .014). Clearly, the PIUKALL HR group was highly significantly enriched for relapses (supplemental Figure 8), but it was striking that the IR group, although slightly smaller than the UKALL2003 HR group (19% vs 23%), captured the same proportion of relapses (38% vs 38%). Patients with SR relapses (supplemental Methods) have a better outcome than patients with HR relapses.13 It is noteworthy that the proportion of relapses that were HR relapses differed across the 4 PIUKALL risk groups: LR, 4 (7%) of 54; SR, 19 (41%) of 46; IR, 41 (50%) of 82; and HR, 26 (84%) of 31 (P < .0001; supplemental Figure 8).
The risk stratification algorithms used by each trial in the validation cohort were different (supplemental Table 1), and the distribution of cases across the SR, IR, and HR groups was 45%, 46%, and 9%, respectively, which is different to UKALL2003. Accordingly, there was a very strong correlation between the original and PIUKALL-defined HR groups (supplemental Figure 9). In this scenario, the benefit of the PIUKALL-defined risk groups was shown most clearly within the IR group, which comprised 46% patients with an RR of 8%. PIUKALL identified 398 patients (42%) with a significantly lower RR (4%; P = .04), 305 (32%) with a higher RR (13%; P < .001), and 18 (2%) with a much higher RR (47%; P < .001). As in the discovery cohort, there was a strong relationship between PIUKALL group and percentage of HR relapses: LR, 11 (21%) of 52; SR, 17 (46%) of 37; 41 (62%) of 82; and 21 (88%) of 24 (P < .0001; supplemental Figure 9).
The UK trial, UKALL2011, used EOI MRD and HR cytogenetics to assign patients to HR treatment with regimen C. Applying these risk criteria to the UKALL2003 cohort resulted in a stronger correlation with the PIUKALL-driven risk groups (supplemental Figure 10). In this scenario, the advantage of PIUKALL was the identification of 198 (17%) and 428 patients (37%) assigned to HR treatment by the traditional algorithm, but who had low PIUKALL scores and RRs of 2% and 7%, respectively. Therefore, although the UKALL2011 criteria captured 73% relapses in the HR group, it was at a cost of assigning 48% patients to more intensive chemotherapy.
Impact of the prognostic index in special patient subgroups
SCT is an important treatment option for HR patients but carries a significant risk of treatment-related mortality. The criteria used to select patients for SCT in first remission differed by trial, so we excluded these patients from the cohort used to develop PIUKALL (Figure 1; supplemental Table 1). To assess whether PIUKALL could reliably identify these HR patients despite their omission from the discovery cohort, we retrospectively calculated PIUKALL for these 235 patients. We found that 134 patients (57%) had PIUKALL values that assigned them to the HR group, 83 (35%) to the IR group, and just 8% to the LR and SR groups combined. This was different to the overall distribution of cases across these 4 subgroups: HR, 3%; IR, 20%; SR, 22%; and LR, 55%, respectively (P < .0001). Interestingly, when we examined each trial separately, we observed that SCT patients assigned by PIUKALL to the IR group had significantly or borderline better OS than SCT patients assigned to the HR group: UKALL2003, 87% (95% confidence interval [CI], 83%-89%) vs 81% (95% CI, 77%-83%; P = .02); DCOG-ALL10, 86% (95% CI, 77%-92%) vs 80% (95% CI, 72%-85%; P = .09); and NOPHO-ALL2008, 86% (95% CI, 82%-89%) vs 67% (95% CI, 59%-74%; P < .001).
During the development of PIUKALL, we considered 7 established chromosomal abnormalities. To examine the impact of PIUKALL in the context of newly defined genomic abnormalities, we calculated PIUKALL for patients treated on UKALL2003/DCOG-ALL10 harboring an ABL-class fusion, IKZF1 deletion, or CRLF2 rearrangement and according to the UKALL copy-number alteration (CNA) profile.11,12 Twenty-nine patients with an ABL-class fusion were identified, and these patients were unevenly distributed across the 4 risk groups: LR, SR, IR, and HR numbers were 1, 1, 5, and 22, respectively. In keeping with previous observations,16 >50% (15 of 27) ABL-class patients classified in the IR/HR groups experienced an adverse event within 5 years. In contrast, when we calculated PIUKALL values for the patients with an IKZF1 deletion or CRLF2 gene rearrangement, they were more evenly distributed across the 4 risk groups: LR/SR and IR/HR percentages were 63%:37% and 57%:43%, respectively. Patients with an IKZF1 deletion who were assigned by PIUKALL to the IR/HR groups had a significantly inferior outcome (supplemental Table 5). As expected, UKALL CNA good-risk patients were more likely to be assigned to the lower-risk groups compared with the UKALL CNA poor-risk patients (P = .001; supplemental Table 5). For both UKALL CNA good- and poor-risk patients, there was a significant difference in outcome when stratified by PIUKALL-defined risk groups (supplemental Table 4).
Discussion
We have developed and validated a prognostic index, PIUKALL, which uses 4 weighted variables representing disease burden, treatment response, and genetics. The key feature of the index is the use of continuous data for WCC and MRD, which outputs patient-specific rather subgroup-specific risks (Figures 2 and 3). One of the major strengths of the index is that it was developed and validated using large, well-annotated cohorts of patients treated on modern protocols. Although all 4 trials produced equivalent outcomes, they did so using different risk-stratification algorithms, MRD methodologies, and treatment regimens. It is particularly noteworthy that PIUKALL was validated using the NOPHO2008 cohort, because in this trial, MRD was measured by flow cytometry; despite this key difference, the contribution of the τ(MRD) variable to the model was almost identical (supplemental Figure 7). This variation demonstrates the robustness of PIUKALL and clinical applicability.
The key question for any novel prognostic marker or system relates to its clinical impact and deliverability. We have demonstrated that PIUKALL is better than the current algorithms, despite using fewer variables. Using PIUKALL does not require any new variables or data; it simply uses existing information more efficiently (Figure 3). PIUKALL is a continuous variable, so it can define the number and size of risk groups that match the treatment options or randomizations being considered, rather than the other way round. This is a significant advantage over traditional systems as well as newly described integrated risk scores.17 The validation of the exemplar risk groups in an independent cohort (Figure 3) illustrates that PIUKALL can be implemented without further development. PIUKALL has been designed to assist with the allocation of patients to risk groups at EOI and does not preclude the reallocation of patients at other time points in light of additional information (eg, refractory disease). PIUKALL is flexible and can be used to define all risk groups or split a preexisting IR group, as illustrated in the validation cohort (supplemental Figure 9), where PIUKALL can identify subsets of this group that have very different outcomes. Therefore, like other risk factors, PIUKALL is best employed in conjunction with other decision-making tools. In addition, a strategy for dealing with missing data would be required. Here, PIUKALL has the advantage that only a small number of variables are required for its implementation, and importantly, all the variables are already assessed in most modern protocols, so no new tests are required. Novel strategies for improving MRD detection and the advent of genomic technologies will minimize the number of patients with missing MRD and genetic data.18,19 PIUKALL can be used now to improve the allocation of patients to risk groups as well as provide a flexible method for designing a trial with more than the traditional number of risk groups.
Improvement in outcome for LR patients must focus primarily on reducing treatment-related mortality, which accounts for almost half of the deaths in this group.20 Therefore, it is essential that such patients are identified early and treated on low-intensity protocols to reduce mortality and morbidity.21 Using PIUKALL, we have demonstrated that it is feasible to define an LR group with an RR of <5%. The advent of highly effective novel therapies, such as chimeric antigen receptor T-cell therapy, provides the exciting possibility of cure in very HR patients.22 However, the widespread use of such therapies will be limited by cost and complexity; therefore, it is essential that they are used to treat the most appropriate patients. Current classifications can struggle to define clinically useful HR groups. For example, the UKALL2011 classification system assigns HR patients to regimen C3 treatment, capturing a very high percentage of relapses, but it comprises nearly 50% of patients and has an overall relapse risk of 13%.
PIUKALL can be used to define 2 clinically useful higher-risk groups: the IR group, which comprises ∼20% cases, captures ∼40% relapses, and has an RR of ∼15% to 20% and could be suitable for novel drugs, and a small HR group with extremely poor outcome that could be used to assign patients to more experimental therapies. Crucially, given the recent increase in novel therapies, it allows the selection of specific patient risk groups for the precise allocation of treatment. All retrospective studies proposing new risk factors or prognostic indices are limited by the fact that the patients were treated according to different criteria. Identifying risk factors associated with HR of relapse among patients treated on lower-intensity protocols is relatively straightforward. However, the reverse is more complicated. We have presented data suggesting that some patients treated according to UKALL2003 regimen C3 (a high-intensity protocol) have an LR of relapse and therefore should be prospectively assigned to an LR or SR group. Although these patients could be genuine LR patients, it is also possible that they only had an LR of relapse because they received more intensive therapy. Retrospective studies cannot distinguish between these 2 scenarios. However, there is indirect evidence to support our assertion that they are truly LR patients. Firstly, 72 (88%) of 82 patients treated with UKALL2003 regimen C3 and classified but PIUKALL into the LR group had a good-risk chromosomal abnormality: ETV6-RUNX1 or high hyperdiploidy. Patients with good-risk chromosomal abnormalities have excellent outcomes despite moderate levels of MRD after induction.4 Secondly, the difference in RR between UKALL2003 HR patients stratified into the PIUKALL LR and HR groups is substantial: 4% to 43%. Although treatment intensification reduces relapse risk, no one has ever reported such a large drop in RR.
Even though PIUKALL is based purely on MRD, WCC, and a few genetic abnormalities, sensitivity analyses demonstrated its effectiveness across the patient spectrum (supplemental Figures 1 and 5). Both age and T-cell status correlate strongly with all of these risk factors, which probably explains why they did not make it into the model. Developing and validating prognostic indices requires large uniformly annotated cohorts with extensive follow-up. We were only able to consider the 7 established chromosomal abnormalities in pediatric ALL. Therefore, a limitation of PIUKALL is that newly defined HR and LR abnormalities will not receive any weighting within the model. However, many HR genetic abnormalities correlate with WCC and MRD23 and so are likely to have high PIUKALL values based on these risk factors alone. When we examined the distribution and outcome of patients with ABL-class fusions and key CNA, we observed a strong correlation with PIUKALL-defined risk groups but also evidence of the additional predictive power associated with applying a multivariate rather than a univariate risk model. Nevertheless, it is likely that in the future, when comprehensive screening of large cohorts becomes feasible, recalibration of the index incorporating additional genomic and genetic data will improve its accuracy. The fact that PIUKALL does not rely on expensive genomic analyses means it can be employed in a wide range of countries, including those with limited resources.
In summary, we have integrated multiple variables, including continuous data, into a single numeric prognostic index validated in independent data sets. PIUKALL allocates individual risk scores to enable accurate selection of patients with an explicit risk of relapse for the precise allocation of treatment. This novel approach to risk stratification offers clear benefits over current algorithms and could be adopted immediately, because it does not require the generation of any novel information. This study demonstrates that the future of risk stratification in ALL lies in integrating all known risk factors and using all the available data with continuous variables.
For original data, please contact the corresponding author.
The online version of this article contains a data supplement.
The publication costs of this article were defrayed in part by page charge payment. Therefore, and solely to indicate this fact, this article is hereby marked “advertisement” in accordance with 18 USC section 1734.
Acknowledgments
The authors thank all the patients who took part in this trial as well as their families, and acknowledge the input of all the scientists and technicians working in the MRD laboratories: Bristol Genetics Laboratory, Southmead Hospital, Bristol, United Kingdom; Molecular Biology Laboratory, Royal Hospital for Sick Children, Glasgow, United Kingdom; Molecular Haematology Laboratory, Royal London Hospital, London, United Kingdom; Molecular Genetics Service, Sheffield Children’s Hospital, Sheffield, United Kingdom; University Medical Center Rotterdam, Rotterdam, The Netherlands; and Sanquin Research, Amsterdam, The Netherlands.
This study was supported by research grants from Blood Cancer UK (formerly Bloodwise) and Children with Cancer. The authors thank the member laboratories of the UK Cancer Cytogenetic Group for cytogenetic data and material. Primary childhood leukemia samples used in this study were provided by the Blood Cancer UK Childhood Leukaemia Cell Bank, working with the aforementioned MRD laboratories.
Authorship
Contribution: A.V.M., A.E., D.O., J.B., and J.M. were responsible for conception and design; A.V.M., J.B., J.H., C.J.H., C.S., M.L.d.B., J.M.B., H.A.d.G.-K., H.V.M., U.N.-N., and J.M. were responsible for collection and assembly of data; A.E., A.V.M., D.O., and J.M. were responsible for data analysis and interpretation; C.J.H. and A.V.M. provided financial and administrative support; R.H., S.S., H.V.M., U.N.-N., K.S., M.A.H., G.E., M.H., R.P., A.V., and J.M. provided study materials or patients; A.V.M. and A.E. wrote the manuscript; and all authors provided final approval of the manuscript.
Conflict-of-interest disclosure: The authors declare no competing financial interests.
Correspondence: Anthony V. Moorman, Leukaemia Research Cytogenetics Group, Wolfson Childhood Cancer Research Centre, Translational and Clinical Research Institute, Newcastle University, Level 6, Herschel Building, Brewery Lane, Newcastle upon Tyne, NE1 7RU, United Kingdom; e-mail: anthony.moorman@ncl.ac.uk.

This feature is available to Subscribers Only
Sign In or Create an Account Close Modal