

Key Points
Early identification of ultra-risk DLBCL patients is needed to aid stratification to alternative treatment approaches.
High baseline TMTV (±ECOG) was a strong prognosticator of inferior PFS and OS in REMARC patients post-R-CHOP, irrespective of maintenance.

Abstract
Early identification of ultra-risk diffuse large B-cell lymphoma (DLBCL) patients is needed to aid stratification to innovative treatment. Previous studies suggested high baseline total metabolic tumor volume (TMTV) negatively impacts survival of DLBCL patients. We analyzed the prognostic impact of TMTV and prognostic indices in DLBCL patients, aged 60 to 80 years, from the phase 3 REMARC study that randomized responding patients to R-CHOP (rituximab plus cyclophosphamide, doxorubicin, vincristine, and prednisone) into maintenance lenalidomide or placebo. TMTV was computed on baseline positron emission tomography/computed tomography using the 41% maximum standardized uptake value method; the optimal TMTV cutoff for progression-free (PFS) and overall survival (OS) was determined and confirmed by a training validation method. There were 301 out of 650 evaluable patients, including 192 patients classified as germinal center B-cell–like (GCB)/non-GCB and MYC/BCL2 expressor. Median baseline TMTV was 238 cm3; optimal TMTV cutoff was 220 cm3. Patients with high vs low TMTV showed worse/higher Eastern Cooperative Oncology Group performance status (ECOG PS) ≥2, stage III or IV disease, >1 extranodal site, elevated lactate dehydrogenase, International Prognostic Index (IPI) 3-5, and age-adjusted IPI 2-3. High vs low TMTV significantly impacted PFS and OS, independent of maintenance treatment. Although the GCB/non-GCB profile and MYC expression did not correlate with TMTV/survival, BCL2 >70% impacted PFS and could be stratified by TMTV. Multivariate analysis identified baseline TMTV and ECOG PS as independently associated with PFS and OS. Even in responding patients, after R-CHOP, high baseline TMTV was a strong prognosticator of inferior PFS and OS. Moreover, TMTV combined with ECOG PS may identify an ultra-risk DLBCL population. This trial was registered at www.clinicaltrials.gov as #NCT01122472.
Medscape Continuing Medical Education online
In support of improving patient care, this activity has been planned and implemented by Medscape, LLC and the American Society of Hematology. Medscape, LLC is jointly accredited by the Accreditation Council for Continuing Medical Education (ACCME), the Accreditation Council for Pharmacy Education (ACPE), and the American Nurses Credentialing Center (ANCC), to provide continuing education for the healthcare team.
Medscape, LLC designates this Journal-based CME activity for a maximum of 1.00 AMA PRA Category 1 Credit(s)™. Physicians should claim only the credit commensurate with the extent of their participation in the activity.
Successful completion of this CME activity, which includes participation in the evaluation component, enables the participant to earn up to 1.0 MOC points in the American Board of Internal Medicine's (ABIM) Maintenance of Certification (MOC) program. Participants will earn MOC points equivalent to the amount of CME credits claimed for the activity. It is the CME activity provider's responsibility to submit participant completion information to ACCME for the purpose of granting ABIM MOC credit.
All other clinicians completing this activity will be issued a certificate of participation. To participate in this journal CME activity: (1) review the learning objectives and author disclosures; (2) study the education content; (3) take the post-test with a 75% minimum passing score and complete the evaluation at http://www.medscape.org/journal/blood; and (4) view/print certificate. For CME questions, see page 1411.
Disclosures
Associate Editor Laurie H. Sehn served as an advisor or consultant for AbbVie Inc., Amgen Inc., Celgene Corporation, Janssen Pharmaceuticals, Inc., Karyopharm Therapeutics, Merck & Co., Inc., Roche/Genentech, Inc., Seattle Genetics, Inc., TG Therapeutics, Inc., Apobiologix, AstraZeneca, Acerta Pharma, Gilead, Kite Pharma, Lundbeck, MorphoSys, Teva, Takeda, and Verastem and received grants for clinical research from Roche/Genentech, Inc. Author Olivier Casasnovas served as advisor or consultant for Celgene, Roche, Takeda, Gilead, BMS, Merck, Abbvie, and Janssen and received grants for clinical research from Roche, Takeda, and Gilead. Author Hervé Tilly received grants for clinical research from Celgene; received personal fees and non-financial support from Roche; and received personal fees from Takeda, Janssen, Gilead, and Karyopharm. Author Pierre Feugier received honoraria and travel accommodations from and had a consulting/advisory role with Roche/Genentech, Janssen, Gilead, and Abbvie. Author Lucie Oberic received funding from Roche. Author Vincent Ribrag served as advisor or consultant for Infinity Pharmaceuticals, BMS, PharmaMar, Gilead Sciences, NanoString Technologies, Incyte, BMS, MSD, Roche/Genentech, Epizyme, AstraZeneca, and Immune Design; received grants for clinical research from arGEN-X BVBA; AstraZeneca, BMS, Boehringer Ingelheim, Janssen Cilag, Merck, Novartis, Pfizer, Roche, and Sanofi; received patents, royalties, or other intellectual property regarding BAY1000394 studies on MCL from and provided expert testimony for Servier; and received travel, accommodations, and expenses from Roche, BMS, and AstraZeneca. Author Reda Bouabdallah received funding from Roche. Author Franck Morschhauser served as an advisor or consultant for Celgene, Roche, Gilead Sciences, Servier, Epizyme, BMS, Bayer, Novartis, and Janssen. Pascal Godmer was invited to a congress/conference by Celgene. Gilles Salles received financial compensation for participating in advisory boards or consulting from Abbvie, Autolus, Celgene, Gilead, Epizyme, Janssen, Karyopharm, Kite, Merck, Morphosys, Novartis, Roche, Servier, and Takeda and participated in educational events for Abbvie, Amgen, Celgene, Gilead, Janssen, Kite, Morphosys, Novartis, Roche, Servier, and Takeda. Philippe Gaulard received research funding from Takeda and Innate Pharma and is on the advisory board and received honoraria from Takeda. Author Catherine Thieblemont received honoraria from Roche, Amgen, Janssen, Celgene, Gilead Science/Kyte; had a consulting/advisory role with Roche, Gilead Sciences, Janssen, Celgene, and Novartis; and received research and received travel/accommodation expense funding from Roche and Novartis. CME questions author Laurie Barclay, freelance writer and reviewer, Medscape, LLC and the remaining authors declare no relevant financial relationships.
Learning objectives
Upon completion of this activity, participants will be able to:
Describe baseline total metabolic tumor volume (TMTV) and its prognostic value in patients with diffuse large B-cell lymphoma (DLBCL), ages 60 to 80 years, enrolled in the phase 3 REMARC study
Determine the prognostic value of other prognostic indices, alone and in combination with TMTV, in patients with DLBCL, ages 60 to 80 years, enrolled in the phase 3 REMARC study
Identify clinical implications of the prognostic value of TMTV and other prognostic indices in patients with DLBCL, ages 60 to 80 years, enrolled in the phase 3 REMARC study
Release date: April 16, 2020; Expiration date: April 16, 2021
Introduction
In the western world, the number of aging and elderly patients with diffuse large B-cell lymphoma (DLBCL) will rise continuously, since it is a disease with a typical median age at initial diagnosis of >70 years.1,2 Unsatisfactory treatment of these aging patients and decreasing overall survival (OS) rates are thus of great concern. Indeed, approximately one-third of elderly patients relapse or require retreatment within the first 24 months following first-line induction therapy.3 Effective salvage options after failure to standard R-CHOP (rituximab plus cyclophosphamide, doxorubicin, vincristine, and prednisone) induction are limited, particularly for the most elderly, who are ineligible for autologous stem cell transplantation.4-6 Therefore, innovative therapeutic strategies are needed to optimize induction and prevent or delay relapse after R-CHOP. This will require a refined risk-scoring approach for early identification of high-risk patients to aid stratification to modified and innovative treatment approaches. Prognostic indices such as the International Prognostic Index (IPI) do not stratify the very elderly patients.7-9 The recently devised National Comprehensive Cancer Network (NCCN) IPI has improved patient classification relative to age.10 Recently the results of the RICOVER-no-RTh cohort have shown that in elderly patients with aggressive lymphoma, tumor bulk >7.5 cm is a negative prognostic factor, in contrast to that observed in younger patients, leading to interest in the evaluation of tumor burden to help risk classification.11 Based on these findings, the total metabolic tumor volume (TMTV) measured by baseline fluorodeoxyglucose positron emission tomography/computed tomography (PET/CT) could be a useful tool. Indeed, several retrospective studies have shown in DLBCL that high baseline TMTV measured by fluorodeoxyglucose PET/CT was associated with worse progression-free survival (PFS) and/or OS.12-14 Furthermore, baseline TMTV differentiated risk groups when combined with cell of origin (COO), BCL2, and MYC12-14 or according to PET response to treatment.15,16 These data remain to be confirmed in elderly DLBCL patients.
The phase 3 REMARC study showed that lenalidomide maintenance significantly prolonged PFS compared with placebo in 650 DLBCL patients aged ≥60 years who had achieved a complete response (CR) or partial response (PR) to R-CHOP.17 No difference in OS between arms was found at a median follow-up of 52 months. Nearly half of these patients had a baseline PET/CT measurement. In the present study, we evaluated whether baseline TMTV demonstrated prognostic value in this group of elderly patients who responded to R-CHOP. We also analyzed the relationships among TMTV, clinical parameters, the maintenance treatment arms, and molecular profile to explore if additional prognostic indices could be identified.
Materials and methods
Study population
REMARC study design details have been reported elsewhere (registered at www.clinicaltrials.gov as #NCT01122472; the original study protocol is included as a data supplement available with the online version of this article).17 Briefly, 650 patients with CD20+ DLBCL or aggressive non-Hodgkin lymphoma, aged 60 to 80 years, Eastern Cooperative Oncology Group performance status (ECOG PS) 0-2, stage II-IV, and age-adjusted IPI (aaIPI) >1 who responded with a CR or PR by Cheson 2007 criteria18 after 6 or 8 cycles of standard R-CHOP given for 14- or 21-day cycles (R-CHOP14 or R-CHOP21) were included and randomized 1:1 to lenalidomide maintenance 25 mg/day or placebo for 21 of every 28-day cycle for 2 years. In REMARC, only a contrast-enhanced CT was required at baseline, and PET/CT was optional, but not mandatory. All imaging data were centralized during the trial on a dedicated platform.
For the current study, only patients with a baseline PET/CT available in the platform in an anonymized Digital Imaging and Communications in Medicine format and allowing measurement of baseline TMTV were included (supplemental Figure 1, available at the Blood Web site).
Baseline TMTV
Measurement of TMTV was performed by 2 senior nuclear medicine physicians (L.V. and A.-S.C.) who were blinded to patient outcomes and each analyzed a randomized half of the population.
TMTV was computed with the 41% maximum standardized uptake value threshold method as recommended by the European Association of Nuclear Medicine and published in various lymphoma subtypes.19 The free semiautomatic software Beth Israel Fiji20 was used (http://petctviewer.org).20 Regional volumes automatically identified by the software were checked by visual assessment to confirm inclusion of only pathological lesions. PET images were scaled using a fixed display and color table scaled to the standardized uptake value as recommended.21,22 TMTV was obtained by summing the metabolic volumes of all local (L) nodal and extranodal lesions. Bone marrow involvement was included in volume measurement only if there was focal uptake. Spleen was considered as involved and included if there was focal uptake or diffuse uptake >150% of the liver background.
Clinical data
Baseline patient and disease characteristics, including individual components of the IPI and survival data, were obtained. PFS was assessed by an independent review committee according to European Medical Agency censoring rule, and OS was defined according to revised National Cancer Institute criteria.
Pathology
Histologic diagnoses were centrally reviewed by expert pathologists (J.B., J.C., and P. Gaulard). Expression of CD10, BCL6, and MUM1 was examined by immunohistochemistry to classify all cases as germinal center B-cell-like (GCB) or non-GCB by the Hans algorithm.23
BCL2 and MYC expression
Statistical analysis
The optimal TMTV cutoff for PFS and OS was determined by X-tile analyses and confirmed by a training validation method. A random sample of two-thirds of the patients was the training cohort; the remaining one-third was the validation cohort. In the present study, PFS was measured from the date of randomization to the date of death from any cause, disease relapse or progression, or the date of last contact. OS was calculated from the date of randomization until the date of death from any cause or the date of last contact.17,18
Survival functions were calculated by Kaplan-Meier estimates and comparison between categories using the log-rank test. Characteristics of populations were compared using the χ2 or Fisher’s exact test for discrete variables and the Student t test or Mann-Whitney U test for continuous variables.
Variables considered for model building included TMTV results; treatment arm; and lactate dehydrogenase (LDH) level, β2 microglobulin, albumin, ECOG PS, Ann Arbor stage, time to treatment, IPI, and NCCN-IPI score in classes. Multivariable analyses were performed by using Cox proportional hazards models. For comparison with the IPI, each model’s discrimination was computed using Net Reclassification Improvement (NRI).25 A P value of ≤ .05 was considered statistically significant. Statistical analyses used SAS 9.3 and X-tile 3.6.1 software (Yale University, New Haven, CT).
Results
Population
In all, 360 out of 650 patients from the REMARC trial had baseline PET/CT. From those, 301 patients with baseline PET/CT allowing TMTV measurement were included in this study, accounting for 155 out of 323 patients in the lenalidomide arm of the whole trial and 146 out of 327 patients in the placebo arm (Figure 1). The GCB or non-GCB profile was determined in a subset of 192 patients, of whom 95 had an evaluation of BCL2 and MYC overexpression.
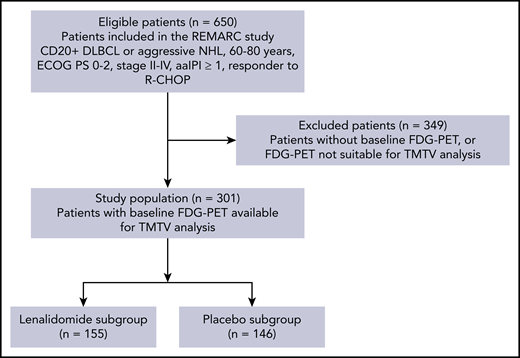
CONSORT flowchart of patients by TMTV analysis and treatment arm. FDG, fluorodeoxyglucose; NHL, non-Hodgkin lymphoma.
CONSORT flowchart of patients by TMTV analysis and treatment arm. FDG, fluorodeoxyglucose; NHL, non-Hodgkin lymphoma.
Clinical characteristics did not differ from the overall population of the trial,17 except for ECOG PS (17% of patients with an ECOG PS ≥2 in TMTV population vs 28% in non-TMTV population, P < .001) and number of induction cycles (71% of patients with >6 cycles of induction treatment in TMTV population vs 57% in non-TMTV population, P < .001). After a median follow-up of 5 years, 92 patients (31%) presented a PFS event and 56 patients (19%) presented an OS event; the 4-y PFS was 68% and 4-y OS was 83%, and they did not differ significantly from those of the entire trial. There was no difference between the clinical and biological characteristics of the 2 maintenance treatment arms of the trial (supplemental Appendix, Table A1). Following R-CHOP induction, a total of 226 (75%) patients were in CR and 74 (25%) of patients were in PR (Table 1).
Characteristics of patients based on baseline TMTV ≤220 or >220
| Characteristic, n (%) | TMTV ≤220 (n = 142) | TMTV >220 (n = 159) | P |
|---|---|---|---|
| Age (y), median (range) | 68 (58-78) | 68 (59-80) | .51 |
| Sex | .02* | ||
| Male | 73 (51) | 103 (65) | |
| Female | 69 (49) | 56 (35) | |
| Histology | .12 | ||
| DLBCL NOS | 98 (69) | 115 (72) | |
| FL grade 3B | 2 (1) | 1 (1) | |
| De novo transformed | 18 (13) | 8 (5) | |
| Other | 16 (11) | 15 (9) | |
| Central review missing | 8 (6) | 20 (13) | |
| ECOG PS | .029 | ||
| 0-1 | 123 (87) | 124 (78) | |
| ≥2 | 16 (11) | 33 (21) | |
| Missing | 3 (2) | 2 (1) | |
| Ann Arbor stage | .043 | ||
| I-II | 18 (13) | 9 (6) | |
| III-IV | 124 (87) | 150 (94) | |
| aaIPI | <.001 | ||
| 0-1 | 85 (60) | 41 (26) | |
| 2-3 | 56 (39) | 115 (72) | |
| Missing | 1 (1) | 3 (2) | |
| IPI | <.001 | ||
| 0-2 | 59 (42) | 23 (15) | |
| 3-5 | 82 (58) | 133 (84) | |
| Missing | 1 (1) | 3 (2) | |
| NCCN-IPI | <.001 | ||
| Low-intermediate | 54 (38) | 22 (14) | |
| High-intermediate | 67 (47) | 101 (64) | |
| High | 10 (7) | 29 (18) | |
| Missing | 11 (8) | 7 (4) | |
| Extranodal sites | <.001 | ||
| ≤1 | 86 (61) | 58 (37) | |
| >1 | 56 (39) | 101 (64) | |
| Elevated LDH (>ULN) | <.001 | ||
| No | 77 (54) | 41 (26) | |
| Yes | 64 (45) | 115 (72) | |
| Missing | 1 (1) | 3 (2) | |
| β2 microglobulin (mg/L) | <.001 | ||
| <3 | 76 (54) | 48 (30) | |
| ≥3 | 33 (23) | 69 (43) | |
| Missing | 33 (23) | 42 (26) | |
| Albumin (g/L) | .005 | ||
| ≤35 | 24 (17) | 47 (30) | |
| >35 | 93 (66) | 77 (48) | |
| Missing | 25 (18) | 35 (22) | |
| R-CHOP induction cycles | .45 | ||
| 6 | 45 (32) | 43 (27) | |
| 8 cycles | 97 (68) | 116 (73) | |
| Response to R-CHOP induction | .99 | ||
| CR | 107 (75) | 119 (75) | |
| PR | 35 (25) | 39 (25) | |
| ORR | 142 (100%) | 158 (99) |
All data are n (%) unless otherwise stated. Percentages may not sum to 100 because of rounding.
NOS, not otherwise specified; FL, follicular lymphoma; ORR, overall response rate; ULN, upper limit of normal.
Expected to be an artifact of multiple comparisons (no significant interaction was observed between gender and TMTV [P = .36] on PFS analysis).
Baseline TMTV
The median baseline TMTV was 238 cm3 (interquartile range [IQR], 78 to 523). Based on results from X-tile to determine the best TMTV cutoff,26 a TMTV threshold of 220 cm3 was selected and validated as the optimal cutoff for PFS and OS (supplemental Appendix). Sensitivity, specificity, and positive and negative predictive values and accuracy of this cutoff for PFS were 0.68, 0.54, 0.40, 0.80, and 0.58, respectively.
The area under the curve for the receiver-operating characteristic curves for PFS and OS were 0.64 and 0.66 respectively. Regions of focal spleen uptake were observed in 42 patients resulting in median metabolic volume of 119 cm3 (IQR, 14-286 cm3), and increased diffuse uptake was observed in 29 with a median metabolic volume of 372 cm3 (IQR, 127-713 cm3). The median baseline TMTV excluding the spleen volume was 197 cm3 (IQR, 64-412 cm3). A similar cutoff was found (224 cm3) for PFS and OS as when spleen was included.
TMTV measurement was highly reproducible. In a subset of 25 patients, there was no difference between the means; the Lin concordance correlation coefficient was 0.998 (95% confidence interval [CI], 0.996 to 0.999) between the 2 reviewers. The overall agreement using dichotomization for the 220 threshold was excellent (κ = 1.0).
The presence of a high TMTV (>220 cm3) was significantly associated with ECOG PS ≥ 2; stage III to IV disease; higher aaIPI, IPI, and NCCN-IPI scores; more extranodal sites; increased LDH and β2 microglobulin; and lower albumin (Table 1). The 159 patients with a high TMTV (>220 cm3) had a significantly worse outcome than the 142 patients with a lower TMTV (PFS: hazard ratio [HR], 2.3; 95% CI, 1.5 to 3.5; P = .0002; Figure 2A) (OS: HR, 3.3; 95% CI, 1.8 to 6.2; P = .0001; Figure 2B). For high vs low TMTV, the 4-year PFS was 56% vs 82% and 4-year OS was 74% vs 92%.

PFS and OS according to TMTV before R-CHOP and per maintenance treatment arms. (A) PFS for all patients, (B) OS for all patients, (C) PFS in patients receiving lenalidomide maintenance after R-CHOP, (D) PFS in patients receiving placebo after R-CHOP, (E) OS in patients receiving lenalidomide maintenance after R-CHOP, and (F) OS in patients receiving placebo after R-CHOP.
PFS and OS according to TMTV before R-CHOP and per maintenance treatment arms. (A) PFS for all patients, (B) OS for all patients, (C) PFS in patients receiving lenalidomide maintenance after R-CHOP, (D) PFS in patients receiving placebo after R-CHOP, (E) OS in patients receiving lenalidomide maintenance after R-CHOP, and (F) OS in patients receiving placebo after R-CHOP.
High TMTV remained significantly associated with worse PFS and OS in the lenalidomide arm (PFS: HR, 3.2; 95% CI, 1.5 to 6.6; P = .0009 for PFS; OS: HR, 3.0; 95% CI, 1.3 to 6.9; P = .005) and the placebo arm (PFS: HR, 1.8; 95% CI, 1.0 to 3.2; P = .039; OS: HR, 3.8; 95% CI, 1.4 to 9.9; P = .004; Figure 2C-F).
Hans score and BCL2 and MYC
Analysis of outcomes per Hans criteria23 did not show any significant impact for GCB (n = 91) and non-GCB (n = 101) patients on PFS (P = .82) or OS (P = .30). A significant impact of BCL2 expression on PFS (HR, 3.8; P = .0496) was found only with a 70% threshold. Patients with BCL2 ≥70% (n = 76) had a 4-year PFS of 58% vs 89% for patients with BCL2 <70% (n = 18) (P = .0496). No significant impact for OS was observed (P = .07). MYC overexpression did not impact outcomes irrespective of the positivity threshold of <70% vs ≥70% (P = .73 for PFS and P = .50 for OS) or <40% vs ≥40% (P = .99 for PFS and P = .98 for OS).
Baseline TMTV combined with clinical and biological parameters
In univariate analysis, Ann Arbor stage, LDH level, β2 microglobulin, time to treatment, and albumin were not associated with either PFS or OS. Among the IPI components, only ECOG PS ≥2 was significantly associated with both inferior PFS (HR, 2.3; 95% CI, 1.4 to 3.7) and OS (HR, 2.5; 95% CI, 1.4 to 4.4) (Tables 2 and 3). IPI score 3 to 5 was significantly associated with both inferior PFS (HR, 1.8; 95% CI, 1.1 to 3.1) and OS (HR, 2.9; 95% CI, 1.3 to 6.4). High-intermediate and high NCCN-IPI were significantly associated with inferior OS (HR, 3.3; 95% CI, 1.3 to 8.3 and HR, 2.3; 95% CI, 1.1 to 4.9, respectively), but not PFS.
Univariable and multivariable analyses for PFS
| Label | Modality | Univariable | Multivariable | ||||
|---|---|---|---|---|---|---|---|
| HR | 95% CI | P | HR | 95% CI | P | ||
| IPI | 3-5 | 1.8 | 1.1-3.1 | .0195 | |||
| TMTV | >220 | 2.3 | 1.5-3.5 | .0002 | 2.1 | 1.3-3.2 | .0018 |
| Treatment arm | Lenalidomide | 0.6 | 0.4-0.9 | .0152 | 0.6 | 0.4-0.9 | .0486 |
| NCCN-IPI score | High-intermediate | 2.0 | 1.0-3.9 | .035 | |||
| High | 1.4 | 0.8-2.3 | .22 | ||||
| ECOG PS | ≥2 | 2.3 | 1.4-3.7 | .0004 | 2.0 | 1.2-3.3 | .0044 |
| Ann Arbor stage | III-IV | 2.0 | 0.8-4.9 | .13 | |||
| LDH level | Elevated | 1.2 | 0.8-1.8 | .53 | |||
| β2 microglobulin | ≥3 mg/L | 1.3 | 0.8-2.1 | .23 | |||
| Albumin | >35 g/L | 0.7 | 0.4-1.1 | .08 | |||
| Time to treatment (days) | 1.0 | 0.99-1.0 | .53 | ||||
Univariable and multivariable analyses for OS
| Label | Modality | Univariable | Multivariable | ||||
|---|---|---|---|---|---|---|---|
| HR | 95% CI | P | HR | 95% CI | P | ||
| IPI | 3-5 | 2.9 | 1.3 to 6.4 | .0063 | |||
| TMTV | >220 | 3.3 | 1.8 to 6.2 | <.0001 | 3.1 | 1.6-5.7 | .0005 |
| Treatment arm | Lenalidomide | 1.0 | 0.6 to 1.7 | .90 | 1.2 | 0.7-2.0 | .5 |
| NCCN-IPI score | High-intermediate | 3.3 | 1.3 to 8.3 | .0097 | |||
| High | 2.3 | 1.1 to 4.9 | .0359 | ||||
| ECOG PS | ≥2 | 2.5 | 1.4 to 4.4 | .0011 | 2.2 | 1.3-4.0 | .0066 |
| Ann Arbor stage | III-IV | 2.9 | 0.7 to 12.0 | .14 | |||
| LDH level | Elevated | 1.3 | 0.8 to 2.3 | .31 | |||
| β2 microglobulin | ≥3 mg/L | 1.3 | 0.7 to 2.3 | .45 | |||
| Albumin | >35 g/L | 0.5 | 0.3 to 0.9 | .01 | |||
| Time to treatment (days) | 1.0 | 0.99 to 1.0 | .61 | ||||
A significant impact of treatment arm on PFS, but not OS, was observed as published for the entire trial (Tables 2 and 3). The 4-year PFS was 76% for patients treated with lenalidomide compared with 61% for patients receiving placebo (HR, 0.6; 95% CI, 0.4 to 0.9).
In patients with BCL2 ≥70%, a significant impact of TMTV on PFS (P = .0189) and OS (P = .0096) was observed. The 4-year PFS was 73% for patients with TMTV ≤220 compared with 35% for patients with TMTV >220. The 4-year OS was 85% for patients with TMTV ≤220 compared with 61% for patients with TMTV >220.
In multivariate analysis, 3 factors were independently associated with worse PFS: TMTV >220 (HR, 2.1), placebo maintenance (HR, 1.5), and ECOG PS ≥2 (HR, 2.0) (Table 2). There was no evidence of interaction between variables associated with PFS. Only 2 factors were independently associated with worse OS: TMTV >220 (HR, 3.1) and ECOG (HR, 2.2) (Table 3).
Combination of baseline TMTV and ECOG PS
A significant impact of combined variables (TMTV and/or ECOG PS [2 groups]) was observed on PFS and OS. Survival was better for patients with no risk factors (TMTV ≤220 and ECOG <2). The 4-year PFS was 82% for these patients compared with 63% for patients with 1 risk factor (either TMTV >220 or ECOG ≥ 2) and 41% for patients with 2 risk factors (TMTV >220 and ECOG ≥2) (Figure 3A). The 4-year OS was 94% for patients with no risk factors compared with 79% for patients with 1 risk factor and 59% for patients with 2 risk factors (Figure 3B). When comparing the combined TMTV + ECOG variable to the IPI score, the combined variable displayed higher model performances as assessed by positive NRI (Table 4).
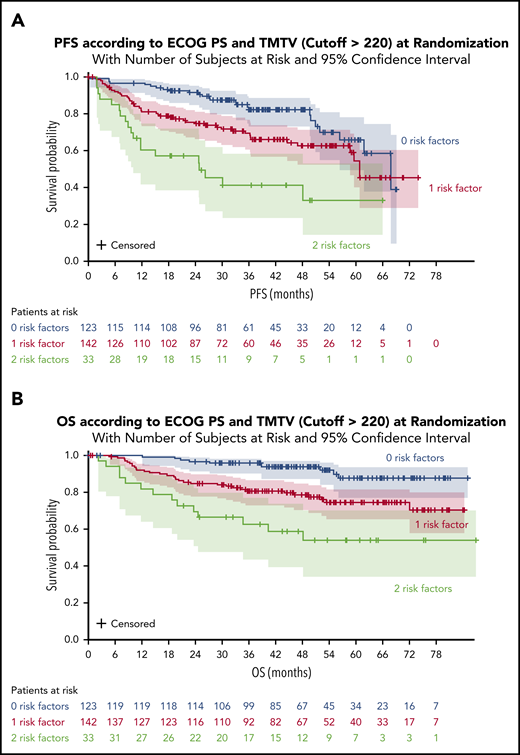
PFS and OS according to ECOG PS and TMTV at randomization. (A) PFS for all patients. (B) OS for all patients.
PFS and OS according to ECOG PS and TMTV at randomization. (A) PFS for all patients. (B) OS for all patients.
Model performance for PFS and OS
| Label | PFS | OS | ||
|---|---|---|---|---|
| IPI | TMTV + ECOG | IPI | TMTV + ECOG | |
| NRI (±SE) | Ref | +0.26 (±0.11) | Ref | +0.37 (±0.14) |
| NRIe | Ref | −42% | Ref | −30% |
| NRIne | Ref | +67% | Ref | +67% |
| Label | PFS | OS | ||
|---|---|---|---|---|
| IPI | TMTV + ECOG | IPI | TMTV + ECOG | |
| NRI (±SE) | Ref | +0.26 (±0.11) | Ref | +0.37 (±0.14) |
| NRIe | Ref | −42% | Ref | −30% |
| NRIne | Ref | +67% | Ref | +67% |
NRIe, event NRI; NRIne, nonevent NRI; Ref, reference; SE, standard error.
Discussion
The current study reports the strong and significant prognostic value of baseline TMTV in DLBCL patients in CR or PR after R-CHOP. High baseline TMTV identifies a subset of approximately half of the patients with a 20-point reduction in 4-year PFS and OS. This impact was maintained irrespective of the maintenance arm (lenalidomide or placebo). In multivariate analysis, only TMTV and ECOG PS were independent predictors of PFS and OS. Interestingly, ECOG PS was the only parameter among the 5 IPI factors to maintain its prognostic value in this model.
We already knew that quantifying the tumoral volume rather than the single largest diameter of the bulk mass gave a more relevant estimation of tumor burden. PET studies across a range of lymphomas suggested that quantifying baseline TMTV more accurately quantifies tumor burden for determining prognosis.25,27,28 In 2 retrospective DLBCL series, a median TMTV of ∼320 cm3 was reported using the 41% threshold method.12,29 Patient populations could be stratified by TMTV, with an OS risk increasing with each TMTV distribution quartile.29 The optimal TMTV cutoff, separating high- from low-risk patients, was 300 cm3. Patients with a large baseline metabolic volume (>300 cm3) had significantly worse 5-year PFS and OS than those with a volume ≤300 cm3.30 In a prospective study of 167 young patients (<60 years) with an aaIPI score of 2 or 3 who received either R/CHOP14 or R/ACVBP, the median TMTV was 380 cm3. A 7% increase in the risk of events for each 100-cm3 TMTV increase was observed, and TMTV >660 cm3 was the strongest predictor of inferior PFS and OS.15 In R-CHOP-responding patients from REMARC, the median TMTV was lower than that in previous series, with a 220 cm3 cutoff separating high- from low-risk patients. This analysis included only patients with available baseline PET/CT who responded to R-CHOP, which explains the low median TMTV the lower cutoff as well as the lower sensitivity and specificity achieved compared with other DLBCL studies performed in higher risk population; however, these findings are in agreement with the observation that elderly patient prognosis is impacted by small levels of tumor volume.11 Therefore, as already documented, a lower tumor burden value is likely enough to discriminate elderly patient prognosis.12 A similar cutoff was recently reported from a retrospective study that included mainly elderly DLBCL patients.14 As documented by general consensus, the median TMTV values found in REMARC were dependent on the 41% maximum standardized uptake value thresholding method used for TMTV measurement.31 and of the inclusion, as in previous studies from our group, of the volume of intense diffuse spleen uptake. In this study, we verified that excluding spleen volume does not change the TMTV predictive value. However, irrespective of methodology, the role of TMTV as a prognostic factor has been demonstrated in DLBCL and several lymphoma subtypes. As a result, representatives from research groups active in the field have launched an initiative to align methods within an acceptable prespecified range worldwide, with the goal of making TMTV measurement possible and consistent in routine clinical practice.31
All previous studies have shown the prognostic impact of TMTV in DLBCL patient series, including those who progressed or did not respond to treatment. In the present study, only patients responding to first-line R-CHOP were included. The observation of a significant role of TMTV to predict PFS and OS in this setting emphasizes the strength of TMTV as a prognostic biomarker for early identification of high-risk DLBCL patients.
TMTV has potential to refine COO risk assignment in DLBCL. Both patients with GCB genotype and high tumor volume, and patients with ABC disease with a small TMTV had a 5-year PFS of ∼50%.12,13 In the REMARC study, we did not observe any impact from the tumor’s COO, and TMTV maintained its prognostic value irrespective of GCB/ABC genotype. Although BCL2 expression was predictive of PFS, as already reported in elderly DLBCL patients, only TMTV remained significantly prognostic in multivariate analysis.
ECOG PS is one of 5 IPI factors developed in the 1990s and is the most commonly used variable for predicting DLBCL survival.32 Other than ECOG PS, factors of age, serum LDH, stage, and number of extranodal sites help identify 4 IPI risk groups. In the postrituximab era, the revised IPI confirms the prognostic significance of IPI. Baseline TMTV allows for accurate quantification of tumor burden for determining prognosis. Interestingly, combining both ECOG PS and TMTV variables was able to more precisely define patient prognosis in the REMARC study. This may be important in an era where new possibilities for multiple “druggable” targets are possible, although to date, none of the novel drugs combined with R-CHOP have demonstrated a significant impact in terms of improved outcome. This may be due to the difficulty in selecting patients truly in need of new strategies. One way to improve this could be to refine the selection criteria based on other parameters extracted from functional imaging such as the spread of the lesions33 and evaluation of performance status. Since baseline PET was not mandatory in the REMARC study, one limit of our study is that only 50% of patients having available baseline PET are included in this analysis. A validation of this model is therefore needed and ongoing in a large series of DLBCL patients included in other published prospective phase 3 clinical trials and in real life.
In conclusion, TMTV measured on baseline PET/CT is a strong prognosticator of survival outcomes in DLBCL, even in patients who responded after R-CHOP. High TMTV at baseline was significantly associated with inferior PFS and OS in patients receiving either lenalidomide maintenance or placebo. Baseline TMTV combined with ECOG PS could improve risk stratification for patients who respond to R-CHOP induction, meeting an unmet need for early and better identification of ultra-risk DLBCL patients.
Presented in poster form at the 61st annual meeting of the American Society of Hematology, Orlando, FL, 7-10 December 2001; and presented orally at the 15th International Conference on Malignant Lymphoma, Ticino, Switzerland, 18-22 June 2019.
The online version of this article contains a data supplement.
The publication costs of this article were defrayed in part by page charge payment. Therefore, and solely to indicate this fact, this article is hereby marked “advertisement” in accordance with 18 USC section 1734.
Acknowledgments
This study was sponsored by the Lymphoma Academic Research Organisation of France, with funding provided by Celgene Corporation (Summit, NJ). The REMARC clinical study and analyses were sponsored by the Lymphoma Academic Research Organisation of France.
Authorship
Contribution: The Lymphoma Academic Research Organisation provided administrative support; C.T. and M.M. contributed to study conception and design; all authors provided study material or patients; C.T., M.M., L.V., A.-S.C., and L.C. collected, assembled, analyzed, and interpreted data; C.T., M.M., L.V., A.-S.C., and L.C. wrote the manuscript; and all authors provided final approval of manuscript and are accountable for all aspects of the work.
Conflict-of-interest disclosure: O.C. received research funding from Roche, Takeda, and Gilead and is on the advisory board of or received honoraria from Celgene, Roche, Takeda, Gilead, BMS, Merck, Abbvie, and Janssen outside the submitted work. H.T. received research funding and personal fees from Celgene; personal fees and nonfinancial support from Roche; and personal fees from Takeda, Janssen, Gilead, and Karyopharm outside the submitted work. P.F. received honoraria and travel accommodations from and had a consulting/advisory role with Roche/Genentech, Janssen, Gilead, and Abbvie. L.O. and R.B. received funding from Roche. V.R. received honoraria from Infinity Pharmaceuticals, BMS, Eisai, PharmaMar, and Gilead Sciences; had a consulting/advisory role with Infinity Pharmaceuticals, BMS, PharmaMar, Gilead Sciences, NanoString Technologies, Incyte, BMS, MSD, Roche/Genentech, Epizyme, AstraZeneca, and immune design; received research funding from arGEN-X BVBA; has patents, royalties, and other intellectual property regarding BAY1000394 studies on mantle cell lymphoma; provided expert testimony for Servier; received travel/accommodation expense funding from Roche, BMS, and AstraZeneca; and received research grants from AstraZeneca, BMS, Boehringer Ingelheim, Janssen Cilag, Merck, Novartis, Pfizer, Roche, and Sanofi. F.M. had an advisory role with and received honoraria from Celgene, Roche, Gilead Sciences, Servier, Epizyme, BMS, Bayer, and Novartis and received honoraria from Janssen. P. Godmer was invited to a congress/conference by Celgene. G.S. received financial compensation for participating in advisory boards or consulting from Abbvie, Autolus, Celgene, Gilead, Epizyme, Janssen, Karyopharm, Kite, Merck, Morphosys, Novartis, Roche, Servier, and Takeda and participated in educational events for Abbvie, Amgen, Celgene, Gilead, Janssen, Kite, Morphosys, Novartis, Roche, Servier, Takeda. P. Gaulard received research funding from Takeda and Innate Pharma and is on the advisory board and received honoraria from Takeda. C.T. received honoraria from Roche, Amgen, Janssen, Celgene, Gilead Science/Kyte; had a consulting/advisory role with Roche, Gilead Sciences, Janssen, Celgene, and Novartis; and received research and travel/accommodation expense funding from Roche and Novartis. The remaining authors declare no competing financial interests.
Correspondence: Catherine Thieblemont, Assistance Publique-Hôpitaux de Paris, Hôpital Saint-Louis, Hemato-oncologie, 1, Ave Claude Vellefaux, 75010 Paris, France; e-mail: catherine.thieblemont@aphp.fr; and Michel Meignan, LYSA Image, Hôpital Henri Mondor, 51 Ave Maréchal de Lattre de Tassigny, 94010 Créteil, France; e-mail: michel.meignan-ext@aphp.fr; mich.meig@wanadoo.fr.
