

Key Points
Dysregulated enhancers and increased levels and activity of β-catenin–TCF7L2–JMJD6–c-Myc mediates BETi resistance in post-MPN sAML cells.
Cotreatment with BC2059 and BET-PROTAC inhibits the β-catenin–TCF7L2–JMJD6–c-Myc axis, overcoming preclinical BETi resistance in AML cells.

Abstract
The promising activity of BET protein inhibitors (BETi’s) is compromised by adaptive or innate resistance in acute myeloid leukemia (AML). Here, modeling of BETi-persister/resistance (BETi-P/R) in human postmyeloproliferative neoplasm (post-MPN) secondary AML (sAML) cells demonstrated accessible and active chromatin in specific superenhancers/enhancers, which was associated with increased levels of nuclear β-catenin, TCF7L2, JMJD6, and c-Myc in BETi-P/R sAML cells. Following BETi treatment, c-Myc levels were rapidly restored in BETi-P/R sAML cells. CRISPR/Cas9-mediated knockout of TCF7L2 or JMJD6 reversed BETi-P/R, whereas ectopic overexpression conferred BETi-P/R in sAML cells, confirming the mechanistic role of the β-catenin–TCF7L2–JMJD6–c-Myc axis in BETi resistance. Patient-derived, post-MPN, CD34+ sAML blasts exhibiting relative resistance to BETi, as compared with sensitive sAML blasts, displayed higher messenger RNA and protein expression of TCF7L2, JMJD6, and c-Myc and following BETi washout exhibited rapid restoration of c-Myc and JMJD6. CRISPR/Cas9 knockout of TCF7L2 and JMJD6 depleted their levels, inducing loss of viability of the sAML blasts. Disruption of colocalization of nuclear β-catenin with TBL1 and TCF7L2 by the small-molecule inhibitor BC2059 combined with depletion of BRD4 by BET proteolysis-targeting chimera reduced c-Myc levels and exerted synergistic lethality in BETi-P/R sAML cells. This combination also reduced leukemia burden and improved survival of mice engrafted with BETi-P/R sAML cells or patient-derived AML blasts innately resistant to BETi. Therefore, multitargeted disruption of the β-catenin–TCF7L2–JMJD6–c-Myc axis overcomes adaptive and innate BETi resistance, exhibiting preclinical efficacy against human post-MPN sAML cells.
Introduction
Hematopoietic stem/progenitor cells of myeloproliferative neoplasms with myelofibrosis (MPN-MF) express pathogenetic mutations in JAK2, c-MPL, or calreticulin (CALR) gene and display constitutive activation of JAK-STAT5/3 and NF-κB signaling.1-3 Transformation of MPN-MF to secondary acute myeloid leukemia (sAML) occurs in ≤15% of patients,4,5 where standard induction anti-AML therapy is ineffective.6,7 The JAK1 and JAK2 inhibitor ruxolitinib that confers notable clinical benefits in MPN-MF is only modestly active, without significantly improving clinical outcome in post-MPN sAML.6-8 The BET protein BRD4 is a nononcogene addiction target in AML, and treatment with acetyl-lysine mimetic BET protein inhibitors (BETi’s) disrupt binding of BRD4 to acetylated chromatin and transcription factors (TFs).9-12 This attenuates transcription of c-Myc and other superenhancer (SE)-regulated oncogenes, including Bcl-xL, PIM1, and CDK4/6, while inducing expression of HEXIM1, p21, and BIM and inhibiting cell growth and survival of post-MPN sAML blast progenitor cells (BPCs).9-14 BETi treatment also inhibits binding of BRD4 to acetylated RELA (NF-κB–p65), inhibiting its transcriptional activity and levels of its targets.3,9,10,15,16 Treatment with the small-molecule acetyl-lysine-mimetic BETi OTX-015 was shown to induce clinical complete remissions in patients with relapsed/refractory AML.10,16-18 Exposure to BETi’s has been shown to induce BRD4, potentially reducing BETi activity.19,20 To circumvent this, heterobifunctional proteolysis-targeting chimera (PROTAC) molecules have been designed.21-24 Unlike BETi’s, BET-PROTACs can degrade and deplete BRD4.21-24
Transformed cells exhibit varying level of sensitivity/resistance to BETi-induced apoptosis and mechanisms of resistance to BETi are cell-type specific and depend on cellular context.25-33 Based on the mechanism, BETi resistance was broadly characterized as BRD4 dependent25-28 or BRD4 independent.29-33 BRD4-dependent mechanisms include increased levels and/or phosphorylation of BRD4.25-28 Hyperphosphorylated BRD4 due to loss of the serine phosphatase 2A and unchecked phosphorylation by casein kinase II increased avidity of binding of BRD4 to the mediator protein MED1, conferring acquired resistance to BETi in breast cancer cells.25 Elevated BRD4 levels causing BETi resistance were attributed either to increased levels of its deubiquitinase DUB3 or to loss-of-function mutations in SPOP (speckle-type POZ protein), which is an adaptor protein for CUL3 E3 ligase substrates, including BRD4.26-28 Wild-type SPOP binds to BRD4, promoting ubiquitylation and proteasomal degradation of BRD4, whereas mutant SPOP is unable to do so.27,28 Among BRD4-independent mechanisms are adaptive kinome-reprogramming with elevated receptor tyrosine kinase and phosphatidylinositol 3-kinase/extracellular signal-regulated kinase activities, which stabilize MYC/FOSL1 in BETi-resistant ovarian cancer cells,29 as well as enhancer (E) remodeling that leads to phosphatidylinositol 3-kinase overexpression and activity documented in BETi-resistant neuroblastoma cells.30 Additionally, despite BETi treatment, attenuation of c-Myc downregulation or restoration of c-Myc expression caused BETi resistance in colorectal cancer and leukemia cells.31-33 Adaptive resistance to BETi in mouse models of genetically engineered MLL-AF9/NrasG12D AML was shown to occur due to rapid restoration of c-Myc expression induced by WNT–β-catenin signaling in leukemia-initiating stem/progenitor cells.31,32 Genetic or chemical inhibition of this pathway restored BETi sensitivity in mouse MLL-AF9/NrasG12D AML cells.31,32 However, the status and mechanistic relevance of WNT–β-catenin–TCF7L2 signaling was not fully assessed in the setting of either adaptive or innate BETi resistance in human AML or post-MPN sAML cells.
Following iterative cycles of treatment of human post-MPN sAML SET-2 and HEL92.1.7 cells to 90% inhibitory concentrations of the BETi OTX015 and full recovery, we generated BETi-persister/resistant (BETi-P/R) SET-2-OTX P/R and HEL-OTX P/R cells.34 These cells show >10-fold resistance to OTX015 and cross-resistance to other BETi’s. As compared with their parental sensitive controls, BETi-P/R cells showed higher levels of TCF7L2 (TCF4) and the arginine demethylase JMJD6 that regulates E-mediated transcriptional pause-release,35-38 associated with increased expression of nuclear β-catenin–TCF7L2 targets, including c-Myc.36,39 Additionally, patient-derived (PD) human AML blasts demonstrating ex vivo relative resistance to BETi also exhibited higher expression of TCF7L2, JMJD6, and c-Myc. Therefore, we also elucidated the mechanistic role of the β-catenin–JMJD6–TCF7L2–c-Myc axis in conferring BETi resistance in human AML and post-MPN sAML cells. We demonstrate that cotreatment with BC2059, a disruptor of binding of β-catenin with the nuclear adaptor protein TBL1XR1/TBL1 and TCF7L2,36,39 and BET-PROTAC ARV-771, a degrader of BRD4,39,40 exerted synergistic lethal in vitro activity and improved survival of mice engrafted with BETi-P/R human AML or sAML cells.
Materials and methods
Cell lines and cell culture
Human sAML cell line SET-2 cells (RRID:CVCL_2187) were obtained from the DSMZ. HEL92.1.7 cells (RRID:CVCL_2481) were obtained from the ATCC (Manassas, VA). All experiments with cell lines were performed within 6 months after thawing or obtaining cells. The cell lines were also authenticated in the Characterized Cell Line Core Facility at MD Anderson Cancer Center (Houston, TX). HEL-OTX P/R and SET-2-OTX P/R cells were generated by exposing HEL92.1.7 or SET-2 cells to 90% lethal dose (LD90) concentration (1.0 µM) of OTX015 for 48 hours. Live cells were washed and cultured until viability was >90%. This process was performed 10 times.
Confocal immunofluorescent microscopy
Following drug treatments or single guide RNA (sgRNA) transfection, cells were cytospun onto glass slides, fixed, permeabilized, and stained with antibody for TCF7L2 or β-catenin or Alexa Fluor 647–conjugated TBL1 (SC-137006; RRID:AB_2199796). Imaging was performed on a Zeiss confocal microscope, as previously described.39
Methods for transcriptomic analysis, analysis of epigenetic state in sAML cells and in vivo models are in supplemental Methods (available at the Blood Web site).
Results
Adaptive BETi resistance in human BETi-P/R sAML cells is characterized by increased expression of TCF7L2, JMJD6, and c-Myc
Dose-dependent apoptotic effects of the BETi OTX015 in several human AML cell types with diverse genetic alterations highlighted concentrations that induced apoptosis in 50% of cells ranging between 89 nM and >2000 nM (Figure 1A; supplemental Figure 1A). Similar diversity of apoptotic response was also noted among BPCs derived from patients with de novo AML (17 samples) and post-MPN sAML (39 samples) (Figure 1B). Oncoplots depicting genetic alterations in the de novo and sAML samples used are presented in supplemental Figure 1A-B (resistant samples are marked “R”). HEL-OTX P/R and SET-2-OTX P/R cells were generated as in Figure 1C and described above. Compared with parental controls, HEL-OTX P/R and SET-2-OTX P/R were resistant to apoptosis induced by not only OTX015 but also the BETi JQ1 or ABBV-075 (Figure 1D). Supplemental Table 1A shows the resistance index for OTX015, JQ1, and ABBV-075 in SET-2-OTX P/R and HEL-OTX P/R over SET-2 and HEL92.1.7 cells. Notably, supplemental Figure 1C shows that when cultured for 8 weeks in BETi-free medium, there was a partial but statistically significant reversal of resistance to BETi (OTX015)-induced apoptosis in HEL-OTX P/R and SET-2-OTX P/R cells. SET-2-OTX P/R and HEL-OTX P/R cells were as sensitive as the parental SET-2 and HEL92.1.7 cells to cytarabine (AraC), etoposide and the Bcl-xL–specific inhibitor A1155463, but all cell types were resistant to the BCL2 inhibitor venetoclax (supplemental Figure 2A-D). NextGen sequencing (full exomes of 300 genes) showed that although few mutations were new, or lost, in BETi-P/R as compared with the sensitive control sAML cells, none of these alterations were either common to both SET-2-OTX P/R and HEL-OTX P/R sAML cells or driver mutations that could mechanistically explain BETi resistance in BETi-P/R sAML cells (supplemental Table 1B). Compared with controls, HEL-OTX P/R and SET-2-OTX P/R cells, expressed significantly higher messenger RNA (mRNA) expression of TCF7L2, JMJD6, c-Myc, PU.1, c-Myb, PIM1, Bcl-xL (BCL2L1), and Mcl-1 (Figure 1E; supplemental Table 1C). However, protein expression of p-Rbp1 or Rbp1 of RNAP2 was unaltered (Figure 1F). Importantly, protein levels of TCF7L2, JMJD6, c-Myc, c-Myb, and PU.1, as well as of Mcl-1, Bcl-xL, and PIM1, were elevated, without significant alterations in the levels of BRD4/3/2, pBRD4, DUB3, SPOP, TRIM33/24, and USP28 in BETi-P/R over control sAML cells (Figure 1F; supplemental Table 1D). Higher Bcl-xL levels in BETi-P/R cells explained their sensitivity to A1155463, but not to venetoclax. Although different for each protein, the half-life of TCF7L2, JMJD6, c-Myc, RUNX1, PU.1, and Mcl-1 protein was unaltered in BETi-P/R vs control sAML cells (supplemental Figure 2E-F). There were no copy-number gains of the TCF7L2 and MYC genes (supplemental Figure 2G). Treatment with OTX015 for 16 hours (time 0 in Figure 1G) depleted mRNA levels of MYC, TCF7L2, and JMJD6 (while inducing p21 mRNA levels) in SET-2-OTX P/R as well as SET-2 cells (supplemental Figure 2H). However, notably, cMYC mRNA levels were rapidly restored within 2 to 4 hours to higher than baseline levels in SET-2-OTX P/R compared with SET-2 cells (supplemental Figure 2H). Treatment with OTX015 also depleted the protein levels of c-Myc, TCF7L2, JMJD6, c-Myb, and PU.1 (Figure 1G), which were again rapidly restored in SET-2-OTX P/R compared with SET-2 cells (Figure 1G; supplemental Figure 2I). Taken together, these findings indicate that resistance to BETi’s is associated with increased levels of TCF7L2, JMJD6, and c-Myc in BETi-P/R sAML cells. Rapid rebound to high base line levels of c-Myc, TCF7L2, and JMJD6 in BETi-P/R sAML cells suggested a dysregulated epigenome-based mechanism for the transcriptome differences in BETi-P/R vs parental-control sAML cells (vide infra).

Generation and characterization of sAML cells with resistance to BETi's. (A) Cultured AML cells were treated with the indicated concentrations of OTX015 for 48 hours. Apoptosis was determined by annexin V staining and flow cytometry. The LD50 value for each cell line was calculated with GraphPad V7. (B) PD, CD34+ AML (n = 17), and sAML (n = 39) cells were treated with 1 µM OTX015 for 48 hours. The percentage of propidium iodide–positive, nonviable cells were determined by flow cytometry. (C) Schematic of the process used to generate OTX persister/resistant HEL92.1.7 (HEL) and SET-2 cells. (D) SET-2, HEL, and their OTX P/R counterparts were treated with the indicated concentrations of OTX015, JQ1, or ABBV-075 for 48 hours. Apoptosis was determined by annexin V staining and flow cytometry. (E) Relative mRNA expression in SET-2-OTX P/R and HEL-OTX P/R cells compared with parental SET-2 and HEL cells. The relative mRNA expression levels were normalized to glyceraldehyde-3-phosphate dehydrogenase (GAPDH) expression. *P < .05 and †P < .005 indicate values significantly greater in OTX P/R cells compared with parental cells. (F) Immunoblot analyses of HEL, HEL-OTX P/R, SET-2, and SET-2-OTX P/R cells following 10 shocks with OTX015. The expression levels of β-actin or GAPDH served as the loading control. The graph shows densitometry quantification of protein expression differences in the HEL-OTX P/R and SET-2-OTX P/R cells compared with the parental cells. Asterisk (*) indicates values significantly greater (P < .05) in OTX P/R cells compared with parental cells. (G) SET-2 and SET-2-OTX P/R cells were treated with 1 µM OTX015 for 16 hours. Following this, the cells were washed free of the drug and incubated for 2 and 8 hours. Cells were harvested and lysed, and immunoblot analyses were conducted.
Generation and characterization of sAML cells with resistance to BETi's. (A) Cultured AML cells were treated with the indicated concentrations of OTX015 for 48 hours. Apoptosis was determined by annexin V staining and flow cytometry. The LD50 value for each cell line was calculated with GraphPad V7. (B) PD, CD34+ AML (n = 17), and sAML (n = 39) cells were treated with 1 µM OTX015 for 48 hours. The percentage of propidium iodide–positive, nonviable cells were determined by flow cytometry. (C) Schematic of the process used to generate OTX persister/resistant HEL92.1.7 (HEL) and SET-2 cells. (D) SET-2, HEL, and their OTX P/R counterparts were treated with the indicated concentrations of OTX015, JQ1, or ABBV-075 for 48 hours. Apoptosis was determined by annexin V staining and flow cytometry. (E) Relative mRNA expression in SET-2-OTX P/R and HEL-OTX P/R cells compared with parental SET-2 and HEL cells. The relative mRNA expression levels were normalized to glyceraldehyde-3-phosphate dehydrogenase (GAPDH) expression. *P < .05 and †P < .005 indicate values significantly greater in OTX P/R cells compared with parental cells. (F) Immunoblot analyses of HEL, HEL-OTX P/R, SET-2, and SET-2-OTX P/R cells following 10 shocks with OTX015. The expression levels of β-actin or GAPDH served as the loading control. The graph shows densitometry quantification of protein expression differences in the HEL-OTX P/R and SET-2-OTX P/R cells compared with the parental cells. Asterisk (*) indicates values significantly greater (P < .05) in OTX P/R cells compared with parental cells. (G) SET-2 and SET-2-OTX P/R cells were treated with 1 µM OTX015 for 16 hours. Following this, the cells were washed free of the drug and incubated for 2 and 8 hours. Cells were harvested and lysed, and immunoblot analyses were conducted.
Chromatin accessibility, SE/E activity, and transcriptional dysregulation of TCF7L2, JMJD6, and c-Myc in human BETi-P/R sAML cells
We next determined chromatin accessibility and active E profile in BETi-P/R vs the parental control sAML cells. Figure 2A demonstrates that there were significant gains and losses in chromatin accessibility in SET-2-OTX P/R and HEL-OTX P/R over SET-2 and HEL92.1.7 cells. Heat map of the percentage of assay for transposase-accessible chromatin using sequencing (ATAC-seq) peaks demonstrates the range of TF-binding motifs present in the chromatin of SET-2-OTX P/R and HEL-OTX P/R over SET-2 and HEL92.1.7 cells (supplemental Figure 3A). Log 2-fold changes in the ATAC-seq peak densities were detected in loci shown in supplemental Figure 3B. Rank-sorted TF motifs enriched in the accessible chromatin in sAML P/R cells included those of MYC, MYB, PU.1, STAT3/5, LEF1 (TCF7L2), and ERG (Figure 2B; supplemental Figure 3C). The signal-density plots of H3K27Ac and BRD4 chromatin immunoprecipitation sequencing (ChIP-seq) analyses globally showed significantly higher H3K27Ac, but not BRD4, peaks on the chromatin of SEs/Es compared with ±2 kb on either side of SEs/Es DNA in BETi-P/R sAML cells (Figure 2C; supplemental Figure 3D). Based on SE/E score (reflecting both the E size and density of reads), the “ROSE” (rank ordering of SEs) plot shows several SEs/Es with high scores, including those of MYC, RUNX1, Bcl-xL, and PIM1 in BETi-P/R cells (Figure 2D). Sequence density plots demonstrated high H3K27Ac and BRD4 signals in the SE/Es of MYC, PVT1,41,42 Bcl-xL (BCL2L1), and PIM1,43 as well as in the Es of TCF7L2 and JMJD6 genes in BETi-P/R cells (Figure 2-F; supplemental Figures 3E and 4A-D).37,38,44 Loci with log 2-fold increase in H3K27Ac and BRD4 peaks in SET-2-OTX P/R over SET-2 cells are shown in supplemental Figure 3F. WNT–β-catenin signaling through TCF7L2 was previously implicated in restoring c-Myc expression in BETi-resistant mouse AML cell type.31,32 Therefore, we determined TCF7L2 occupancy, by ChIP-qPCR, at the previously described MYC-Es (SE1, SE3, and SE5) within MYC SE and in the PVT1 Es (E857 and E904) known to regulate c-Myc expression.31,41,42 Although more TCF7L2 was bound to MYC SE3 and SE5, as well as to PVT E857 and E904 (supplemental Figure 5A), treatment of SET-2-OTX P/R cells with LD90 concentration of OTX015 dramatically increased TCF7L2 occupancy at MYC SE1 while decreasing it at the PVT1 Es (supplemental Figure 5B). This suggests that repeated exposure to LD90 levels of BETi, through TCF7L2 occupancy, remodeled Es of MYC and PVT1. RNA sequencing (RNA-seq) analysis showed a larger number of genes up- or downregulated in SET-2-OTX P/R and HEL-OTX P/R compared with SET-2 and HEL92.1.7 cells (Figure 3A). Figure 3B and supplemental Table 2 show that among the 69 upregulated gene expressions in SET-2-OTX P/R and HEL-OTX P/R sAML cells, 39 (56%, noted in red) were TCF7L2 targets, according to ENCODE. Also, gene set enrichment analyses (GSEAs) of TF targets showed positive correlation with TCF7L2/LEF1, MYC/MAX, NF-κB, and STAT5 genes in BETi-P/R sAML cells (Figure 3C). GSEA according to Gene Ontology pathways also showed significant enrichment in the WNT–β-catenin and regulation of stem cell proliferation and differentiation pathway genes (Figure 3D). Quantitative polymerase chain reaction (qPCR) analyses confirmed that BETi-P/R cells exhibited significantly higher mRNA expression of TCF7L2, JMJD6, MYC, MYB, PU.1, RUNX1, PIM1, Bcl-xL, and Mcl-1 compared with their sensitive controls (Figure 3E). Consistent with this, higher levels of β-catenin-TCF7L2-JMJD6-c-Myc axis proteins were detected (Figure 1F-G). Confocal microscopy demonstrated increased nuclear levels and co-localization of β-catenin with TCF7L2 in SET-2-OTX P/R and HEL-OTX P/R vs SET-2 and HEL92.1.7 cells, respectively (Figures 4A and 5A). Increased nuclear co-localization of β-catenin with TBL1 was also observed in SET-2-OTX P/R and HEL-OTX P/R cells (Figures 4A and 5A). We next determined effects of treatment with OTX015 on BRD4 occupancy on Es, as well as associated transcriptional perturbations in BETi-P/R and BETi-sensitive sAML cells. Supplemental Figure 5C-D shows that OTX015 treatment reduced BRD4 occupancy on the JMJD6 gene and the Es of MYC, TCF7L2, and PIM1 in BETi-sensitive and BETi-P/R SET2 sAML cells. Consistent with this, greater transcriptional perturbations (up and downregulation of mRNA levels) were detected by RNA-seq analysis in BETi-sensitive compared with BETi-P/R sAML cells (supplemental Figure 5E-G).

Analysis of the epigenome in OTX-P/R sAML cells demonstrates greater presence of H3K27Ac and increased BRD4 occupancy. (A) Number of gained and lost peaks in SET-2-OTX P/R and HEL-OTX P/R cells compared with parental SET-2 and HEL cells as determined by ATAC-seq analysis. (B) TF binding motif analysis was conducted utilizing HOMER. The −log10 P values of the rank-sorted motifs in the gained ATAC-seq peaks of SET-2-OTX P/R cells compared with parental SET-2 cells are shown. (C) Sequence tag density of H3K27Ac and BRD4 within Es and SEs vs 2 kb upstream or downstream in SET-2-OTX P/R compared with SET-2 cells. (D) Rank ordering of SEs (ROSE) analysis was performed on the H3K27Ac ChIP-seq peaks from SET-2-OTX P/R and HEL-OTX P/R cells. The numbers indicate the rank of the SE out of the total number of identified SEs in each P/R cell line. (E-F) Integrated Genomics Viewer plots of H3K27Ac and BRD4 signal densities at the MYC SE and PVT1 gene in SET-2 and SET-2-OTX P/R cells. The log2 fold change (log2FC) in peak numbers for H3K27Ac and BRD4 was calculated with diffReps. The fold changes for significant alterations (P < .05) are noted beneath the SEs/Es.
Analysis of the epigenome in OTX-P/R sAML cells demonstrates greater presence of H3K27Ac and increased BRD4 occupancy. (A) Number of gained and lost peaks in SET-2-OTX P/R and HEL-OTX P/R cells compared with parental SET-2 and HEL cells as determined by ATAC-seq analysis. (B) TF binding motif analysis was conducted utilizing HOMER. The −log10 P values of the rank-sorted motifs in the gained ATAC-seq peaks of SET-2-OTX P/R cells compared with parental SET-2 cells are shown. (C) Sequence tag density of H3K27Ac and BRD4 within Es and SEs vs 2 kb upstream or downstream in SET-2-OTX P/R compared with SET-2 cells. (D) Rank ordering of SEs (ROSE) analysis was performed on the H3K27Ac ChIP-seq peaks from SET-2-OTX P/R and HEL-OTX P/R cells. The numbers indicate the rank of the SE out of the total number of identified SEs in each P/R cell line. (E-F) Integrated Genomics Viewer plots of H3K27Ac and BRD4 signal densities at the MYC SE and PVT1 gene in SET-2 and SET-2-OTX P/R cells. The log2 fold change (log2FC) in peak numbers for H3K27Ac and BRD4 was calculated with diffReps. The fold changes for significant alterations (P < .05) are noted beneath the SEs/Es.

OTX P/R sAML cells exhibit a dysregulated transcriptome with enrichment of TCF7L2/LEF1 target genes. (A) mRNA-seq analysis was performed on total RNA from HEL, HEL-OTX P/R, SET-2, and SET-2-OTX P/R cells. The heat map shows the number of up and downregulated genes in the OTX P/R cells compared with the parental cells at a log2 fold change of ≥1.5 and a P value < .05. (B) Venn diagram of overlap in upregulated genes in the HEL-OTX P/R and SET-2-OTX P/R cells. (C) GSEA of HEL-OTX P/R cells with TF target datasets from the Molecular Signatures Database (MSigDB). F.D.R., false discovery rate; N.E.S., normalized enrichment score. All q-values < 0.1. (D) Gene Ontology analysis (MSigDB) of the common upregulated genes in HEL-OTX P/R and SET-2-OTX P/R cells. (E) Relative mRNA expression of selected TCF7L2 target genes in SET-2-OTX P/R and HEL-OTX P/R cells compared with parental cells as determined by qPCR analysis.
OTX P/R sAML cells exhibit a dysregulated transcriptome with enrichment of TCF7L2/LEF1 target genes. (A) mRNA-seq analysis was performed on total RNA from HEL, HEL-OTX P/R, SET-2, and SET-2-OTX P/R cells. The heat map shows the number of up and downregulated genes in the OTX P/R cells compared with the parental cells at a log2 fold change of ≥1.5 and a P value < .05. (B) Venn diagram of overlap in upregulated genes in the HEL-OTX P/R and SET-2-OTX P/R cells. (C) GSEA of HEL-OTX P/R cells with TF target datasets from the Molecular Signatures Database (MSigDB). F.D.R., false discovery rate; N.E.S., normalized enrichment score. All q-values < 0.1. (D) Gene Ontology analysis (MSigDB) of the common upregulated genes in HEL-OTX P/R and SET-2-OTX P/R cells. (E) Relative mRNA expression of selected TCF7L2 target genes in SET-2-OTX P/R and HEL-OTX P/R cells compared with parental cells as determined by qPCR analysis.
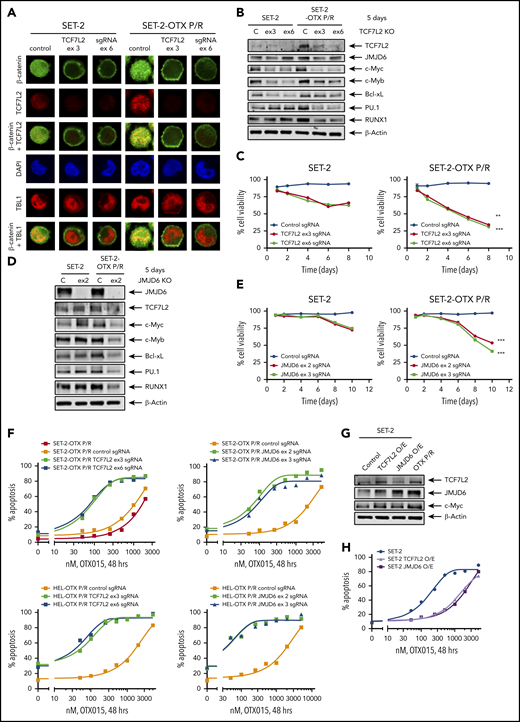
Knockout of TCF7L2 and JMJD6 depletes target gene expression, reduces cell viability, and resensitizes OTX-P/R cells to the lethal effects of BETi treatment. (A) SET-2 and SET-2-OTX P/R cells were transfected with negative control sgRNA or sgRNAs against TCF7L2 exon 3 or exon 6 and incubated for 5 days. Then, cells were cytospun onto glass slides and stained with anti-β-catenin, TCF7L2, or TBL1 antibodies. Nuclei were stained with 4′,6-diamidino-2-phenylindole (DAPI). Confocal microscopy analysis was performed (original magnification ×100). Representative images are shown for each condition. (B) Representative immunoblot analysis of SET-2 and SET-2-OTX P/R cells transfected with negative control sgRNA or sgRNAs against TCF7L2 and incubated for 5 days. The expression levels of β-actin in the cell lysates served as the loading control. KO, knockout. (C) SET-2 and SET-2-OTX P/R cells were transfected with negative control sgRNA or sgRNAs against TCF7L2. Following this, the percent cell viability was monitored over 8 days. **P < .01; ***P < .005 for cell viability values significantly less in SET-2-OTX P/R cells transfected with TCF7L2 sgRNA compared with SET-2 parental cells transfected with TCF7L2 sgRNA. (D) SET-2 and SET-2-OTX P/R cells were transfected with negative control sgRNA or sgRNA against JMJD6 and incubated for 5 days. Immunoblot analysis was conducted on the total cell lysates. The expression levels of β-actin in the cell lysates served as the loading control. (E) SET-2 and SET-2-OTX P/R cells were transfected with negative control sgRNA or sgRNAs against JMJD6. Following this, the percent cell viability was monitored over 10 days. Asterisks (***) indicate cell viability values significantly less (P < .005) in SET-2-OTX P/R cells transfected with JMJD6 sgRNA compared with SET-2 parental cells transfected with JMJD6 sgRNA. (F) SET-2-OTX P/R and HEL-OTX P/R cells were transfected with negative control sgRNA or TCF7L2 or JMJD6 sgRNAs and incubated for 3 days. Following this, cells were treated with the indicated concentrations of OTX015 for 48 hours. The percentage of annexin V–positive, apoptotic cells were determined by flow cytometry. (G) SET-2 cells were transfected with a vector for overexpression of TCF7L2 or JMJD6. The overexpression was confirmed by immunoblot analysis. The expression levels of β-actin in the cell lysates served as the loading control. (H) SET-2 cells were transfected with a vector for overexpression of TCF7L2 or JMJD6. Parental and TCF7L2 or JMJD6-overexpressing cells were treated with the indicated concentrations of OTX015 for 48 hours. Then, the percentage of annexin V–positive, apoptotic cells from each group was determined by flow cytometry.
Knockout of TCF7L2 and JMJD6 depletes target gene expression, reduces cell viability, and resensitizes OTX-P/R cells to the lethal effects of BETi treatment. (A) SET-2 and SET-2-OTX P/R cells were transfected with negative control sgRNA or sgRNAs against TCF7L2 exon 3 or exon 6 and incubated for 5 days. Then, cells were cytospun onto glass slides and stained with anti-β-catenin, TCF7L2, or TBL1 antibodies. Nuclei were stained with 4′,6-diamidino-2-phenylindole (DAPI). Confocal microscopy analysis was performed (original magnification ×100). Representative images are shown for each condition. (B) Representative immunoblot analysis of SET-2 and SET-2-OTX P/R cells transfected with negative control sgRNA or sgRNAs against TCF7L2 and incubated for 5 days. The expression levels of β-actin in the cell lysates served as the loading control. KO, knockout. (C) SET-2 and SET-2-OTX P/R cells were transfected with negative control sgRNA or sgRNAs against TCF7L2. Following this, the percent cell viability was monitored over 8 days. **P < .01; ***P < .005 for cell viability values significantly less in SET-2-OTX P/R cells transfected with TCF7L2 sgRNA compared with SET-2 parental cells transfected with TCF7L2 sgRNA. (D) SET-2 and SET-2-OTX P/R cells were transfected with negative control sgRNA or sgRNA against JMJD6 and incubated for 5 days. Immunoblot analysis was conducted on the total cell lysates. The expression levels of β-actin in the cell lysates served as the loading control. (E) SET-2 and SET-2-OTX P/R cells were transfected with negative control sgRNA or sgRNAs against JMJD6. Following this, the percent cell viability was monitored over 10 days. Asterisks (***) indicate cell viability values significantly less (P < .005) in SET-2-OTX P/R cells transfected with JMJD6 sgRNA compared with SET-2 parental cells transfected with JMJD6 sgRNA. (F) SET-2-OTX P/R and HEL-OTX P/R cells were transfected with negative control sgRNA or TCF7L2 or JMJD6 sgRNAs and incubated for 3 days. Following this, cells were treated with the indicated concentrations of OTX015 for 48 hours. The percentage of annexin V–positive, apoptotic cells were determined by flow cytometry. (G) SET-2 cells were transfected with a vector for overexpression of TCF7L2 or JMJD6. The overexpression was confirmed by immunoblot analysis. The expression levels of β-actin in the cell lysates served as the loading control. (H) SET-2 cells were transfected with a vector for overexpression of TCF7L2 or JMJD6. Parental and TCF7L2 or JMJD6-overexpressing cells were treated with the indicated concentrations of OTX015 for 48 hours. Then, the percentage of annexin V–positive, apoptotic cells from each group was determined by flow cytometry.
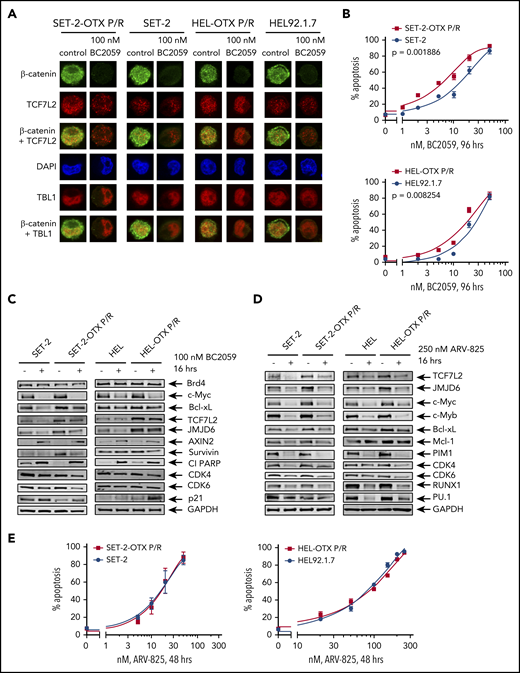
Compared with parental HEL and SET-2 cells, BETi-P/R cells exhibit greater nuclear expression of TCF7L2 and TBL1 and sensitivity to treatment with the β-catenin antagonist BC2059 or BET-PROTAC. (A) SET-2-OTX P/R, SET-2, HEL-OTX P/R, and HEL cells were treated with 100 nM BC2059 for 16 hours. Following this, cells were cytospun onto glass slides and stained with antibodies for confocal microscopy (original magnification ×100). Representative images are shown for each condition. (B) SET-2-OTX P/R, SET-2, HEL-OTX P/R, and HEL cells were treated with the indicated concentrations of BC2059 for 96 hours. At the end of treatment, the percentage of annexin V–positive, apoptotic cells were determined by flow cytometry. (C-D) Immunoblot analysis of SET-2, SET-2-OTX P/R, HEL, and HEL-OTX P/R cells treated with 100 nM BC2059 or 250 nM ARV-825 for 16 hours. (E) SET-2-OTX P/R, SET-2, HEL-OTX P/R, and HEL cells were treated with the indicated concentrations of ARV-825 for 48 hours. Following this, the percentage of annexin V–positive, apoptotic cells was determined by flow cytometry.
Compared with parental HEL and SET-2 cells, BETi-P/R cells exhibit greater nuclear expression of TCF7L2 and TBL1 and sensitivity to treatment with the β-catenin antagonist BC2059 or BET-PROTAC. (A) SET-2-OTX P/R, SET-2, HEL-OTX P/R, and HEL cells were treated with 100 nM BC2059 for 16 hours. Following this, cells were cytospun onto glass slides and stained with antibodies for confocal microscopy (original magnification ×100). Representative images are shown for each condition. (B) SET-2-OTX P/R, SET-2, HEL-OTX P/R, and HEL cells were treated with the indicated concentrations of BC2059 for 96 hours. At the end of treatment, the percentage of annexin V–positive, apoptotic cells were determined by flow cytometry. (C-D) Immunoblot analysis of SET-2, SET-2-OTX P/R, HEL, and HEL-OTX P/R cells treated with 100 nM BC2059 or 250 nM ARV-825 for 16 hours. (E) SET-2-OTX P/R, SET-2, HEL-OTX P/R, and HEL cells were treated with the indicated concentrations of ARV-825 for 48 hours. Following this, the percentage of annexin V–positive, apoptotic cells was determined by flow cytometry.
TCF7L2 and JMJD6 and c-Myc overexpression mechanistically regulate BETi resistance in human BETi-P/R sAML cells
We next determined effects of specific guide RNA (gRNA)-directed CRISPR/Cas9-mediated knockout of TCF7L2 in BETi-P/R vs their sensitive control sAML cells. Treatment with gRNA directed against exons 3 and 6 of TCF7L2 markedly reduced protein expression of TCF7L2 and its downstream target, c-Myc, in BETi-P/R and control sAML cells (Figure 4A-B; supplemental Figure 6A-C). Knockout of TCF7L2 also led to decrease in mRNA and protein expression of JMJD6, RUNX1, c-Myb, and PU.1 (Figure 4B; supplemental Figure 6C-D). These effects of TCF7L2 knockout caused significantly greater loss of viability of BETi-P/R as compared with SET-2 and HEL92.1.7 cells (Figure 4C; supplemental Figure 6E). CRISPR/Cas9-mediated knockout of JMJD6 (by gRNAs directed against exons 2 and 3) also markedly depleted protein expression of JMJD6, without significantly affecting TCF7L2 expression, in BETi-P/R as well as in control sAML cells (Figure 4D; supplemental Figure 6F). JMJD6 depletion was also associated with decreased protein expressions of c-Myb, PU.1, RUNX1, and c-Myc in BETi-P/R sAML cells (Figure 4D; supplemental Figure 6G), which collectively caused significantly greater loss of viability of SET-2-OTX P/R and HEL-OTX P/R over sensitive sAML cells (Figure 4E; supplemental Figure 6H). Individually, knockout of TCF7L2 and JMJD6 significantly increased sensitivity of SET-2-OTX P/R and HEL-OTX P/R, but not of SET-2 and HEL92.1.7 cells to BETi (OTX015) (Figure 4F; supplemental Figure 6I-J). Conversely, ectopic overexpression of TCF7L2 or JMJD6 conferred relative resistance to BETi (OTX015)-induced apoptosis in SET-2 and HEL92.1.7 cells (Figure 4G-H; supplemental Figure 6K-L). Correspondingly, this altered LD50 values for OTX015 in SET-2-OTX P/R and HEL-OTX P/R as compared with SET-2 and HEL92.1.7 cells (supplemental Table 3A-B). Whereas knockout and overexpression of TCF7L2 reduced or increased JMJD6 expression, respectively, JMJD6 knockout or overexpression did not affect TCF7L2 expression, indicating that TCF7L2 is upstream and regulates JMJD6 expression (Figure 4B,D,G; supplemental Figure 6C,G,K).
Targeting the β-catenin–TCF7L2–JMJD6–MYC axis is effective against adaptive or innate BETi resistance in sAML cells
We next determined the activity of BC2059, which depletes nuclear β-catenin levels, and of BET-PROTAC ARV-825, which depletes BRD4 against BETi-P/R sAML cells. BC2059 treatment reduced nuclear levels of β-catenin and TCF7L2, but not of TBL1, as well as reduced the nuclear colocalization of β-catenin with TCF7L2 and TBL1 in SET-2-OTX P/R and HEL-OTX P/R, as well as in SET-2 and HEL92.1.7 cells (Figure 5A; supplemental Figure 7A). Concomitantly, BC2059 treatment dose-dependently induced higher levels of apoptosis in BETi-P/R (SET-2-OTX P/R more than HEL-OTX P/R) vs control sAML cells (Figure 5B). BC2059 treatment also reduced levels of TCF7L2, JMJD6, c-Myc, Survivin, CDK4/6, and Bcl-xL but increased Axin2, p21, and cleaved PARP levels, again in SET-2-OTX P/R more so than in HEL-OTX P/R cells (Figure 5C). Treatment with ARV-825 also dose-dependently induced apoptosis in SET-2-OTX P/R and HEL-OTX P/R, as well as in SET-2 and HEL92.1.7 cells, although SET-2-OTX P/R cells were more sensitive than HEL-OTX P/R cells to ARV-825 (Figure 5E). ARV-825 treatment attenuated c-Myc, TCF7L2, JMJD6, c-Myb, RUNX1, PU.1, CDK4/6, and Bcl-xL to a similar extent in BETi-P/R and their sensitive controls (Figure 5D). BET-PROTAC ARV-771 also exerted similar levels of lethality against SET-2-OTX P/R and SET-2 cells, although HEL-OTX P/R and HEL92.1.7 cells were less sensitive to ARV-771 (supplemental Figure 7B). Next, we determined the range of sensitivity of patient-derived, post-MPN, CD34+ sAML blasts to BETi. Whereas 18 of the 35 samples of sAML blasts were sensitive (median LD50 dose was 2 µM), the remaining samples were relatively resistant to lethal effects of OTX015 (median LD25 dose was 2 µM) (Figure 6A). Relatively BETi resistant (compared with sensitive) sAML blasts displayed higher mRNA and mean fluorescence intensity of protein expressions of TCF7L2 and JMJD6 (Figure 6B; supplemental Figure 7C-D). Confocal microscopy confirmed that individual samples of relatively BETi-resistant sAML blasts exhibited higher nuclear expression of TCF7L2 and JMJD6 (Figure 6C). Notably, compared with sensitive sAML blasts, relatively resistant sAML blasts expressed higher median levels of mRNA and protein expression of c-Myc (Figure 6D; supplemental Figure 7C). Following treatment with OTX015 and washout, c-Myc and JMJD6 expression were rapidly restored (within 24 hours) in 2 representative sAML blast samples (supplemental Figure 7E). Figure 6E-F demonstrates that ARV-771 and BC2059 dose-dependently induced loss of viability in BETi-resistant sAML blasts. Cotreatment with ARV-771 and BC2059 was synergistically lethal against BETi-resistant and BETi-sensitive sAML blasts (Figure 6G; supplemental Figure 7F). The combination was also synergistically lethal against de novo AML blasts (supplemental Figure 7F, right panel). In contrast, BC2059 alone, and its combination with ARV-771, induced significantly less lethality in normal CD34+ progenitor cells (supplemental Figure 7G). We also determined the effects of the CRISPR/Cas9-knockout of TCF7L2 and JMJD6 in BETi-resistant sAML blasts (sample 43 in the oncoplot in supplemental Figure 1B). Confocal microscopy findings in Figure 6H and supplemental Figure 7H demonstrate that CRISPR/Cas9 knockout markedly depleted nuclear protein levels of TCF7L2 and JMJD6 in sAML blasts. This led to a loss of viability of the sAML blasts (Figure 6I). Notably, knockout of TCF7L2 and JMJD6 resensitized and markedly increased OTX015-mediated loss of viability of the sAML blasts (Figure 6J).

Treatment with BET-PROTAC and BC2059 exerts synergistic lethal activity in BETi-sensitive and resistant PD-CD34+ sAML cells. (A) PD CD34+ sAML cells (n = 35) were treated with the indicated concentrations of OTX015 for 48 hours. After this, the percentage of propidium iodide–positive, nonviable cells were determined by flow cytometry. Samples were separated based on response to OTX015 as sensitive (mean LD50 dose = 2 µM) or resistant (mean LD25 dose = 2 µM) to OTX015 treatment. (B) Violin plot of the mean fluorescence intensity of TCF7L2 or JMJD6 staining (as determined by confocal microscopy) in 11 sAML blast samples that were sensitive or resistant to OTX015 treatment. Asterisks (****) indicate mean fluorescence intensity values that are significantly greater (P < .0001) in sAML blasts resistant to OTX015 compared with sensitive sAML blast samples. (C) Representative images of sAML blast samples analyzed for TCF7L2 and JMJD6 expression by confocal microscopy (original magnification ×100). (D) Scatterplot of relative c-Myc protein expression in 17 sAML blast samples sensitive or resistant to OTX015 treatment. Asterisk (*) indicates c-Myc expression levels that are significantly greater (P < .05) in OTX015-resistant sAML blasts compared with OTX015-sensitive sAML blasts. (E-F) PD, CD34+ sAML cells determined to be resistant to OTX015 were treated with the indicated concentrations of ARV-771 (n = 10) or BC2059 (n = 15) for 48 hours. Then, the percentage of propidium iodide–positive, nonviable cells were determined by flow cytometry. (G) PD, CD34+ sAML blast cells resistant to OTX015 were treated with ARV-771 (dose range, 20-250 nM) and/or BC2059 (10-100 nM) for 48 hours. The percentage of propidium iodide–positive, nonviable cells were determined by flow cytometry. The graph shows the range of confidence interval (CI) values in each sAML sample following the combination treatments. CI values <1.0 indicate a synergistic interaction of the drugs. (H) PD, sAML blast cells were transfected with negative control sgRNA, TCF7L2 sgRNA, or JMJD6 sgRNA and incubated on a monolayer of GFP-expressing HS5 cells for 5 days. Then, cells were cytospun onto glass slides and immunostained for TCF7L2, JMJD6, or c-Myc expression. Nuclei were stained with DAPI. Cells were imaged by confocal microscopy (original magnification ×100). (I) PD, sAML blast cells were transfected and cultured as in panel H. The cell viability of the sAML cells was monitored over 7 days. Asterisks (**) indicate cell viability values significantly less (P < .01) in TCF7L2 or JMJD6 sgRNA-transfected cells compared with negative control sgRNA-transfected cells. (J) PD, sAML blast cells were transfected and cultured as in panel H for 5 days. Then, cells were treated with the indicated concentrations of OTX015 for 48 hours. At the end of treatment, the percentage of propidium iodide–positive, nonviable cells was determined by flow cytometry.
Treatment with BET-PROTAC and BC2059 exerts synergistic lethal activity in BETi-sensitive and resistant PD-CD34+ sAML cells. (A) PD CD34+ sAML cells (n = 35) were treated with the indicated concentrations of OTX015 for 48 hours. After this, the percentage of propidium iodide–positive, nonviable cells were determined by flow cytometry. Samples were separated based on response to OTX015 as sensitive (mean LD50 dose = 2 µM) or resistant (mean LD25 dose = 2 µM) to OTX015 treatment. (B) Violin plot of the mean fluorescence intensity of TCF7L2 or JMJD6 staining (as determined by confocal microscopy) in 11 sAML blast samples that were sensitive or resistant to OTX015 treatment. Asterisks (****) indicate mean fluorescence intensity values that are significantly greater (P < .0001) in sAML blasts resistant to OTX015 compared with sensitive sAML blast samples. (C) Representative images of sAML blast samples analyzed for TCF7L2 and JMJD6 expression by confocal microscopy (original magnification ×100). (D) Scatterplot of relative c-Myc protein expression in 17 sAML blast samples sensitive or resistant to OTX015 treatment. Asterisk (*) indicates c-Myc expression levels that are significantly greater (P < .05) in OTX015-resistant sAML blasts compared with OTX015-sensitive sAML blasts. (E-F) PD, CD34+ sAML cells determined to be resistant to OTX015 were treated with the indicated concentrations of ARV-771 (n = 10) or BC2059 (n = 15) for 48 hours. Then, the percentage of propidium iodide–positive, nonviable cells were determined by flow cytometry. (G) PD, CD34+ sAML blast cells resistant to OTX015 were treated with ARV-771 (dose range, 20-250 nM) and/or BC2059 (10-100 nM) for 48 hours. The percentage of propidium iodide–positive, nonviable cells were determined by flow cytometry. The graph shows the range of confidence interval (CI) values in each sAML sample following the combination treatments. CI values <1.0 indicate a synergistic interaction of the drugs. (H) PD, sAML blast cells were transfected with negative control sgRNA, TCF7L2 sgRNA, or JMJD6 sgRNA and incubated on a monolayer of GFP-expressing HS5 cells for 5 days. Then, cells were cytospun onto glass slides and immunostained for TCF7L2, JMJD6, or c-Myc expression. Nuclei were stained with DAPI. Cells were imaged by confocal microscopy (original magnification ×100). (I) PD, sAML blast cells were transfected and cultured as in panel H. The cell viability of the sAML cells was monitored over 7 days. Asterisks (**) indicate cell viability values significantly less (P < .01) in TCF7L2 or JMJD6 sgRNA-transfected cells compared with negative control sgRNA-transfected cells. (J) PD, sAML blast cells were transfected and cultured as in panel H for 5 days. Then, cells were treated with the indicated concentrations of OTX015 for 48 hours. At the end of treatment, the percentage of propidium iodide–positive, nonviable cells was determined by flow cytometry.
Synergistic activity of cotreatment with BC2059 and BET-PROTAC against BETi-resistant de novo AML and sAML cells
As shown in Figure 7A, combination of ARV-771 and BC2059 was synergistically lethal against SET-2-OTX P/R, HEL-OTX P/R, and THP1-OTX P/R (de novo AML), as well as against SET-2, HEL92.1.7, and THP1 cells (CI <1.0). Next, we also determined the in vivo activity of ARV-771 and BC2059 combination against tail-vein infused HEL-OTX P/R post-MPN sAML cells engrafted in NSG mice. As compared with treatment with vehicle control or ARV-771 or BC2059 alone, cotreatment with BC2059 and ARV-771 was significantly more effective in reducing sAML growth of HEL-OTX P/R-GFP-Luc cells (Figure 7B; supplemental Figure 8A). Combined treatment with ARV-771 and BC2059 (vs each agent alone) significantly improved the median survival of the NSG mice (Figure 7C). We next determined the in vivo activity of ARV-771 and BC2059 cotreatment against a patient-derived xenograft (PDX) model of AML blasts that exhibited high in vitro mean LD50 for OTX015 (12.5 µM) but lower mean LD50 for ARV-771 (42 nM) and BC2059 (10 nM) (sample 22 in the oncoplot in supplemental Figure 1A). These AML blasts also showed detectable protein expression of TCF7L2, JMJD6, c-Myc, PU.1, and Bcl-xL (Figure 7D). As compared with vehicle control or each drug alone, cotreatment with ARV-771 and BC2059 was significantly more effective in reducing in vivo growth and improving median survival of NSG mice engrafted with GFP-Luc transduced AML blasts (Figure 7E-F; supplemental Figure 8B). Thus, combined therapy with a BET protein degrader as well as a disruptor of TCF7L2 and β-catenin binding markedly depletes c-Myc and overcomes BETi resistance in AML and post-MPN sAML blasts.
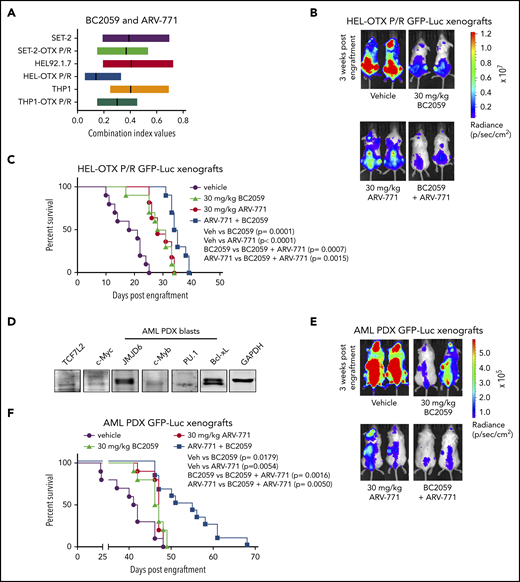
Combined treatment with ARV-771 and BC2059 exhibits superior antileukemia activity compared with treatment with either agent alone in NSG mice engrafted with OTX-P/R sAML cells or innately resistant patient-derived AML xenografts. (A) SET-2, SET-2-OTX P/R, HEL, HEL-OTX P/R, THP1, and THP1 OTX P/R cells were treated with ARV-771 (dose range, 20-250 nM) and/or BC2059 (10-100 nM) for 48 hours. Following this, the percentage of annexin V–positive, apoptotic cells were determined by flow cytometry. CI values were calculated utilizing Compuyn and graphed with GraphPad V7. The box plot shows the range of CI values in each cell line treated with the combination. CI values <1.0 indicate a synergistic interaction of the drugs. (B) HEL-OTX P/R-GFP-Luc cells were engrafted into preirradiated NSG mice. Once engraftment was confirmed by bioluminescent imaging (Xenogen IVIS), mice were divided into groups and treated with vehicle, ARV-771, and/or BC2059 as indicated for 3 weeks. Mice were imaged weekly to document treatment efficacy. (C) Kaplan-Meier survival plot of NSG mice engrafted with HEL-OTX P/R-GFP-Luc cells and treated for 3 weeks with ARV-771 and/or BC2059. (D) Immunoblot analysis of protein expression in AML PDX blast cells. The expression levels of GAPDH served as the loading control. (E) Innately BETi-resistant AML PDX-GFP-Luc cells were engrafted into preirradiated NSG mice. Once engraftment was confirmed by bioluminescent imaging (Xenogen IVIS), mice were divided into groups and treated with vehicle, ARV-771, and/or BC2059 as indicated for 3 weeks. Mice were imaged weekly to document treatment efficacy. (F) Kaplan-Meier survival plot of NSG mice engrafted with BETi-resistant AML PDX-GFP-Luc cells and treated for 3 weeks with ARV-771 and/or BC2059.
Combined treatment with ARV-771 and BC2059 exhibits superior antileukemia activity compared with treatment with either agent alone in NSG mice engrafted with OTX-P/R sAML cells or innately resistant patient-derived AML xenografts. (A) SET-2, SET-2-OTX P/R, HEL, HEL-OTX P/R, THP1, and THP1 OTX P/R cells were treated with ARV-771 (dose range, 20-250 nM) and/or BC2059 (10-100 nM) for 48 hours. Following this, the percentage of annexin V–positive, apoptotic cells were determined by flow cytometry. CI values were calculated utilizing Compuyn and graphed with GraphPad V7. The box plot shows the range of CI values in each cell line treated with the combination. CI values <1.0 indicate a synergistic interaction of the drugs. (B) HEL-OTX P/R-GFP-Luc cells were engrafted into preirradiated NSG mice. Once engraftment was confirmed by bioluminescent imaging (Xenogen IVIS), mice were divided into groups and treated with vehicle, ARV-771, and/or BC2059 as indicated for 3 weeks. Mice were imaged weekly to document treatment efficacy. (C) Kaplan-Meier survival plot of NSG mice engrafted with HEL-OTX P/R-GFP-Luc cells and treated for 3 weeks with ARV-771 and/or BC2059. (D) Immunoblot analysis of protein expression in AML PDX blast cells. The expression levels of GAPDH served as the loading control. (E) Innately BETi-resistant AML PDX-GFP-Luc cells were engrafted into preirradiated NSG mice. Once engraftment was confirmed by bioluminescent imaging (Xenogen IVIS), mice were divided into groups and treated with vehicle, ARV-771, and/or BC2059 as indicated for 3 weeks. Mice were imaged weekly to document treatment efficacy. (F) Kaplan-Meier survival plot of NSG mice engrafted with BETi-resistant AML PDX-GFP-Luc cells and treated for 3 weeks with ARV-771 and/or BC2059.
Discussion
In the present studies, we document active SEs/Es with increased expression levels of TCF7L2, JMJD6, and c-Myc as the mechanism underlying BETi resistance in AML and post-MPN sAML cells. BETi-resistant sAML cells did not exhibit copy-number gains of MYC. They also did not exhibit higher levels of BRD4 or p-BRD4.25-28 This excluded any significant contribution of altered BRD4 stability or its avidity for acetylated histones, MED1, and TFs.9,25 Consistent with this, BETi-P/R and BETi-sensitive sAML cells expressed similar levels of the E3 ligase TRIM33 and of SPOP and DUB3.26-28 Additionally, absent detectable mutations in BRD4 (not shown) or new driver oncogene mutations, dysregulated Es, and increased gene expression of TCF7L2, JMJD6, and c-Myc were the key determinants of BETi resistance in BETi-P/R sAML cells.
BRD4 occupancy was reported to be reduced at MYC SE in genetically engineered mouse BETi-resistant AML stem/progenitor cells.32 In contrast, our findings demonstrate that human BETi-P/R sAML cells, compared with their sensitive counterparts, exhibit increased BRD4 and H3K27Ac occupancy at the TCF7L2 E and MYC SE. This was associated with increased expression of TCF7L2–JMJD6–c-Myc axis members in BETi-P/R over BETi-sensitive sAML cells. RNA-seq and GSEA data also indicated increased activity of this axis in BETi-P/R sAML cells. Increased expression of TCF7L2 and its binding to β-catenin, with increased expression of its targets, including c-Myc, also underscored increased activity of the TCF7L2–JMJD6–c-Myc axis in BETi-P/R sAML cells. Indeed, the majority of transcriptionally up regulated genes, common to SET-2-OTX P/R and HEL-OTX P/R cells, were targets of WNT–β-catenin signaling. Higher expression of the TCF7L2–JMJD6–c-Myc axis proteins retained BRD4 dependency, since inhibition of BRD4 activity by BETi or BRD4 depletion by BET-PROTAC reduced expression of TCF7L2–JMJD6–c-Myc axis proteins. In AML cells, recruitment of BRD4 to their SEs/Es promotes activities of an ensemble of myeloid TFs, including RUNX1, c-Myb, and PU.1, in addition to c-Myc.9,-48 Accordingly, BRD4 depletion by BET-PROTAC reduced levels of these transcriptional regulators.38,47 How BRD4 is recruited to MYC SE/Es (despite BETi treatment) is not formally established here, but bromodomain-independent, direct interaction of BRD4 with TCF7L2 may be facilitating increased occupancy of BRD4 and TCF7L2 at MYC Es in BETi-P/R compared with BETi-sensitive sAML cells.9,49 Bromodomain-independent interactions of BRD4 have been documented with other transcriptional regulators, including TP53, YY1, and CEBPα.49 Overall, BRD4 recruitment and dependency at active TCF7L2, JMJD6, MYC, and PIM1 Es is retained in BETi-P/R sAML cells. Collectively, our findings here establish that epigenomic and transcriptional dysregulation of TCF7L2 and MYC leads to higher nuclear levels and colocalization of β-catenin with TCF7L2 and TBL1, which results in higher c-Myc expression in BETi-P/R compared with sAML cells.
Compared with BETi-sensitive sAML cells, following BETi treatment MYC mRNA repression was more rapidly corrected and c-Myc levels restored in human BETi-P/R sAML cells, which was previously linked mechanistically to BETi resistance.31,32 Additionally, protein levels of TCF7L2, JMJD6, and c-Myc were also more rapidly restored in BETi-P/R sAML cells. This indicates that not only the higher pretreatment levels but also more rapid restoration of TCF7L2, JMJD6, and c-Myc expression post-BETi treatment contributes to BETi resistance in BETi-P/R sAML cells. Notably, CRISPR/Cas9-mediated knockout of TCF7L2 decreased nuclear levels and colocalization of TCF7L2 with β-catenin and TBL1, repressed c-Myc, and inflicted greater lethality in BETi-P/R compared with BETi-sensitive sAML cells. Since TF occupancy recruits BRD4 and in turn JMJD6 to chromatin of SEs/Es, TCF7L2 knockout repressed JMJD637,38 and reduced c-Myb, RUNX1, PU.1, and Bcl-xL levels in BETi-P/R sAML cells, causing greater loss of viability of BETi-P/R compared with BETi-sensitive sAML cells. JMJD6 demethylates histone H4R3 and 7SK RNA, removing their repression of pTEFb-RNAP2–induced mRNA transcript elongation, especially of MYC.9,37 Indeed, JMJD6 has been implicated in E-mediated transcriptional pause-release and adaptations promoting survival under stress.38 Knockout of JMJD6 did not affect TCF7L2 levels more than slightly, but it markedly reduced levels of JMJD6, c-Myc, c-Myb, RUNX1, PU.1, and Bcl-xL in BETi-PR sAML cells. Accordingly, JMJD6 knockout was also more lethal against BETi-P/R than BETi-sensitive sAML cells. Notably, knockout of either TCF7L2 or JMJD6 resulted in resensitization of BETi-P/R sAML cells to BETi-induced apoptosis. Mechanistic linkage of TCF7L2 and JMJD6 overexpression to BETi resistance is further supported by our findings that ectopic overexpression of TCF7L2 or JMJD6 conferred BETi resistance in BETi-sensitive sAML cells. Collectively, findings presented highlight not only the basis of increased expression but also the mechanistic involvement of TCF7L2–JMJD6–c-Myc axis in regulating BETi sensitivity/resistance in sAML cells.
In patient-derived de novo and post-MPN sAML blasts, relative ex vivo innate resistance to BETi was associated with increased mRNA and protein expression of TCF7L2, JMJD6, and c-Myc. Notably, CRISPR/Cas9-mediated knockout of TCF7L2 or JMJD6 also depleted c-Myc levels, inducing lethality and significantly increasing ex vivo BETi sensitivity in innately resistant patient-derived sAML blasts. Thus, the β-catenin–TCF7L2–JMJD6–c-Myc axis is involved in mediating both adaptive and innate BETi resistance in human AML blasts. A similar common mechanism for adaptive and innate BETi resistance was also demonstrated in human neuroblastoma cells.30 A more definitive in vivo confirmation that increased activity of the β-catenin–TCF7L2–JMJD6–c-Myc axis mediates innate BETi resistance will require validation through clinical phase 2 studies of BETi in AML, including post-MPN sAML. Our findings also demonstrate that targeted disruption of β-catenin–TCF7L2 and downstream depletion of c-Myc by BRD4 depletion overcomes BETi resistance in BETi-P/R sAML cells. Treatment with BC2059, which attenuated levels and colocalization of β-catenin with TCF7L2 and reduced JMJD6 and c-Myc levels in BETi-P/R sAML cells, combined with BET-PROTAC treatment, which depleted BRD4 levels, attenuated TCF7L2, JMJD6, and c-Myc levels and induced lethality in not only BETi-sensitive but also BETi-P/R sAML cells. Recently, following its recruitment by TFs, BRD4, in turn, was shown to recruit Mediator protein and RNAP2 to form small or large stable clusters on the chromatin of active gene Es/promoters.50 These clusters exhibited properties of phase separated biomolecular condensates in close proximity of actively transcribed genes, indicating that diverse activation domains of TFs form phase-separated condensates with mediator and RNAP2 to activate genes.51,52 By depleting BRD4, TCF7L2, and JMJD6, it is possible that BET-PROTACs may abrogate these phase-separated clusters and condensates, accounting for synergistic lethality due to cotreatment with BC2059 and BET-PROTAC against not only BETi-sensitive but also BETi-P/R sAML cells. Cotreatment with BC2059 and BET-PROTAC also reduced in vivo sAML burden and improved survival of mice engrafted either with BETi-P/R sAML cells exhibiting adaptive BETi resistance or with innately BETi-resistant AML blasts. Therefore, it is also possible that in the clinic, cotreatment with BC2059 and BET-PROTAC may overcome innate BETi resistance in post-MPN sAML cells. Our findings also suggest that whereas increased nuclear expression of TCF7L2, JMJD6, and c-Myc, as well as increased binding of β-catenin and TCF7L2 in the nucleus, may predict BETi resistance, they may also indicate sensitivity of AML cells to combined treatment with BC2059 and BET-PROTAC.
The RNA-seq and ChIP-seq datasets reported in this article have been deposited in the Gene Expression Omnibus database (accession number GSE145276).
The online version of this article contains a data supplement.
The publication costs of this article were defrayed in part by page charge payment. Therefore, and solely to indicate this fact, this article is hereby marked “advertisement” in accordance with 18 USC section 1734.
Acknowledgments
The authors would like to thank the Sequencing and Microarray Core Facility, Flow Cytometry and Cellular Imaging Core Facility, which are supported by National Institutes of Health (NIH)/National Cancer Institute grant P30 CA016672-40 to the MD Anderson Cancer Center. C.C. acknowledges support from CPRIT RP170005, NIH/National Institute of Environmental Health Sciences grant P30 ES030285 CG-CPEH, and NIH/National Cancer Institute (NCI) Cancer Center support grant P30 CA125123 to the Dan L. Duncan Cancer Center. C.M.C. acknowledges support from the NIH/NCI grant (grant R35 CA197589) and Arvinas. This research is supported, in part, by NIH/NCI grant P50 CA100632 to the MD Anderson Cancer Center (Leukemia SPORE).
Authorship
Contribution: K.N.B. designed the study; D.P. and C.C. performed bioinformatics analyses; D.T.S., W.F., C.P.M., B.H.L., V.K., T.M., S.B., and C.Y.L. performed research and analyzed the data; S.S., S.K.H., P.B., T.M.K., L.M., C.D.D., G.B., J.D.K., K.T., M.R.G, C.M.C., and S.V. contributed critical reagents; and K.N.B. and W.F. wrote the paper.
Conflict-of-interest disclosure: C.M.C. is the founder and chief scientific advisor of, and possesses an equity ownership stake in, Arvinas. S.S. is the founder of Iterion Therapeutics. S.K.H. is the founder and chief scientific officer of Iterion Therapeutics. K.N.B. is a consultant for Iterion Therapeutics. The remaining authors declare no competing financial interests.
Correspondence: Kapil N. Bhalla, Department of Leukemia, The University of Texas MD Anderson Cancer Center, 1400 Holcombe Blvd, Unit 428, Houston, TX, 77030; e-mail: kbhalla@mdanderson.org.

This feature is available to Subscribers Only
Sign In or Create an Account Close Modal