

Key Points
Specific mutations, including TP53 and SF3B1, but not DNMT3A, TET2, and ASXL1, were enriched in older individuals with anemia.
In general, clones only confer a limited selective advantage over time, which is differentially affected by specific driver genes.

Abstract
Anemia is a major and currently poorly understood clinical manifestation of hematopoietic aging. Upon aging, hematopoietic clones harboring acquired leukemia-associated mutations expand and become detectable, now referred to as clonal hematopoiesis (CH). To investigate the relationship between CH and anemia of the elderly, we explored the landscape and dynamics of CH in older individuals with anemia. From the prospective, population-based Lifelines cohort (n = 167 729), we selected all individuals at least 60 years old who have anemia according to World Health Organization criteria (n = 676) and 1:1 matched control participants. Peripheral blood of 1298 individuals was analyzed for acquired mutations at a variant allele frequency (VAF) of 1% or higher in 27 driver genes. To track clonal evolution over time, we included all available follow-up samples (n = 943). CH was more frequently detected in individuals with anemia (46.6%) compared with control individuals (39.1%; P = .007). Although no differences were observed regarding commonly detected DTA mutations (DNMT3A, TET2, ASXL1) in individuals with anemia compared with control individuals, other mutations were enriched in the anemia cohort, including TP53 and SF3B1. Unlike individuals with nutrient deficiency (P = .84), individuals with anemia of chronic inflammation and unexplained anemia revealed a higher prevalence of CH (P = .035 and P = .017, respectively) compared with their matched control individuals. Follow-up analyses revealed that clones may expand and decline, generally showing only a subtle increase in VAF (mean, 0.56%) over the course of 44 months, irrespective of the presence of anemia. Specific mutations were associated with different growth rates and propensities to acquire an additional hit. In contrast to smaller clones (<5% VAF), which did not affect overall survival, larger clones were associated with increased risk for death.
Introduction
Next-generation sequencing (NGS) has facilitated the detection of genetic mosaic events in the hematopoietic system. The term clonal hematopoiesis (CH) is used to describe a process whereby genetically distinct hematopoietic stem and progenitor cells have given rise to a detectable fraction of peripheral blood cells carrying an acquired genetic variant. Landmark studies, using pooled available cohort studies, have revealed the age-related emergence of clonal somatic mutations in a major proportion of individuals.1-3 Although generally occurring in otherwise healthy individuals without noticeable symptoms, CH has been shown to be associated with blood cancer, cardiovascular disease, and a pro-inflammatory signature.1,2,4-6 This has provoked interest in the emergence of somatic clones as a condition underlying common age-related diseases.
It is currently unknown whether CH is also associated with other characteristics of the aging hematopoietic system. As the most common cytopenia in older individuals, anemia is a major phenotypic and clinical manifestation of hematopoietic aging. Even mild anemia in older individuals is associated with significant morbidity and mortality.7 Despite the availability of extensive diagnostic tools, the underlying cause of anemia currently remains unknown in about one-third of cases.8 Lower-risk myelodysplastic syndromes have been suggested to account for at least a fraction of these so-called unexplained anemias of the elderly.9,10
We explored the landscape and dynamics of CH in 676 older cases with anemia and 676 matched control individuals from a large prospective population-based cohort. Using error-corrected targeted NGS, we identified and tracked the occurrence and evolution of somatic mutations over time.
Methods
Study population and sample collection
This study was performed using data and biomaterial from the Lifelines cohort, a multidisciplinary prospective population-based cohort study of individuals living in the northern part of The Netherlands (n = 167 729).11 A comprehensive baseline assessment as well as a first follow-up visit have now been completed, including biomaterial collection. Written informed consent was obtained from all individual participants included in the study. The research protocol was approved by the medical ethical committee of the University Medical Center Groningen, The Netherlands. The Lifelines study is carried out in accordance with the Declaration of Helsinki. Further details regarding study design, procedures, and data and biospecimen collection within the Lifelines cohort are listed in the supplemental Methods, available on the Blood Web site.
Within the Lifelines cohort, we selected all older individuals (≥60 years) with anemia according to World Health Organization criteria: less than 13.0 g/dL (<8.0 mmol/L) in men and less than 12.0 g/dL (<7.5 mmol/L) in women. A control cohort was selected by 1:1 matching for age, sex, body mass index, smoking, and number of medications (as a surrogate measure for comorbidity; supplemental Table 1).
Stored plasma samples of Lifelines participants were collected for assays to determine the type of anemia (supplemental Methods). For NGS, all available genomic DNA samples from the biobank for baseline and first follow-up visit were collected. Genomic DNA was isolated from whole-blood specimens. All available genomic DNA samples at baseline and follow-up visit for the anemia and control cohort were collected and used for NGS.
Targeted error-corrected NGS
A custom panel of single-molecule-tagged molecular inversion probes was designed, covering target regions in 27 myeloid and lymphoid malignancy-associated driver genes (supplemental Table 2). Details regarding panel design, library preparation, and data analysis are outlined in the supplemental Methods. Molecular inversion probe libraries were paired-end sequenced on the Illumina NovaSeq 6000 or NextSeq500 platform (Illumina, San Diego, CA). Somatic variants were called using the following criteria (≥1% variant allele frequency [VAF] and ≥10 mutant unique single-molecule-tagged molecular inversion probes). All variants were inspected and curated with exclusion of recurrent artifacts and polymorphisms.
Statistical analyses
All statistical analyses were performed using R statistical computing software version 3.5.2. Differences in group proportions were assessed using the X2-test or Fisher’s exact test, as appropriate. Odds ratios (ORs) were calculated based on 2 × 2 contingency tables for cases with anemia and control individuals.
Overall survival (OS) was defined as time from baseline visit until death from any cause or censoring. The Kaplan-Meier estimator was used for visual comparison of OS. Univariable and multivariable analyses for OS were performed using Cox proportional hazards regression, with P values reported from Wald test. Age and sex were included as covariates in multivariable models. Hazard ratios (HRs) are reported with 95% confidence intervals (CIs). All statistical tests were performed 2-sided, and a value of P < .05 was considered significant. Details regarding statistical analyses are provided in the supplemental Methods.
Results
Anemia and CH constitute hallmarks of the aging hematopoietic system
On the basis of World Health Organization criteria, we identified 676 individuals with anemia out of 22,108 evaluable Lifelines participants aged at least 60 years. The presence of anemia showed a strong relationship with age, as expected (Figure 1A). Sequencing results were obtained for 635 patients with anemia and 663 control subjects. We identified 852 somatic mutations in 555 individuals, corresponding to a prevalence for CH of 43% (supplemental Tables 3-4; supplemental Figures 1-4). The emergence of CH strongly correlated with advancing age (Figure 1B; supplemental Figures 5-6), with every additional year of age being associated with 1.07 odds (95% CI, 1.05-1.09; P < .001) of having acquired at least 1 somatic variant. In line with previous reports, most commonly affected genes were DNMT3A, TET2, and ASXL1 (DTA; supplemental Figures 7-9). With increasing age, we observed a relatively higher proportion of somatic mutations in TET2 and ASXL1 compared with DNMT3A (Figure 1C).
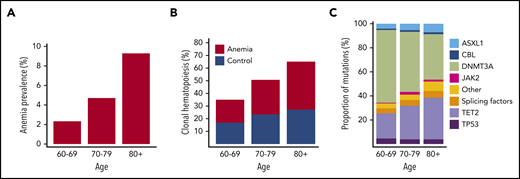
Anemia and CH constitute age-related phenomena of the hematopoietic system. (A) Prevalence of anemia according to age in the evaluable Lifelines cohort aged at least 60 years (n = 22,108). (B) Prevalence of CH according to age among cases with anemia (red, n = 635) and control individuals (blue, n = 663). (C) Relative frequencies of mutations detected in the indicated genes across different age categories for the entire cohort (n = 1298). The category of splicing factors includes SF3B1, SRSF2, and U2AF1.
Anemia and CH constitute age-related phenomena of the hematopoietic system. (A) Prevalence of anemia according to age in the evaluable Lifelines cohort aged at least 60 years (n = 22,108). (B) Prevalence of CH according to age among cases with anemia (red, n = 635) and control individuals (blue, n = 663). (C) Relative frequencies of mutations detected in the indicated genes across different age categories for the entire cohort (n = 1298). The category of splicing factors includes SF3B1, SRSF2, and U2AF1.
Mutational signature associated with anemia in older individuals
Individuals with anemia were more likely to harbor somatic mutations indicative of CH (296/635 individuals; 46.6%) compared with matched control individuals (259/663 individuals; 39.1%; P = .007), independent of severity of anemia (supplemental Figures 10-11). Overall, the mutational spectrum for anemic and control cases was roughly similar (Figure 2A). The frequency of DNMT3A (29.1% vs 26.1%; OR, 1.16; 95% CI, 0.91-1.50; P = .24), TET2 (14.5% vs 12.5%; OR, 1.18; 95% CI, 0.85-1.65; P = .33), and ASXL1 (3.3% vs 2.9%; OR, 1.16; 95% CI, 0.59-2.30; P = .75) mutations was comparable for cases with anemia and control individuals (Figure 2B). In addition, no difference was observed for DNMT3A R882 mutations (n = 20; supplemental Table 3). The presence of anemia was not associated with multiple mutations in DTA genes, nor a higher allelic burden for DTA mutations (supplemental Figures 12-13). In contrast, CH with somatic mutations in genes other than DTA was enriched in the anemia cohort (OR, 1.80; 95% CI, 1.20-2.70; P = .003; Figure 2C). Also, the presence of comutation patterns involving DTA genes and any other variant was associated with anemia (OR, 1.94; 95% CI, 1.10-3.53; P = .016; supplemental Figures 13-14). In individuals with CH, anemia was not significantly associated with a higher number of mutated genes (median, 1 vs 1; P = .38; Figure 2D; supplemental Figure 15), nor a higher maximum VAF (median, 3.35% [range, 1%-61%] vs median, 2.80% [range, 1%-47%]; P = .068; Figure 2E; supplemental Figures 16-17).
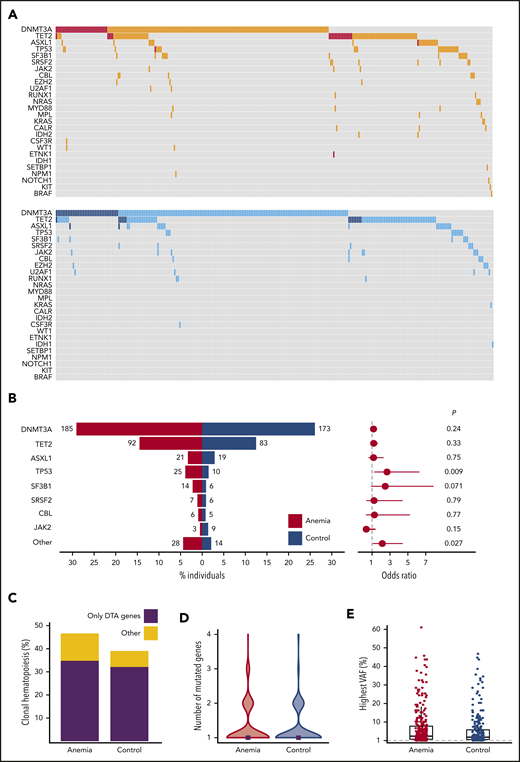
Spectrum of CH for cases with anemia and control individuals. (A) Mutational landscapes for all somatic mutations detected in the anemia (top, red) and control (bottom, blue) cohort. A darker shade indicates 2 or more mutations in the same gene for the respective individual. (B, left) contribution of recurrently mutated genes to the spectrum of CH detected in the anemia (red) and control (blue) cohort. Bars indicate the proportion of individuals with a gene mutation, whereas absolute frequencies are noted for each gene. Forest plot indicating the ORs (circles) and 95% CIs (horizontal lines) for recurrently mutated genes occurring in cases with anemia as compared with control individuals (right). P values are from Fisher’s exact test. The category “other” includes all genes with mutations detected fewer than 10 times. (C) Contribution of CH restricted to DTA (DNMT3A, TET2, ASXL1) genes vs other mutational patterns to the spectrum of CH in cases with anemia and control individuals. (D) Violin plot showing the distribution in the number of mutated genes for cases with anemia (red) and control individuals (blue) with CH. Median number of mutated genes is shown for each cohort (gray rectangles). (E) Highest VAFs detected among individuals with CH from the anemia (red) and control (blue) cohort. Box and whisker plots: boxes represent median, first and third quartiles, with whiskers extending to 1.5× interquartile range.
Spectrum of CH for cases with anemia and control individuals. (A) Mutational landscapes for all somatic mutations detected in the anemia (top, red) and control (bottom, blue) cohort. A darker shade indicates 2 or more mutations in the same gene for the respective individual. (B, left) contribution of recurrently mutated genes to the spectrum of CH detected in the anemia (red) and control (blue) cohort. Bars indicate the proportion of individuals with a gene mutation, whereas absolute frequencies are noted for each gene. Forest plot indicating the ORs (circles) and 95% CIs (horizontal lines) for recurrently mutated genes occurring in cases with anemia as compared with control individuals (right). P values are from Fisher’s exact test. The category “other” includes all genes with mutations detected fewer than 10 times. (C) Contribution of CH restricted to DTA (DNMT3A, TET2, ASXL1) genes vs other mutational patterns to the spectrum of CH in cases with anemia and control individuals. (D) Violin plot showing the distribution in the number of mutated genes for cases with anemia (red) and control individuals (blue) with CH. Median number of mutated genes is shown for each cohort (gray rectangles). (E) Highest VAFs detected among individuals with CH from the anemia (red) and control (blue) cohort. Box and whisker plots: boxes represent median, first and third quartiles, with whiskers extending to 1.5× interquartile range.
TP53 mutations were detected more frequently in individuals with anemia compared with control individuals (OR, 2.67; 95% CI, 1.23-6.29; P = .009). TP53 mutations remained significantly associated with the presence of anemia (OR, 2.22; 95% CI, 1.07-4.96; P = .040) when assessed in a multivariable logistic regression model, using the number of mutated genes as covariate. A comparable OR was found for SF3B1 mutations (OR, 2.47; 95% CI, 0.88-7.88; P = .071) that were detected in 2.2% of individuals with anemia vs 0.9% of control individuals. When grouping together rarely mutated genes (ie, detected in <10 individuals), these mutations were more frequently observed in individuals with anemia (OR, 2.14; 95% CI, 1.08-4.44; P = .027; Figure 2B; supplemental Figures 18-19).
Mutational signature associated with unexplained anemia of the elderly
In general, anemia in older individuals is caused by nutrient deficiencies or chronic inflammation (ACI) or is considered an unexplained anemia of the elderly (UAE). In total, we were able to analyze 591 case-control pairs with NGS data for possible etiology of anemia (supplemental Methods; supplemental Table 5). In contrast to individuals with nutrient deficiencies (P = .84), individuals with ACI and UAE revealed a higher prevalence of CH (P = .035 and P = .017, respectively) compared with their matched control individuals. For ACI, this increase in CH was caused by a higher prevalence of both mutations in DTA genes and non-DTA genes, and for UAE, this increase in CH was selectively caused by a significantly higher prevalence of mutations in non-DTA genes (P = .004; Figure 3A-C). Although analyzing specific mutations for different types of anemia was hampered by low numbers, our data still indicate a higher prevalence of mutations in DNMT3A (P = .022) in ACI and a higher prevalence of mutations in TP53 (P = .017) in UAE (Figure 3D-E; supplemental Figures 20-22).
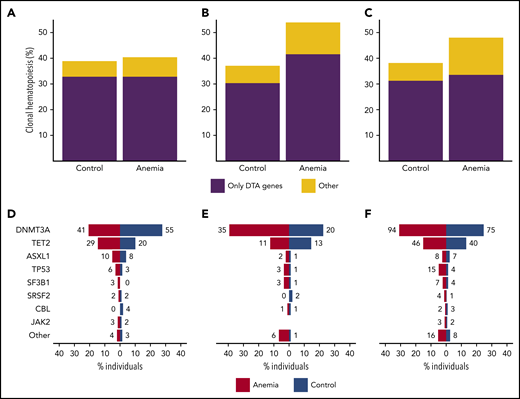
Mutational spectra for different types of anemia. Contribution of CH restricted to DTA (DNMT3A, TET2, ASXL1) genes vs other mutational patterns to the spectrum of CH in cases with nutrient deficiency anemia (n = 198) (A), anemia of chronic disease (n = 89) (B), and unexplained anemia (n = 304) (C). Contribution of recurrently mutated genes to the spectrum of CH, shown for cases with nutrient deficiency anemia (n = 198) (D), anemia of chronic disease (n = 89) (E), and unexplained anemia (n = 304) (F). All cases with anemia were compared with 1:1 matched control individuals. For panels D-F, bars indicate the proportion of individuals with a gene mutation, whereas absolute frequencies are noted for each gene.
Mutational spectra for different types of anemia. Contribution of CH restricted to DTA (DNMT3A, TET2, ASXL1) genes vs other mutational patterns to the spectrum of CH in cases with nutrient deficiency anemia (n = 198) (A), anemia of chronic disease (n = 89) (B), and unexplained anemia (n = 304) (C). Contribution of recurrently mutated genes to the spectrum of CH, shown for cases with nutrient deficiency anemia (n = 198) (D), anemia of chronic disease (n = 89) (E), and unexplained anemia (n = 304) (F). All cases with anemia were compared with 1:1 matched control individuals. For panels D-F, bars indicate the proportion of individuals with a gene mutation, whereas absolute frequencies are noted for each gene.
Distinct features of CH and anemia predict for OS
A higher risk for death was observed for older individuals with anemia (HR, 1.93; 95% CI, 1.58-2.36; P < .001), using a multivariable model with age and sex as covariates. In univariable analysis, the presence of CH was significantly associated with reduced OS for individuals with anemia (HR, 1.54; 95% CI, 1.04-2.30; P = .032). However, after inclusion of age and sex in a multivariable model, we were unable to ascertain this effect of CH on OS of cases with anemia (HR, 1.12; 95% CI, 0.74-1.70; P = .58). Likewise, we did not find an association between CH and OS in the control cohort when assessed in a multivariable model (HR, 1.15; 95% CI, 0.72-1.85; P = .56; Figures 4A-B; supplemental Tables 6-8; supplemental Figures 23-24).
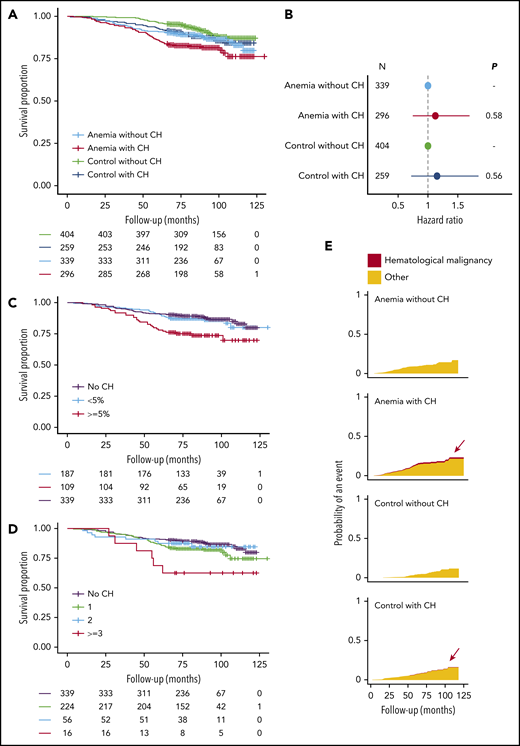
Distinct features of CH and anemia predict for OS. (A) Kaplan-Meier curves for OS, stratified according to the presence of anemia and CH (n = 1298). (B) Forest plot for the risk for death for cases with anemia (n = 635) and control individuals (n = 663) stratified according to the presence of CH. Cox proportional hazards regression included age and sex as covariates. Absence of CH was used as a reference for both cohorts. Circles indicate the HR for each cohort, with horizontal lines corresponding to 95% CIs. (C) Kaplan-Meier curves for OS in the anemia cohort (n = 635) according to largest clone size detected (<5% or ≥5%) or the absence of CH. (D) Kaplan-Meier curves for OS in the anemia cohort (n = 635), according to the number of mutated genes or the absence of CH. (E) Cumulative incidence graphs for mortality from hematological malignancies, stratified according to the presence of anemia and CH (n = 1298). Data on reported primary cause of death were obtained by linkage to the national registry of death statistics. Results for this analysis are based on calculations by the authors using nonpublic microdata from Statistics Netherlands. Colors indicate death from hematological malignancies (red) or other causes (orange).
Distinct features of CH and anemia predict for OS. (A) Kaplan-Meier curves for OS, stratified according to the presence of anemia and CH (n = 1298). (B) Forest plot for the risk for death for cases with anemia (n = 635) and control individuals (n = 663) stratified according to the presence of CH. Cox proportional hazards regression included age and sex as covariates. Absence of CH was used as a reference for both cohorts. Circles indicate the HR for each cohort, with horizontal lines corresponding to 95% CIs. (C) Kaplan-Meier curves for OS in the anemia cohort (n = 635) according to largest clone size detected (<5% or ≥5%) or the absence of CH. (D) Kaplan-Meier curves for OS in the anemia cohort (n = 635), according to the number of mutated genes or the absence of CH. (E) Cumulative incidence graphs for mortality from hematological malignancies, stratified according to the presence of anemia and CH (n = 1298). Data on reported primary cause of death were obtained by linkage to the national registry of death statistics. Results for this analysis are based on calculations by the authors using nonpublic microdata from Statistics Netherlands. Colors indicate death from hematological malignancies (red) or other causes (orange).
As previous studies have used whole-exome sequencing with a higher VAF detection threshold, we questioned whether especially larger clones are associated with dismal prognosis. Carrying a mutation at a VAF of 5% or higher was significantly associated with a higher risk for death for individuals with anemia (Figure 4C; HR, 2.29; 95% CI, 1.43-3.67; P < .001) in univariable analysis. Moreover, we identified individuals with anemia with at least 3 mutated genes at higher risk for death (Figure 4D; HR, 3.15; 95% CI, 1.34-7.41; P = .009). However, in a multivariable analysis with age and sex included as covariates, the association between CH at at least 5% VAF (HR, 1.47; 95% CI, 0.89-2.44; P = .13) or with at least 3 mutated genes (HR, 2.02; 95% CI, 0.85-4.80; P = .11) and OS did not reach statistical significance. Conversely, mutation gain during follow-up was independently associated with worse OS in both univariable and multivariable analysis (HR, 2.64; 95% CI, 1.28-5.46; P = .009; supplemental Table 9).
We performed cause-specific mortality analyses after linkage to the national death statistics registry (supplemental Methods). All individuals with death resulting from hematological malignancy carried 1 or multiple clones (n = 6), of which 5 also had anemia (supplemental Table 10; Figure 4E).
Driver mutations affect expansion rates of CH and propensity to acquire additional mutations
The prospective nature of our cohort allowed us to examine paired samples from 943 individuals to assess evolution of somatic clones over a median period of 44 months (supplemental Figures 25-26). The mutation spectrum at baseline was comparable to the mutation spectrum at follow-up. There was no evidence for potential bias resulting from a deviating mutational pattern at baseline for those individuals lacking follow-up (Figure 5A-C). The VAF of the largest clone at both points strongly correlated (ρ = 0.88; P < .001), with the majority of individuals showing a remarkably stable maximum clone size (supplemental Figure 27).
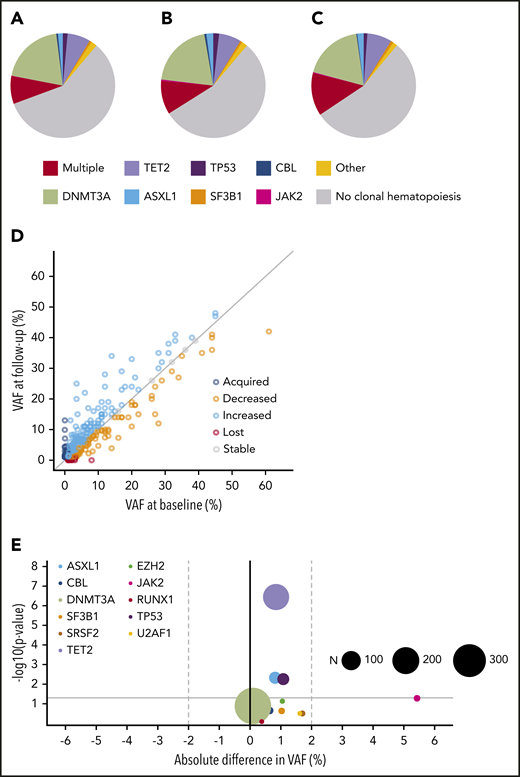
Clonal dynamics (I). Spectrum of CH at baseline (A) and follow-up (B) for individuals with serial molecular data (n = 943). (C) Spectrum of CH at baseline for individuals lacking follow-up. The mutational spectrum for panels A-C was classified as follows: absence of CH, multiple mutated genes, or the presence of a single mutated gene, as indicated. (D) Relation between VAFs at baseline (horizontal axis) and follow-up (vertical axis) for all mutations detected at baseline and/or follow-up visit (n = 715). The gray diagonal line indicates stable VAF. (E) Volcano plot for growth rates of recurrently mutated genes (≥5×). The x-axis displays the mean absolute difference in VAF over time. The y-axis shows the -log10 (P value) indicating the significance of the change in VAF over time (from paired Wilcoxon signed-rank test). The size of each circle corresponds to the overall frequency of the mutation (N) in serial molecular data for 943 individuals, as indicated. The gray horizontal line corresponds to a P value of .05.
Clonal dynamics (I). Spectrum of CH at baseline (A) and follow-up (B) for individuals with serial molecular data (n = 943). (C) Spectrum of CH at baseline for individuals lacking follow-up. The mutational spectrum for panels A-C was classified as follows: absence of CH, multiple mutated genes, or the presence of a single mutated gene, as indicated. (D) Relation between VAFs at baseline (horizontal axis) and follow-up (vertical axis) for all mutations detected at baseline and/or follow-up visit (n = 715). The gray diagonal line indicates stable VAF. (E) Volcano plot for growth rates of recurrently mutated genes (≥5×). The x-axis displays the mean absolute difference in VAF over time. The y-axis shows the -log10 (P value) indicating the significance of the change in VAF over time (from paired Wilcoxon signed-rank test). The size of each circle corresponds to the overall frequency of the mutation (N) in serial molecular data for 943 individuals, as indicated. The gray horizontal line corresponds to a P value of .05.
In total, 715 mutations were detected in 464 individuals at 1 or both time points. For a more precise assessment of expansion rate, we again performed variant calling on the raw sequencing reads below the threshold of 1% for all mutations for which we found a variant allele at only 1 time point. We were able to track the majority of new or disappearing mutations below variant calling thresholds. The VAF inferred from the raw sequencing reads at the respective position was used to calculate expansion rates (Figure 5D; supplemental Table 11). Overall, DNMT3A mutations did not show any positive selection over time, with a mean increase in VAF of 0.09% (P = .13) during the follow-up period. A significant, although small, increase in VAF of, respectively, 0.85% (P < .001), 0.82% (P = .005), and 1.1% (P = .006) was seen for TET2, ASXL1, and TP53 mutations. JAK2 V617F mutations displayed the highest expansion over time with a mean increase of 5.4% (Figure 5E; supplemental Figures 28-29). The maximum increase in VAF was higher for individuals with multiple mutated genes at baseline (Figure 6A; P < .001). In line with these findings, the propensity to acquire an additional mutation was higher for TET2 (relative risk [RR], 1.54; 95% CI, 0.88-2.69) and ASXL1 (RR, 2.27; 95% CI, 1.06-4.85) compared with DNMT3A (RR, 0.48; 95% CI, 0.28-0.83; Figure 6B).
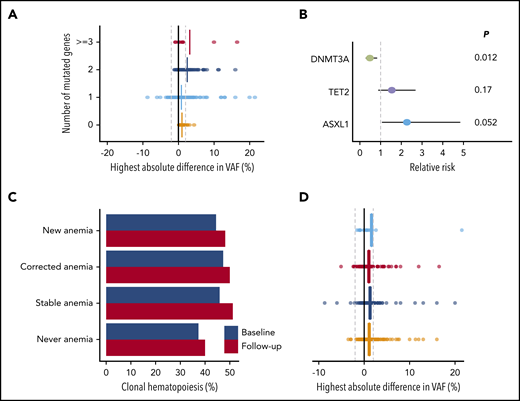
Clonal dynamics (II). (A) Change in VAFs according to the number of mutated genes at baseline (n = 464). The highest absolute difference in VAF is indicated for each individual. Vertical lines indicate means for each subgroup. (B) Forest plot for the risk of acquiring an additional mutation over time for individuals carrying CH, according to the presence of mutations in DNMT3A (n = 254), TET2 (n = 119), or ASXL1 (n = 25). Circles indicate the relative risk for each gene as compared with other mutational spectra at baseline. Horizontal lines indicate 95% CIs. P values are from Fisher’s exact test. (C) Prevalence of CH at baseline (blue) and follow-up (red) according to anemia status at baseline and follow-up (n = 943). (D) Change in VAFs according to anemia status at baseline and follow-up (n = 943). The highest absolute difference in VAF is indicated for each individual. Vertical lines indicate mean differences for each subgroup. For panels C and D, individuals were grouped as never having anemia (n = 485), newly developing anemia (n = 27), having stable anemia over time (n = 207), or having anemia at baseline that is corrected at follow-up (n = 224).
Clonal dynamics (II). (A) Change in VAFs according to the number of mutated genes at baseline (n = 464). The highest absolute difference in VAF is indicated for each individual. Vertical lines indicate means for each subgroup. (B) Forest plot for the risk of acquiring an additional mutation over time for individuals carrying CH, according to the presence of mutations in DNMT3A (n = 254), TET2 (n = 119), or ASXL1 (n = 25). Circles indicate the relative risk for each gene as compared with other mutational spectra at baseline. Horizontal lines indicate 95% CIs. P values are from Fisher’s exact test. (C) Prevalence of CH at baseline (blue) and follow-up (red) according to anemia status at baseline and follow-up (n = 943). (D) Change in VAFs according to anemia status at baseline and follow-up (n = 943). The highest absolute difference in VAF is indicated for each individual. Vertical lines indicate mean differences for each subgroup. For panels C and D, individuals were grouped as never having anemia (n = 485), newly developing anemia (n = 27), having stable anemia over time (n = 207), or having anemia at baseline that is corrected at follow-up (n = 224).
We next questioned whether anemia was associated with the growth behavior of CH over time. Overall, the proportion of individuals with CH increased by 3.3% (P = .004), which was independent of development or correction of anemia (Figure 6C). Furthermore, the correction or development of anemia was not associated with changes in VAF over time (P = .55; Figure 6D; supplemental Figure 30).
Discussion
Using deep and error-corrected NGS, we delineated the mutational spectrum and clonal dynamics in a large cohort of older individuals with and without anemia derived from a prospective population-based cohort. Although some studies have reported a remarkably higher prevalence of anemia in older individuals,12-14 the prevalence of anemia in our cohort is comparable with the prevalence of anemia in population-based studies from Sweden and Germany.15,16 Several factors could be potential explanations for this relatively low prevalence, including distinctive epidemiological features of geographical areas, accessibility of the general healthcare system (especially for older individuals), and selection procedures in the Lifelines cohort, although it should be noted that the Lifelines cohort has been shown to be largely representative of the general population in the Northern Netherlands.17
In line with previous reports,18 CH in a small fraction of hematopoietic cells was surprisingly common, representing an almost ubiquitous aging phenomenon. Whereas major population-based studies mostly assessed the clinical significance of CH using low-coverage whole-exome sequencing1-3,19 or targeted sequencing with a higher VAF cutoff,20 we were able to assess the effect on survival of mutations at lower VAF at a large scale. Whereas smaller clones (<5% VAF) did not affect OS in our cohort, CH at higher VAF or with multiple mutated genes was associated with inferior OS. As previous studies have particularly observed a higher risk for cardiovascular disease,4 AML development,5,6 and general mortality1,2,19 for individuals with a higher clone size, it may well be that CH is predominantly associated with disease once achieving significant expansion in peripheral blood.
Our results show that anemia of older individuals is associated with a higher prevalence of CH, mostly sustained by an enrichment in specific mutational patterns. Although DNMT3A, TET2, and ASXL1 constitute the vast majority of genes in age-related CH,1-3,20-22 the mutational spectrum restricted to these genes was very similar for anemic and control individuals. This suggests that age-related emergence of clonal somatic mutations in DNMT3A, TET2, and ASXL1 and anemia represent independent age-related processes. Conversely, comutation patterns involving DTA in combination with other genes were enriched in the anemia cohort, possibly reflecting progression in the evolutionary trajectory of age-related CH.9 Whereas single-mutant clones might be effective in generating hematopoietic offspring, sequential acquisition of mutations may disrupt normal hematopoiesis and eventually contribute to a hematological phenotype. Accordingly, mutation gain during follow-up was independently associated with worse outcome.
SF3B1 and TP53 mutated clones were enriched in the anemic cohort. Distinct properties of these genes may contribute to this association. Given the relationship among SF3B1 mutations, erythroid dysplasia, and anemia in myelodysplastic syndromes,23,24 SF3B1 mutations in older individuals with anemia may be linked to biological processes contributing to ineffective erythropoiesis and disturbed iron homeostasis. Others have suggested that spliceosome mutations, including SF3B1, may confer a competitive advantage in the context of aging.21 Hematopoietic stem and progenitor cells harboring TP53 mutations preferentially expand after selective exposure to genotoxic therapy.25 Likewise, TP53 clones in the context of anemia may have gained clonal dominance as a result of extrinsic (micro)environmental stressors, such as inflammation.
The prospective nature of our cohort enabled us to study the dynamics of CH in a large number of community-dwelling individuals. After a median follow-up period of 44 months, most single mutant hematopoietic clones showed remarkably limited expansion over time. Remarkably, DNMT3A mutations were the most prevalent, but paradoxically showed the least expansion rate. Extrinsic processes such as immune recognition, limiting factors in the bone marrow microenvironment, and possibly clonal competition for niche space may hamper continuous clonal expansion, eventually resulting in homeostasis and clonal stability over time. Alternatively, intrinsic mechanisms like the size of the stem or progenitor cell compartment in which the mutation arises and its potential to produce offspring may affect clone size. In line with a multiple hit model of mutational acquisition in leukemogenesis,26,27 and with a Darwinian selection model, expansion rates of hematopoietic clones increased with the number of mutated genes. Our data show that specific driver mutations have different progression potential, as reflected by different clonal expansion rates and propensity to acquire additional hits. This indicates that, in the context of age-related CH, the composition of the clone determines its evolutionary trajectory.
Although anemia is quite frequently diagnosed in older individuals, the management of anemia in older individuals is a clinical challenge, especially when the etiology remains uncertain.8,10 The additional value of somatic mutation screening in these older individuals with unexplained anemia is unclear.10 Mutational analysis, performed in individuals with unexplained cytopenia seeking medical advice (ie, different from our study cohort), identified mutational patterns that were predictive for subsequent diagnosis of a myeloid neoplasm. These patterns included spliceosome gene mutations and comutation patterns involving DTA and other genes. In contrast, single DTA mutations had limited predictive value in that study.9 In line with these results, our data also show that single DTA mutations are not correlated with the presence of anemia in general, and unexplained anemia in particular. Indeed, CH in general explains only a small fraction of the unexplained anemia of the elderly in the general population. Moreover, by including a matched control group, our data clearly reveal that detection of specific somatic mutations in the context of (unexplained) anemia may also be incidental and does not necessarily point toward a diagnosis of neoplastic hematological disease (eg, myelodysplastic syndromes). The serial analyses of our cohort provide insight in the natural course of hematopoietic clones, which appeared to be remarkably stable in time. Mutational screening in the elderly, even in the context of anemia, therefore, should be interpreted with caution, especially at lower VAFs. Nevertheless, specific mutational signatures (including SF3B1, TP53, and DTA mutations combined with other mutations), multiple mutated genes and larger clones warrant clinical attention. Evidently, additional studies are needed to assess the clinical importance of monitoring these individuals over time.
In summary, our study represents a sensitive and population-based assessment of dynamics of CH in the context of anemia as a hematopoietic aging phenotype.
The manuscript is based on data from the Lifelines Cohort Study. Lifelines adheres to standards for data availability. The data catalog of Lifelines is publicly accessible at www.lifelines.nl. All international researchers can obtain data at the Lifelines research office (research@lifelines.nl), for which a fee is required.
The online version of this article contains a data supplement.
The publication costs of this article were defrayed in part by page charge payment. Therefore, and solely to indicate this fact, this article is hereby marked “advertisement” in accordance with 18 USC section 1734.
Acknowledgments
The authors thank the all participants of the Lifelines cohort study and everybody contributing to the study set-up and design. The authors also thank all local investigators and operational team members of the MDS-RIGHT project for their contribution. Furthermore, they thank the Genome Technology Center, Radboud University Medical Center, for performing NovaSeq and NextSeq sequencing.
This work is part of the MDS-RIGHT project, which has received funding from the European Union’s Horizon 2020 research and innovation program under grant agreement 634789 (“Providing the right care to the right patient with MyeloDysplastic Syndrome at the right time”). The funder of this study had no role in study design, collection, analysis, and interpretation of data, and writing or approval of the manuscript. The Lifelines Biobank initiative has been made possible by subsidy from the Dutch Ministry of Health, Welfare and Sport; the Dutch Ministry of Economic Affairs; the University Medical Center Groningen; University Groningen; and the Northern Provinces of The Netherlands.
Authorship
Contribution: I.A.v.Z., A.O.d.G., and H.J.C.M.W. contributed to collection, analysis, and interpretation of the data; I.A.v.Z., A.O.d.G., J.H.J., and G.H. wrote the first version of the manuscript; B.A.v.d.R., M.M.v.d.K., and L.M. were involved in study design and interpretation of the data; T.d.W. was involved in study design; M.A.J. was involved in data analysis and interpretation; and J.H.J. and G.H. were principal investigators and were involved in all aspects of the study, including design, collection, and interpretation of data.
Conflict-of-interest disclosure: The authors declare no competing financial interests.
Correspondence: Gerwin Huls, Department of Hematology, University Medical Center Groningen, University of Groningen, PO Box 30 001, 9700 RB Groningen, The Netherlands, e-mail: g.huls@umcg.nl.

This feature is available to Subscribers Only
Sign In or Create an Account Close Modal