

Key Points
A gene expression classifier separates 2 distinct patient segments in DLBCL that differ in immune cell composition.
The classifier predicts for clinical benefit to avadomide in R/R DLBCL and is not prognostic for progression on immunochemotherapy.

Abstract
Diffuse large B-cell lymphoma (DLBCL) is a heterogeneous disease, commonly described by cell-of-origin (COO) molecular subtypes. We sought to identify novel patient subgroups through an unsupervised analysis of a large public dataset of gene expression profiles from newly diagnosed de novo DLBCL patients, yielding 2 biologically distinct subgroups characterized by differences in the tumor microenvironment. Pathway analysis and immune deconvolution algorithms identified higher B-cell content and a strong proliferative signal in subgroup A and enriched T-cell, macrophage, and immune/inflammatory signals in subgroup B, reflecting similar biology to published DLBCL stratification research. A gene expression classifier, featuring 26 gene expression scores, was derived from the public dataset to discriminate subgroup A (classifier-negative, immune-low) and subgroup B (classifier-positive, immune-high) patients. Subsequent application to an independent series of diagnostic biopsies replicated the subgroups, with immune cell composition confirmed via immunohistochemistry. Avadomide, a CRL4CRBN E3 ubiquitin ligase modulator, demonstrated clinical activity in relapsed/refractory DLBCL patients, independent of COO subtypes. Given the immunomodulatory activity of avadomide and the need for a patient-selection strategy, we applied the gene expression classifier to pretreatment biopsies from relapsed/refractory DLBCL patients receiving avadomide (NCT01421524). Classifier-positive patients exhibited an enrichment in response rate and progression-free survival of 44% and 6.2 months vs 19% and 1.6 months for classifier-negative patients (hazard ratio, 0.49; 95% confidence interval, 0.280-0.86; P = .0096). The classifier was not prognostic for rituximab, cyclophosphamide, doxorubicin, vincristine, prednisone or salvage immunochemotherapy. The classifier described here discriminates DLBCL tumors based on tumor and nontumor composition and has potential utility to enrich for clinical response to immunomodulatory agents, including avadomide.
Introduction
Diffuse large B-cell lymphoma (DLBCL) is a clinically and genetically heterogeneous disease.1-3 DLBCL is commonly described as having 2 molecular subtypes, defined by gene expression profiling: activated B-cell (ABC) DLBCL and germinal center B-cell (GCB) DLBCL, which display characteristics similar to their normal cell counterparts.1,4 Cell-of-origin (COO) classification is based on B-cell phenotype: where ABC and GCB DLBCL subtypes have different pathogenic mechanisms and different clinical outcomes.3,5 Recent studies have adopted more comprehensive strategies by integrating genomic and transcriptomic data, such as mutations, copy number alterations, epigenetic features, and structural variants, to further refine molecular subtypes in DLBCL.2,6 The COO classification has been shown to be prognostic with respect to immunochemotherapy regimens, with worse outcomes for ABC DLBCL patients.1,7,8 Some drugs have shown improved prognosis for patients with ABC DLBCL, including lenalidomide8,9 and agents targeting B-cell receptor signaling pathways, such as BTK inhibitors10 and proteasome inhibitors.11 Several gene expression–based assays have been developed to distinguish patients based on COO classification.12,13
Avadomide (CC-122) is a small molecule cereblon modulator that recruits Aiolos and Ikaros, lymphoid-specific transcription factors involved in B- and T-cell biology, to the cereblon cullin4 E3 ligase complex, resulting in their ubiquitination and subsequent proteasomal degradation. Degradation of Aiolos and Ikaros results in apoptosis of malignant DLBCL cells and activation of T cells in vitro.14,15 Preclinical studies have demonstrated that avadomide is active in ABC and GCB DLBCL cell lines, suggesting that its activity is independent of COO.15,16 Indeed, in patients with relapsed and/or refractory (R/R) DLBCL, administration of avadomide monotherapy results in potent immune modulation and clinical activity in ABC and GCB subtypes.16,17
The use of biomarkers for patient selection in registrational trials requires prospective analysis. Although the low number of patients frequently enrolled in early-phase trials impedes robust predictive biomarker discovery, it remains possible to apply an existing patient-segmentation strategy with biology that is aligned with the known mechanisms of action of a novel compound that is being tested in the clinic. Multiple assays exist to determine COO in DLBCL, capturing the cellular phenotype of tumor cells. Previous efforts in DLBCL patient stratification have described prognostic signatures or biomarkers to predict response to rituximab, cyclophosphamide, doxorubicin, vincristine, prednisone (R-CHOP) immunochemotherapy7,18 or for identifying novel biological phenotypes, including stromal signatures, immune infiltration, and metabolic and B-cell receptor signaling pathways.7,19 These important studies have provided a foundation for the biology of DLBCL, describing tumor and nontumor components, which underpins the work described herein. Although these prior studies describe multiple characteristics associated with the DLBCL tumor microenvironment, none describe a clinically applicable cross-platform classifier and its application to enrich for patient response in a contemporaneous early-phase clinical trial. The dearth of multivariate gene expression classifiers used in the clinic reflects the complex technical difficulties that need to be addressed to ensure stability and persistence of such classifiers. The work described here reflects a model through which it is possible to leverage public data to identify robust and biologically meaningful patient subpopulations, align their biology with known action of a novel drug to generate a patient-selection hypothesis, and contemporaneously develop a classifier on a diagnostic platform to predict phenotypes of interest and accelerate clinical development in early-phase clinical trials. Through this approach, a tumor subgroup was identified with high immune cell infiltration that was hypothesized to be susceptible to the robust immunomodulatory activity that forms part of avadomide’s dual mechanism of action.
A platform-independent gene expression classifier for this subgroup was constructed exclusively from a public dataset of newly diagnosed DLBCL patient gene expression profiles and demonstrated replicability of prevalence, pathways, and immune cell–type enrichment in an independent cohort of diagnostic DLBCL biopsies. When applied retrospectively to gene expression profiles from formaldehyde-fixed paraffin-embedded (FFPE) samples collected in a phase 1 trial of avadomide monotherapy in R/R DLBCL (CC-122-ST-001, NCT01421524), described in a companion article by Carpio et al,16 the classifier demonstrated the ability to identify a subgroup of patients with improved response rates and prolonged progression-free survival (PFS).
Materials and methods
DLBCL samples
Diagnostic FFPE biopsy samples collected from newly diagnosed DLBCL patients (including high-grade B-cell lymphoma) were commercially sourced (Avaden Biosciences, Seattle, WA). DLBCL tumor biopsies collected from R/R patients, excluding transformed patients, enrolled in the University of Iowa/Mayo Clinic Lymphoma Molecular Epidemiology Resource database were provided for analysis.20 Pretreatment (diagnostic, archival, or screening) biopsies collected from patients enrolled in clinical trial CC-122-ST-001 (NCT01421524)16 were analyzed retrospectively.
Public gene expression data for phenotype discovery
Gene expression data (Affymetrix) from diagnostic biopsies of 414 patients with newly diagnosed DLBCL were downloaded from the Gene Expression Omnibus (GSE10846).7 Dataset dimensionality was reduced from ∼20 000 genes to 2 phenotypic components using an unsupervised in silico deconvolution method, based on nonnegative least-squares constraints, which was designed for analysis of heterogeneous tissue samples.21 Unsupervised hierarchical clustering (Ward algorithm, as implemented in hclust function using R statistical software, v.3.0.0) was applied to subset the original patient cohort according to the relative proportion of each phenotype.
Feature selection and creation of a clinically applicable classifier
Predictability of transcriptional subgroups in the GSE10846 dataset was assessed via training and testing a recursive feature elimination (RFE) support vector machine (SVM) with linear kernel function across 10 repetitions of nested fivefold cross-validation, using the inner loop for parameter optimization and the outer loop for estimation of predictive performance. Predictive performance was assessed using Matthews correlation coefficient, sensitivity, specificity, positive predictive value, and negative-predictive value. Matthews correlation coefficient was used for parameter optimization. The RFE-SVM was implemented via functionality of the pathClass R library.22
A minimal gene subset for future classifications was obtained via application of an RFE-SVM with linear kernel function to classify transcriptional subgroups in the GSE10846 dataset. Algorithmic-free parameters, tolerance to noise, and RFE-stopping criterion were optimized via estimation of predictive accuracy across a class-stratified fivefold cross-validation. Matthews correlation coefficient was used for parameter optimization.
The gene subset obtained via application of an RFE-SVM to the GSE10846 dataset was used to define expression patterns (templates) for the nearest template prediction (NTP) method.23 To build a classifier applicable beyond the Affymetrix gene expression platform used for feature selection and predictability analysis, a linear discriminant analysis decision boundary was derived via application to an NTP template distance transformation of the Affymetrix training dataset and applied subsequently to classify custom NanoString gene expression profiles (see supplemental Materials and methods for full details, available on the Blood Web site).
Classification of DLBCL samples by COO
COO classification was assigned to Affymetrix gene expression profiles in the GSE10846 dataset using the method of Wright and colleagues.7,12 The NanoString-based lymphoma subtyping test was used to assign COO classification to FFPE samples in an independent series of commercially sourced DLBCL tumor biopsies, as previously described.13
Statistical analysis
Principal component analysis (PCA) and heat maps were produced using R statistical software. PFS was analyzed by the Kaplan-Meier method. Demographics were summarized descriptively. Comparison between groups was carried out using an independent Student t test and the Mann-Whitney nonparametric test. Univariate analysis was performed using Cox proportional hazards regression. Differences in immune cell densities were evaluated using the unpaired Student t test.
This study was conducted in accordance with the Declaration of Helsinki and was approved by multiple review boards. See supplemental Materials and methods for the full list of review boards, plus additional information.
Results
Identification and characterization of DLBCL patient subgroups
A publicly available set of gene expression profiles of diagnostic fresh-frozen tumor biopsies from 414 patients with newly diagnosed DLBCL (GSE10846), the demographics of which are shown in Table 1, was analyzed for this study.7 Nonnegative matrix factorization was used to decompose the gene expression data from Lenz et al7 into 2 components used subsequently for an unsupervised analysis that identified 2 major tumor subgroups (subgroup A, n = 152; subgroup B, n = 262). PCA confirmed orthogonality between COO and the 2 new subgroups (Figure 1A), suggesting that these classifications are based on different aspects of tumor biology than those described by COO. The heat map in Figure 1A (left panel) shows the expression of genes identified by supervised analysis to be associated with subgroups A and B. The distributions of ABC, GCB, and unclassified DLBCL subtypes were similar among subgroup A and subgroup B tumors (Figure 1A, right panel). Samples from the GSE108467 dataset included 262 (63%) from subgroup A (48% ABC DLBCL, 43% GCB DLBCL, and 9% unclassified) and 152 (37%) from subgroup B (28% ABC, 46% GCB, and 26% unclassified) (supplemental Figure 1A). Although there may be other numbers of components or cluster sizes that explain higher proportions of the variance in the data or describe individual aspects of disease biology at a higher level of resolution, our component size of 2 and cluster size of 2 provide the most reproducible segments based on our evaluation (supplemental Figures 2 and 3).
Demographics of patients in public dataset (GSE10846)
| Subgroup A (n = 262) | Subgroup B (n = 152) | P | |
|---|---|---|---|
| Age, y | |||
| ≤60 | 119 (45) | 69 (45) | 1 |
| >60 | 143 (55) | 83 (55) | |
| Sex | |||
| Female | 108 (41) | 64 (42) | .834 |
| Male | 143 (55) | 81 (53) | |
| NA | 11 (4) | 7 (5) | |
| IPI | |||
| ≤2 | 204 (78) | 124 (82) | .383 |
| >2 | 58 (22) | 28 (18) | |
| Risk | |||
| High risk | 58 (22) | 28 (18) | .517 |
| Low risk | 161 (62) | 95 (63) | |
| NA | 43 (16) | 29 (19) | |
| No. of extranodal sites | |||
| ≤1 | 166 (63) | 100 (66) | 1 |
| >1 | 19 (7) | 11 (7) | |
| NA | 77 (30) | 41 (27) | |
| Stage | |||
| >2 | 262 (100) | 152 (100) | NA |
| ECOG PS | |||
| ≤2 | 226 (86) | 130 (85) | .345 |
| >2 | 24 (9) | 9 (6) | |
| NA | 12 (5) | 13 (9) | |
| COO: ABC vs GCB | |||
| ABC | 125 (48) | 42 (28) | .011 |
| GCB | 113 (43) | 70 (46) | |
| Unclassified | 24 (9) | 40 (26) | |
| COO: GCB vs non-GCB | |||
| GCB | 113 (43) | 70 (46) | .608 |
| non-GCB | 149 (57) | 82 (54) | |
| LDH | |||
| ≤1 | 102 (39) | 71 (47) | .045 |
| >1 | 124 (47) | 54 (35) | |
| NA | 36 (14) | 27 (18) |
All data are n (%).
ECOG PS, Eastern Cooperative Oncology Group performance status; IPI, International Prognostic Index; LDH, lactic acid dehydrogenase; NA, not available.

Identification of 2 subgroups with different immune infiltration patterns in a public dataset from newly diagnosed DLBCL patients. (A) Gene expression profiles (Affymetrix) of screening biopsies from 414 DLBCL patients downloaded from the Gene Expression Omnibus (GSE10846)7 were transformed by nonnegative matrix factorization, followed by unsupervised clustering, revealing 2 subgroups. The heat map (left panel) shows expression of top discriminating genes (n = 260) between the 2 subgroups that are independent of COO classification. The bands at the top show COO classification in comparison with new groups identified. PCA shows orthogonality between the 2 subgroups and COO classification (right panel). Principal component 1 segregates the 2 new subgroups identified, whereas principal component 2 shows segregation between ABC and GCB COO. Boxplots at the top and on the right show sample distribution by each of the 2 new subgroups identified and by COO for principal component 1 and principal component 2. (B) Results of GSEA pathway analysis presented using EnrichmentMap23 to display the most significant biological processes (adj. P < .001) in subgroup A (left panel) and subgroup B (right panel). (C) Deconvolution plot of inferred immune cell populations shown as log2-fold change in subgroup B relative to subgroup A. (D) Subgroup inclusion does not correlate with PFS in frontline DLBCL patients treated with R-CHOP from the GSE10846 dataset.
Identification of 2 subgroups with different immune infiltration patterns in a public dataset from newly diagnosed DLBCL patients. (A) Gene expression profiles (Affymetrix) of screening biopsies from 414 DLBCL patients downloaded from the Gene Expression Omnibus (GSE10846)7 were transformed by nonnegative matrix factorization, followed by unsupervised clustering, revealing 2 subgroups. The heat map (left panel) shows expression of top discriminating genes (n = 260) between the 2 subgroups that are independent of COO classification. The bands at the top show COO classification in comparison with new groups identified. PCA shows orthogonality between the 2 subgroups and COO classification (right panel). Principal component 1 segregates the 2 new subgroups identified, whereas principal component 2 shows segregation between ABC and GCB COO. Boxplots at the top and on the right show sample distribution by each of the 2 new subgroups identified and by COO for principal component 1 and principal component 2. (B) Results of GSEA pathway analysis presented using EnrichmentMap23 to display the most significant biological processes (adj. P < .001) in subgroup A (left panel) and subgroup B (right panel). (C) Deconvolution plot of inferred immune cell populations shown as log2-fold change in subgroup B relative to subgroup A. (D) Subgroup inclusion does not correlate with PFS in frontline DLBCL patients treated with R-CHOP from the GSE10846 dataset.
To characterize the underlying biology represented by the 2 subgroups, gene set enrichment analysis (GSEA), using gene ontology biological processes and canonical pathways from the Molecular Signatures Database, was applied to GSE10846 gene expression profiles. A visual representation of the most significantly differentially expressed biological processes (adj. P < .001), created using EnrichmentMap,24 is presented in Figure 1B. Subgroup A profiles were associated with pathways involved in DNA replication and repair, cell cycle and mitosis, and RNA processing, generally indicative of a proliferative signal expected to be from malignant B cells in DLBCL. Subgroup B profiles were enriched in immune and inflammatory response pathways, consistent with an immune cell infiltration. The number of genes deemed significantly differentially expressed was high, as expected, given that these subgroups were identified using gene expression profiles. Among the genes more highly expressed in subgroup A are CDK1, phosphoprotein phosphatase activity proteins (CDC25A, CDC25C, CDKN3), minichromosome maintenance complex (MCM2, MCM3, MCM4), and replication factor C subunits (RFC2, RFC3, RFC4). DNA repair, including Fanconi anemia complementation group (FANCA, FANCD2, FANCI), mismatch repair system (PMS2P1, PMS2P5), and DNA-repair proteins (RAD18, RAD51), were also identified as being more highly expressed in subgroup A. Among the top differentially expressed genes in subgroup B are genes annotated to extracellular matrix. This observation was previously made by Lenz et al7 in association with stromal signatures. One of those genes is SPARC, which was reported to be localized in infiltrated histiocytic cells.7 Additionally, numerous collagen proteins (COL11A1, COL14A1, COL18A1, COL1A1, COL1A2, COL3A1, COL4A1, COL4A2, COL5A1, COL5A2, COL6A2, COL6A3, COL8A2) and cytokine-mediated signaling and inflammatory response, represented by interferon-γ IFNG, C-C chemokines (CCL18, CCL19, CCL4, CCL5, CCL8, CCR1, CCR5), C-X-C chemokines (CXCL11, CXCL12, CXCL13, CXCL2, CXCL9), and interleukins and interleukin receptors (IL13RA1, IL15, IL1R1, IL1R2, IL2RB, IL32, IL6R, IL7R), were more highly expressed in subgroup B. A complete list of significant processes, pathways, and differential gene expression identified in this analysis can be found in supplemental Tables 1 through 5. Application of 4 computational deconvolution methods to the gene expression data was used to understand the cellular composition in tumors in each of the 2 subgroups. Figure 1C presents the intratumoral immune cell distributions that were significantly associated with subgroup B vs subgroup A, estimated by the LM22 method.25 Subgroup A was characterized by a predominance of B cells in the tumor, supporting the strong proliferative signal detected by GSEA, whereas subgroup B was associated with an abundance of macrophages, various T-cell subsets, and natural killer (NK) cells. These results were consistent across 4 distinct deconvolution algorithms, each with its own set of defined markers applied independently to the data (Figure 1C; supplemental Figure 4; supplemental Materials and methods). Association between the 2 subgroups and clinical outcome of those patients who received treatment with R-CHOP immunochemotherapy (n = 220) was tested in the GSE10846 dataset. No association between clinical outcome and subgroup status was found, indicating that the subgroups are not prognostic to R-CHOP therapy in the setting of newly diagnosed DLBCL (P = .716) (Figure 1D).
Development of gene expression classifier
A gene expression classifier was created to reproducibly distinguish the 2 subgroups in independent DLBCL datasets. The objective was to build a strong predictor of subgroup membership from genome-wide Affymetrix gene expression data that was also able to function when transferred to a different gene expression technology for use in clinical settings. Creation of the classifier was performed in 2 stages, gene selection and classifier creation, as shown in Figure 2A. The first stage was to identify a minimal gene subset as a surrogate for subgroup identity and prediction in future patient populations. To this end, a supervised machine learning approach was applied to the same 414 genome-wide expression profiles in the GSE10846 dataset and used to identify a minimal gene set that enabled robust prediction of subgroup membership (subgroup A [n = 262] and subgroup B [n = 152]) (supplemental Figure 5; supplemental Materials and methods). The base classification algorithm, a linear support vector machine with recursive feature elimination, was trained and assessed by iterative class-stratified cross-validation, in which 20% of profiles were withheld from training to estimate generalization performance on unseen data. Algorithmic-free parameters and stopping point for optimal feature subset were selected via predictive accuracy estimated on an additional cross-validation performed within each training fold (supplemental Materials and methods). Estimated future performance evaluated across the withheld validation folds of 10 independent cross-validation runs was high: Matthews correlation coefficient, 0.84; positive predictive value, 0.91; negative predictive value, 0.94; sensitivity, 0.89; and specificity, 0.95. Having ascertained that a linear decision threshold, applied to a function of a small subset of gene expression scores, was able to distinguish the 2 DLBCL subgroups, the procedure was run for a final time on all 414 GSE10846 profiles to fix the minimal gene set that was subsequently used to develop a clinically applicable assay for identification and membership prediction of subgroups A and B in future DLBCL patient cohorts. The final subset of 26 genes contained 4 genes that were downregulated and 22 genes that were upregulated in classifier-positive vs classifier-negative tumors (Figure 2B; supplemental Table 6).
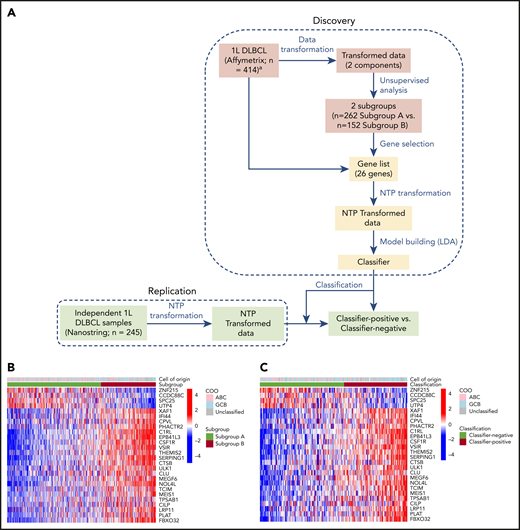
Classifier discovery. (A) Schematic diagram showing the strategy used to develop classifier on a public dataset (GSE10846) from newly diagnosed DLBCL patients (Discovery) and to classify new DLBCL specimens from an independent set of commercially sourced diagnostic/archival biopsies from frontline patients (Replication). Gene selection-steps are shown in pink, and classifier creation steps are shown in yellow. Heat maps showing the results of clustering of samples (Affymetrix) in the public dataset (n = 414) based on subgroup (B) and independent commercially sourced samples (NanoString) (n = 245) based on the classifier (C). Segregation according to the subgroup/classifier is shown in the lower bar above the heat map, whereas lack of segregation by COO is shown in the upper bar.
Classifier discovery. (A) Schematic diagram showing the strategy used to develop classifier on a public dataset (GSE10846) from newly diagnosed DLBCL patients (Discovery) and to classify new DLBCL specimens from an independent set of commercially sourced diagnostic/archival biopsies from frontline patients (Replication). Gene selection-steps are shown in pink, and classifier creation steps are shown in yellow. Heat maps showing the results of clustering of samples (Affymetrix) in the public dataset (n = 414) based on subgroup (B) and independent commercially sourced samples (NanoString) (n = 245) based on the classifier (C). Segregation according to the subgroup/classifier is shown in the lower bar above the heat map, whereas lack of segregation by COO is shown in the upper bar.
The 26 genes identified above were included in the design of a NanoString Custom CodeSet panel to enable measurement of their expression levels in future clinical settings. Measurement of gene expression via technologies suited to focused clinical application, such as NanoString13 or next-generation sequencing, can render decision thresholds derived from genome-wide gene expression microarrays inapplicable to new patient profiles without extensive normalization and standardization.23 Distinct transcriptional referencing mechanisms and associated signal dynamics may alter the shape of the DLBCL patient profile distribution in the multivariate space wherein the original decision threshold resides, despite measurement of the same genes.26 To overcome this challenge, the NTP23 framework was adapted to create a classifier and associated decision threshold that could be transferred from the exploratory genome-wide platform on which it was trained, for future application to patient profiles assayed on distinct technology platforms. The gene expression profiles from GSE10846 were standardized (supplemental Methods and materials > Analysis of public gene expression data). The NTP cosine transform was applied to these standardized profiles using binary templates of differential expression between subgroups A and B across the 26 gene subset, and linear discriminant analysis27,28 was applied in this new space to create a simple linear decision boundary between the 2 subgroups (supplemental Figure 5). This same decision boundary was applied to classify any new patient profile, following standardization, and is referred to hereafter as a “classifier.” Now in the presence of a classifier and the 2 subgroups on which it is based, subgroup A and subgroup B refer to the 2 patient classes derived from the discovery dataset by unsupervised exploration. The terms classifier-positive and classifier-negative refer to classes assigned to patients in validation datasets by applying the classifier trained to distinguish subgroups A and B in the discovery dataset. Classifier-positive denotes prediction of patients into subgroup B, whereas classifier-negative denotes prediction of patients into subgroup A.
Validation of the assay/classifier
Application of the gene expression classifier to NanoString profiles generated from an independent set of commercially sourced FFPE tumor biopsies from newly diagnosed DLBCL patients yielded similar subgroup prevalence and directional expression of the 26 classifier genes (Figure 2C). The prevalence of classifier-positive samples in frontline DLBCL was 37% in the public gene expression “training” set and 43% in the NanoString “replication” set of commercially sourced FFPE tumor biopsies. Among the independent set of commercial DLBCL samples, the 140 (57%) classifier-negative samples included 52% GCB vs 48% non-GCB, and the 105 (43%) classifier-positive samples included 54% GCB vs 46% non-GCB (supplemental Figure 1B). These results demonstrate classifier applicability to data derived from 2 assay platforms (genome-wide Affymetrix and custom NanoString panel, Figure 2B and C, respectively) and the persistence of subgroups A and B, as predicted in frontline DLBCL patient biopsies.
Multiplex immunofluorescence was used to validate hypotheses regarding the biology that drives subgroup A and B phenotypes based on the deconvolution analysis and confirm classifier ability to separate tumors with distinct cellular content. Immunohistochemistry staining for markers of B cells, T cells, NK cells, macrophages, and dendritic cells was performed on a subset of the replication DLBCL tumor series (n = 105) to explore immune cell composition differences between classifier-positive and classifier-negative DLBCL. Figure 3A shows representative fields from classifier-negative (predicted subgroup A) and classifier-positive (predicted subgroup B) biopsies, illustrating characteristic differences in the tumor microenvironment. Classifier-positive tumors showed relatively higher densities of T cells, macrophages, and dendritic cells compared with classifier-negative tumors (Figure 3A). Quantitative assessments of the cellular composition in the 2 sample groups (Figure 3B) also revealed significantly higher densities of CD3+ T cells (median, 3921 vs 2172 cells per mm2; P < .0001), CD8+ T cells (median, 1065 vs 631 cells per mm2; P = .0001), CD11c+ dendritic cells (median, 3331 vs 1729 cells per mm2; P < .0001), CD3+FOXP3+ T regulatory cells (median, 85 vs 55 cells per mm2; P = .0133; data not shown), and a trend toward higher numbers of CD163+ macrophages (median, 733 vs 358 cells per mm2; P = .1216) in classifier-positive tumor specimens.

Immunofluorescence analysis of tissue specimens from DLBCL patients. (A) Representative fields (median) from images of classifier-negative and classifier-positive specimens stained for CD3+ and CD8+ T cells, CD20+ B cells, CD163+ macrophages, and CD11c+ dendritic cells (magnification, ×20). (B) Quantitative analysis of immune cell populations is shown as cell density (cells per mm2).
Immunofluorescence analysis of tissue specimens from DLBCL patients. (A) Representative fields (median) from images of classifier-negative and classifier-positive specimens stained for CD3+ and CD8+ T cells, CD20+ B cells, CD163+ macrophages, and CD11c+ dendritic cells (magnification, ×20). (B) Quantitative analysis of immune cell populations is shown as cell density (cells per mm2).
Expression of checkpoint molecules PD-1 and PD-L1 have been associated with T-cell dysfunction and may be associated with prognosis in B-cell lymphoma.29,30 Approximately half of all dendritic cells were positive for PD-L1 expression, with higher densities of CD11c+PD-L1+ dendritic cells in classifier-positive vs classifier-negative tumor biopsies (median, 2415 vs 634 cells per square millimeter; P < .0001; supplemental Figure 6). No apparent differences existed in CD163+PD-L1+ macrophages in the 2 groups. In contrast, a significantly higher density of CD20+ B cells, presumed to be malignant B cells (median, 5478 vs 3985 cells per mm2; P = .0032), was observed in classifier-negative specimens (data not shown). There were no significant differences in CD3−CD56+ NK cells (median, 45 vs 27 cells per mm2; P = .8661) and CD163+CMAF+ M2 macrophages (median, 11 vs 10 cells per mm2; P = .3654) in the 2 groups (data not shown).
These results confirm earlier interpretations of computational biology analysis of GSE10846 DLBCL gene expression profiles (Figure 1C) and demonstrate that characteristics of the tumor microenvironment vs the presence of malignant B cells are the distinguishing features of classifier-positive vs classifier-negative DLBCL tumors. The results also demonstrate the ability to replicate and predict membership of these phenotypic DLBCL subgroups using a weighted combination of 26 gene expression scores to represent complex cellular biology.
Association between the gene classifier for avadomide and chemotherapy clinical outcomes
The classifier was subsequently applied to NanoString expression profiles of pretreatment biopsies from R/R DLBCL patients enrolled in a phase 1 clinical trial of avadomide monotherapy (CC-122-ST-001, NCT01421524) described by Carpio et al.16 Classifier output was evaluated to test the hypothesis that subgroup B corresponds to patients having enriched positive outcomes in response to avadomide treatment. This R/R patient cohort exhibited gene expression patterns that were similar (Figure 4A) to those observed in the frontline DLBCL cohorts described earlier in this article (Figure 2B-C). Classifier-positive patients displayed an overall response rate of 46% and median PFS (mPFS) of 6.1 months vs an overall response rate of 21% and mPFS of 1.6 months for classifier-negative patients (mPFS hazard ratio, 0.490; 95% confidence interval, 0.280-0.857; log-rank test P = .0096) (Figure 4B). As expected, COO classification using the NanoString-based lymphoma subtyping test did not correlate with subgroup classifier status in the same patients, and COO was not significantly associated with response to avadomide.16
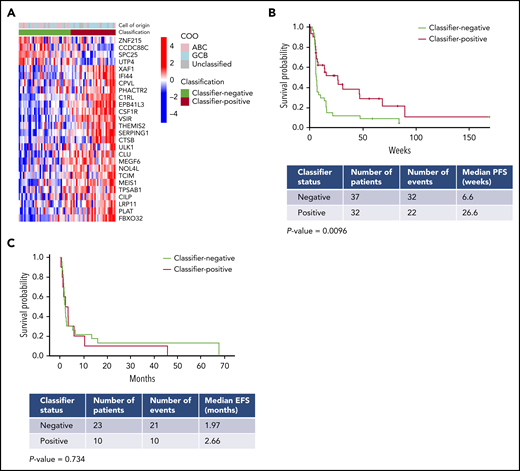
Gene expression classifier enriches for response to avadomide in DLBCL. (A) Heat map showing application of the gene expression classifier to the CC-122-ST-001 trial dataset. (B) Classifier status at screening in 69 R/R DLBCL patients enrolled in a trial of avadomide monotherapy (32 classifier-positive; 37 classifier-negative) showed a significant correlation with PFS. (C) Classifier status did not correlate with outcome in R/R DLBCL patients treated with rituximab-containing chemotherapy.20 .
Gene expression classifier enriches for response to avadomide in DLBCL. (A) Heat map showing application of the gene expression classifier to the CC-122-ST-001 trial dataset. (B) Classifier status at screening in 69 R/R DLBCL patients enrolled in a trial of avadomide monotherapy (32 classifier-positive; 37 classifier-negative) showed a significant correlation with PFS. (C) Classifier status did not correlate with outcome in R/R DLBCL patients treated with rituximab-containing chemotherapy.20 .
Analysis of GSE10846 (Figure 1D) above suggests that the DLBCL subgroups that underpin the classifier are not prognostic for standard of care. This analysis was expanded to the R/R setting by NanoString profiling of an independent cohort of biopsies from R/R DLBCL patients treated with rituximab-containing chemotherapy salvage regimens (rituximab, ifosfamide, carboplatin, etoposide [R-ICE]; rituximab, dexamethasone, cytarabine, cisplatin [R-DHAP]; or rituximab, gemcitabine, oxaliplatin [R-GemOx]) from the Mayo Clinic/Iowa SPORE MER cohort (Figure 4C). No significant differences in event-free survival were observed in classifier-positive vs classifier-negative R/R DLBCL patients, suggesting that the classifier is not globally prognostic in the R/R DLBCL setting (P = .734).
Discussion
Identifying the right drug for the right patient is a universal challenge in cancer drug development. Despite some successes with targeted agents, such as crizotinib, trastuzumab, and enasidenib in anaplastic lymphoma kinase–positive non–small cell lung cancer, HER2-overexpressing breast cancer, and IDH2-mutated R/R acute myeloid leukemia, respectively, frequent failures in randomized all-comers controlled phase 3 trials highlight a continued need for new patient-selection strategies.31-33 Focusing on well-defined patient subgroups is a means to address disease heterogeneity and improve outcome, in particular for cancers like DLBCL, which are clinically and biologically heterogeneous and characterized by genomic variability. However, many promising drugs target cancer susceptibilities that are not related to single-gene alterations in the tumor cells, which complicates this approach. In this context, gene expression–based signatures that can capture combined expression from a mixture of cells and/or the phenotypic results of multiple genetic alterations may better define molecular subsets of patients who have the potential to derive greater benefit from a new drug. Attempts to date have been hampered by reliance on gene signatures and thresholds derived solely from responder/nonresponder outcomes in initial trials that do not validate further in prospective studies.
To overcome such challenges, we used the following approach for implementing a patient-selection strategy in early-phase drug development: (1) application of unsupervised stratification to publicly available data to identify robust molecular patient subgroups, (2) detailed characterization and laboratory-based validation of the intrinsic biology of each patient subgroup to enable the association of ≥1 subgroup to drug mechanism of action, (3) construction of a platform-independent classifier(s) to predict patient membership in subgroups of interest, (4) design and validation of a clinically applicable assay based on the established classifier(s), and (5) application of the clinical assay in early-phase trials to monitor enrichment of response or other clinical characteristics of interest in a target subgroup. In this study, preclinical knowledge of avadomide was connected to a DLBCL patient subgroup identified independently and characterized by high immune cell infiltration, resulting in classifier-defined patients exhibiting a better clinical outcome compared with their classifier-negative counterparts. Biological interpretation of the subgroups leveraged to create this classifier reflected themes of the DLBCL tumor microenvironment biology that have been described in the literature, adding to the likelihood that they are biologically relevant and persistent in future patient populations. For example, the classifier-positive subgroup was found to be associated with the stromal-1 and stromal-2 signatures reported by Lenz et al,7 supporting the observation of an infiltrated tumor microenvironment by endothelial cells and cells of the monocytic lineage (Wilcoxon P < .001; supplemental Figure 7). Furthermore, the classifier-positive subgroup was found to be associated with the host response consensus cluster reported by Monti et al19 (Wilcoxon P < .001; supplemental Figure 8).19 These associations reflect the strong and established disease properties on which the classifier is based and prompt consideration of potential for broader application to enrich patient response for other agents that target the tumor microenvironment, such as CD47/SIRPα-targeting checkpoint-blockade antibodies and anti-CD19 chimeric antigen receptor T-cell therapy.
Increasingly, substantial efforts to create disease landscapes from large collections of patient molecular profiling and clinical data are producing new insights into disease landscape, risk, and progression in what continues to be an area of intense research effort toward understanding and treating lymphoma.34-36 This study seeks to demonstrate that the outcome of early-phase clinical studies may be better understood when interpreted through the lens of a comprehensively stratified disease.
Data sharing requests should be sent to Anita K. Gandhi (agandhi@celgene.com) or Matthew Trotter (mtrotter@celgene.com).
The online version of this article contains a data supplement.
The publication costs of this article were defrayed in part by page charge payment. Therefore, and solely to indicate this fact, this article is hereby marked “advertisement” in accordance with 18 USC section 1734.
Acknowledgments
The authors thank Dorothy Fallows for medical writing assistance and Bio Connections, LLC for editorial assistance.
This work was supported by Celgene Corporation, a Bristol-Myers Squibb Company.
Authorship
Contribution: A.R., P.R.H., M.P., A.K.G., and M.W.B.T. designed the study; A.R., P.R.H., J.S.P., C.P.D., G.S.N., M.J.M., J.R.C., X.W., Y.R., C-W.L., S.C., S.C., M.W., F.T., M.P., A.K.G., and M.W.B.T. contributed to data interpretation and analysis. A.R., P.R.H., C.F., A.D., X.W., Y.R., C-W.L., S.C., M.W., F.T., and M.P. collected data; and A.R., P.R.H., M.P., A.K.G., F.T., and M.W.B.T. wrote the manuscript. All authors had full access to all of the data, carefully reviewed the manuscript, and approved the final version. Celgene, a Bristol-Myers Squibb Company, was involved in study design, compilation of data, and statistical analysis.
Conflict-of-interest disclosure: J.S.P. and C.P.D. have served as consultants or advisors for Celgene, a Bristol-Myers Squibb Company. G.S.N. has received research funding from Morphosys, NanoString, and Celgene, a Bristol-Myers-Squibb Company, and served as a consultant or advisor for Morphosys, Celgene, a Bristol-Myers-Squibb Company, and Genentech. M.J.M. has received research funding from NanoString and Celgene, a Bristol-Myers-Squibb Company, and served as a consultant or advisor for Morphosys. J.R.C. has received research funding from NanoString and Celgene, a Bristol-Myers Squibb Company, and served on the advisory board for Janssen. S.C. had equity ownership in Celgene, a Bristol-Myers Squibb Company. A.R., P.R.H., C.F., A.D., X.W., Y.R., C.-W.L., M.W., F.T., M.P. A.K.G., and M.W.B.T. are employees of and have equity ownership in Bristol-Myers Squibb. C.-W.L. has been a member of the speaker’s bureau for PerkinElmer. F.T. owns stock in Immuneering Corporation.
Correspondence: Anita K. Gandhi, Bristol-Myers Squibb, 556 Morris Ave, Summit, NJ 07901; e-mail: agandhi@celgene.com; and Matthew W. B. Trotter, Celgene Institute for Translational Research Europe, a Bristol-Myers Squibb Company, Seville, Spain; e-mail: mtrotter@celgene.com.

This feature is available to Subscribers Only
Sign In or Create an Account Close Modal