

Key Points
HLF is overexpressed in normal karyotype AML triple mutated for NPM1, DNMT3A, and FLT3–internal tandem duplication (ITD).
Loss of HLF reduces the CD34+GPR56+ compartment, accelerates cell cycle progression, and decreases HES1 and CDKN1C expression.

Abstract
FLT3, DNMT3A, and NPM1 are the most frequently mutated genes in cytogenetically normal acute myeloid leukemia (AML), but little is known about how these mutations synergize upon cooccurrence. Here we show that triple-mutated AML is characterized by high leukemia stem cell (LSC) frequency, an aberrant leukemia-specific GPR56highCD34low immunophenotype, and synergistic upregulation of Hepatic Leukemia Factor (HLF). Cell sorting based on the LSC marker GPR56 allowed isolation of triple-mutated from DNMT3A/NPM1 double-mutated subclones. Moreover, in DNMT3A R882-mutated patients, CpG hypomethylation at the HLF transcription start site correlated with high HLF mRNA expression, which was itself associated with poor survival. Loss of HLF via CRISPR/Cas9 significantly reduced the CD34+GPR56+ LSC compartment of primary human triple-mutated AML cells in serial xenotransplantation assays. HLF knockout cells were more actively cycling when freshly harvested from mice, but rapidly exhausted when reintroduced in culture. RNA sequencing of primary human triple-mutated AML cells after shRNA-mediated HLF knockdown revealed the NOTCH target Hairy and Enhancer of Split 1 (HES1) and the cyclin-dependent kinase inhibitor CDKN1C/p57 as novel targets of HLF, potentially mediating these effects. Overall, our data establish HLF as a novel LSC regulator in this genetically defined high-risk AML subgroup.
Introduction
For a considerable number of patients suffering from acute myeloid leukemia (AML), current antileukemic therapies fail to permanently eradicate the disease. Hence, allogeneic stem cell transplantation (SCT) often remains the only curative approach, but is itself associated with high treatment-related morbidity and mortality.1 Numerous efforts have been taken to precisely predict therapy outcome and established a clear association between the cytogenetic background of the disease and prognosis.2 Patients with no genetic aberrations detectable by standard cytogenetics (cytogenetically normal [CN])-AML represent approximately 40% of patients with AML.2 Knowledge about molecular genetic aberrations has therefore become crucial in these patients not only for our understanding of the underlying pathomechanisms but also for risk stratification and therapy decisions.3 Among the most intensively studied molecular aberrations are DNMT3A,4 NPM1, and FLT3–internal tandem duplication (ITD) mutations.5-7 Cooccurrence of these 3 mutations is more frequent than can be explained by chance,8 and is associated with typical clinical features such as significantly higher white blood cell counts and prevalence in young women.9 In addition, recent studies revealed genetic interaction of these 3 mutations in mice10 and humans,11 further suggesting that triple-mutated AML represents a distinct entity with very poor outcome. At the same time, little is known about the molecular pathways driving leukemia and chemoresistance in these patients; for example, it is unknown whether the 3 mutations have only additive effects, or whether novel and specific pathways are induced in a synergistic way. Here we set out to determine genetic, phenotypic, and transcriptomic characteristics of triple-mutated AML, and identified Hepatic Leukemia Factor (HLF) as a specific target gene in this high-risk AML group.
Materials and methods
Patient and cord blood samples
Peripheral blood and bone marrow specimens were collected from adult AML patients after obtaining written informed consent in accordance with the Declaration of Helsinki. Approval of the project was obtained from the Research Ethics Boards of the Medical Faculties of Martin-Luther University Halle (Saale), Heidelberg University, Maisonneuve-Rosemont Hospital, CHU de Québec and University of Montreal, and the Klinikum der Ludwig-Maximilians-Universität, Munich. Cord blood units of healthy infants were collected after obtaining written informed consent at the Department of Obstetrics at University Hospitals Halle (Saale) and Heidelberg after procedures that were approved by the Research Ethics Board of the Medical Faculty of Martin Luther University Halle-Wittenberg and the Medical Faculty of Heidelberg University. MN1/ND13 engineered cord blood CD34+ cells were generated as described.12 Patient-derived xenografted AML-491 cells were generated by serial transplantation of primary patient leukemia cells in NOD.Cg-Prkdcscid Il2rgtm1Wjl/SzJ (NSG) mice, as described previously.13
CRISPR/Cas9
Guide RNAs against HLF, CD45, and green fluorescent protein (GFP) were designed and purchased from Synthego. Sequences for guides are as follows: HLF#sg1: UUUGCUGGCAACAGCUGACC, HLF#sg2: CAAUGGGACUUGGUGUAUUG, sgCD45: GGUGCUGGUGUUGGGCGCAC, sgGFP: GGGCGAGGAGCUGUUCACCG.
Xenotransplantation
NOD.Rag1-; γcnull-SGM3 (NRGS) mice, which produce the 3 human cytokines stem cell factor, granulocyte-macrophage colony–stimulating factor, and IL-3, were purchased from Jackson Laboratories. NOD.Cg-KitW-41JPrkdcscidIl2rgtm1Wjl/WaskJ (NSGW41) mice carrying a homozygous Kit mutation were generated as described.14 Mice were bred in specific pathogen-free animal facilities at Martin-Luther University Halle (Saale) and the German Cancer Research Center, Heidelberg. Animal experiments were approved and performed in accordance with all regulatory guidelines of the official committees (Landesverwaltungsamt Sachsen-Anhalt and Regierungspräsidium Karlsruhe).
Publicly available data sets
Sample and patient characteristics from The Cancer Genome Atlas (TCGA) AML patient cohort (cancergenome.nih.gov) were obtained from published work.8 Microarray and clinical data for Verhaak15 and Metzeler data sets were available through www.leukemia-gene-atlas.org.16 Survival data in supplemental Figure 1B were adopted from Metzeler et al.17 Whole-genome bisulfite sequencing data of DNMT3A mutated and wild-type patients of the TCGA cohort were downloaded from Spencer et al.18 HLF ChIP data were downloaded from GEO accession GSE69817.19
Additional methods
Additional methods are provided in supplemental Information, available on the Blood Web site.
Results
Triple-mutated AML samples are characterized by an aberrant GPR56highCD34low immunophenotype and high LSC frequency
To identify unique characteristics of triple-mutated AML, we analyzed the mutational landscape of 65 AML samples at diagnosis, which had been subjected to RNA-sequencing (RNA-Seq) as part of the Leucegene Project.20-25 We grouped specimens according to their mutational status of the 3 genes, FLT3-ITD (F), NPM1 (N), and DNMT3A (D), into single-, double-, and triple-mutated samples, and those not mutated in these 3 genes hereafter called “triple wild-type” (WT; Figure 1A; supplemental Table 1). The group of triple-mutated AML samples was further subdivided on the basis of whether the mutation in DNMT3A was located at amino acid position 882 (R882H, R882C) or elsewhere, including missense, point-non-sense, and frameshift mutations (supplemental Table 1). To assess whether the LSC marker GPR5626 could help identify patients with triple-mutated AML, we immunophenotyped all 65 AML specimens with regard to CD45, CD34, and GPR56, and correlated the 3 distinct, previously defined26 flow cytometry profiles with genetic groups. We found that the great majority of triple-mutated AML, and in particular all DNMT3A R882-mutated triple AML samples, displayed a distinct immunophenotype characterized by a predominant GPR56-positive (GPR56pos) population, of which a minor subpopulation was also CD34pos (profile 2, Figure 1A-B). This GPR56highCD34low phenotype was not shared by normal freshly isolated or cultured hematopoietic stem and progenitor cells (HSPCs; supplemental Figure 1A), which indicated that the GPR56highCD34low profile (profile 2) was aberrant and leukemia-specific. Of note, cooccurrence of mutations in the FLT3 tyrosine kinase domain, together with NPM1 and DNMT3A mutation, was not associated with profile 2. Overall, detection of the aberrant profile 2 implied an 84-fold increased probability that a patient was triple-mutated at diagnosis, suggesting that addition of GPR56 to flow cytometry panels might help identify this genetic subgroup (Figure 1C; χ2 test, P < .0001).
![Figure 1. Triple-mutated AML samples are characterized by an aberrant GPR56high CD34low immunophenotype and high LSC frequency. (A) Mutational landscape of 65 AML samples at first diagnosis. Blue box indicates mutated, light gray box indicates nonmutated. Color coded bar on top shows grouping of samples according to their mutational status for FLT3-ITD, NPM1, and DNMT3A into single-mutated (n = 16, orange group), double-mutated (n = 14, green group), and triple-mutated samples (n = 22) split into those with a typical DNMT3A mutation at position R882 (n = 13, black) and those with other DNMT3A mutations (n = 9, dark gray). Samples not mutated for the 3 genes are included in the blue group (n = 13). Color-coded bar at the bottom indicates the immunophenotypic profile with regard to CD34 and GPR56 percentage determined by flow cytometry: profile 1 defined as CD34% > GPR56%, profile 2 as GPR56% > CD34%, and profile 3 as all CD34-negative samples (CD34 < 1%). (B) Representative examples of the 3 different immunophenotypic profiles as defined in panel A. (C) Numbers of triple mutations in patients with profile 2 vs other groups. Detection of the aberrant profile 2 at diagnosis implies an 84-fold greater chance to simultaneously harbor mutations in FLT3-ITD, NPM1, and DNMT3A (Fisher´s exact test, P < .0001). (D) GPR56 mRNA expression in AML samples at diagnosis in different genetic groups. Box and whiskers plot (Tukey) showing reads per kilobase per million mapped reads (RPKM, transformed as log10[RPKM + 0.001]) values for GPR56 mRNA based on RNA-Seq data in genetic groups (n = 388). Median RPKM for GPR56: 3.1 (WT), 6.6 (F), 12.47 (NF), 31.19 (DNF). P values provided in supplemental Table 2. (E, left) Box and whiskers plot (Tukey) showing GPR56 mRNA expression levels (transformed as log10(RPKM + 0.001) in FLT3-ITD-mutated patients with a mutant allele frequency > 0.5 (n = 34) and < 0.5 (n = 87). Medians were 9.25 vs 33.79 (P = .0005, Mann-Whitney U). (Right) FLT3-ITD mutant allele frequencies in samples with GPR56 mRNA expression above (n = 60) or below or equal to (n = 61) the median (RPKM 16). Allelic frequencies were 0.38 vs 0.55 (P < .0001, unpaired Student t test). (F) FLT3-ITD allelic frequencies in AML samples at diagnosis. Symbols represent individual samples, bars show average mutant allele frequencies in FLT3-ITD mutated patients with no mutation in NPM1 or DNMT3A (F, n = 34), with DNMT3A mutation and NPM1 WT (DF, n = 7), with NPM1 but no DNMT3A mutation (NF, n = 26), with NPM1 and DNMT3A mutation (DNF, n = 42). Average frequencies were 0.36 (F), 0.42 (DF), 0.41 (NF), and 0.48 (DNF; P = .018 for F vs DNF, unpaired Student t test). Of note, 24% of triple-mutated samples had FLT3-ITD allele frequencies above 0.5, suggesting that loss of heterozygosity had occurred vs only 8% in FLT3-ITD with nonmutated NPM1 and DNMT3A. (G) Numbers of samples with high LSC frequency in triple-mutated AML vs other groups. Five of 11 triple-mutated AML samples were categorized as “LSChigh,” defined by an LSC frequency greater than 1:30 000 cells compared with only 2 of 27 in the remaining samples (adapted from Pabst et al26; P = .0077; odds ratio 6.67, χ2 test). D, D mutated, NPM1wt, no FLT3-ITD; DF, D and F mutation, NPM1wt; F, FLT3-ITD, D and N not mutated; N, NPM1 mutated, no F or D mutation; ND, N and D mutation, no FLT3-ITD; NF, N and F mutation, D wt, DNF:triple-mutated; WT, not mutated for NPM1 (N) or DNMT3A (D) and no FLT3-ITD (F).](https://ash.silverchair-cdn.com/ash/content_public/journal/blood/134/3/10.1182_blood.2018862383/3/m_blood862383f1.png?Expires=1763541078&Signature=TUzcCP9pCyyKfhWcNPpFKbu-tAehU~pWoWudn2JX7H6gbkLP99AqAKRdqrc~WGTVGCao0444~aiAHiIYLGkVtJid-qpeSkMxYJTBxFHOZ-mufYfg0QmlKBgpKCMlQMquGRc64JZLKhlxCHmeDGmD3jXJT20a0mG0dwhSMCxChhBHLV59cxza8Npl8it3yotg7gLrEny7huryS9AmAPVfDDZqqrTI3ZKf6hyF0u0pE7H-Mn8gdw21h3u8BAJMFbQXq~tMSHcFTM5PpsNKMRi0QidVsU5iyM~EFsZLONKavg3uE4-P3zxCSwCFMLuqwb-3pcazdO7hqnuI7V~ZX3mcCw__&Key-Pair-Id=APKAIE5G5CRDK6RD3PGA)
Triple-mutated AML samples are characterized by an aberrant GPR56high CD34low immunophenotype and high LSC frequency. (A) Mutational landscape of 65 AML samples at first diagnosis. Blue box indicates mutated, light gray box indicates nonmutated. Color coded bar on top shows grouping of samples according to their mutational status for FLT3-ITD, NPM1, and DNMT3A into single-mutated (n = 16, orange group), double-mutated (n = 14, green group), and triple-mutated samples (n = 22) split into those with a typical DNMT3A mutation at position R882 (n = 13, black) and those with other DNMT3A mutations (n = 9, dark gray). Samples not mutated for the 3 genes are included in the blue group (n = 13). Color-coded bar at the bottom indicates the immunophenotypic profile with regard to CD34 and GPR56 percentage determined by flow cytometry: profile 1 defined as CD34% > GPR56%, profile 2 as GPR56% > CD34%, and profile 3 as all CD34-negative samples (CD34 < 1%). (B) Representative examples of the 3 different immunophenotypic profiles as defined in panel A. (C) Numbers of triple mutations in patients with profile 2 vs other groups. Detection of the aberrant profile 2 at diagnosis implies an 84-fold greater chance to simultaneously harbor mutations in FLT3-ITD, NPM1, and DNMT3A (Fisher´s exact test, P < .0001). (D) GPR56 mRNA expression in AML samples at diagnosis in different genetic groups. Box and whiskers plot (Tukey) showing reads per kilobase per million mapped reads (RPKM, transformed as log10[RPKM + 0.001]) values for GPR56 mRNA based on RNA-Seq data in genetic groups (n = 388). Median RPKM for GPR56: 3.1 (WT), 6.6 (F), 12.47 (NF), 31.19 (DNF). P values provided in supplemental Table 2. (E, left) Box and whiskers plot (Tukey) showing GPR56 mRNA expression levels (transformed as log10(RPKM + 0.001) in FLT3-ITD-mutated patients with a mutant allele frequency > 0.5 (n = 34) and < 0.5 (n = 87). Medians were 9.25 vs 33.79 (P = .0005, Mann-Whitney U). (Right) FLT3-ITD mutant allele frequencies in samples with GPR56 mRNA expression above (n = 60) or below or equal to (n = 61) the median (RPKM 16). Allelic frequencies were 0.38 vs 0.55 (P < .0001, unpaired Student t test). (F) FLT3-ITD allelic frequencies in AML samples at diagnosis. Symbols represent individual samples, bars show average mutant allele frequencies in FLT3-ITD mutated patients with no mutation in NPM1 or DNMT3A (F, n = 34), with DNMT3A mutation and NPM1 WT (DF, n = 7), with NPM1 but no DNMT3A mutation (NF, n = 26), with NPM1 and DNMT3A mutation (DNF, n = 42). Average frequencies were 0.36 (F), 0.42 (DF), 0.41 (NF), and 0.48 (DNF; P = .018 for F vs DNF, unpaired Student t test). Of note, 24% of triple-mutated samples had FLT3-ITD allele frequencies above 0.5, suggesting that loss of heterozygosity had occurred vs only 8% in FLT3-ITD with nonmutated NPM1 and DNMT3A. (G) Numbers of samples with high LSC frequency in triple-mutated AML vs other groups. Five of 11 triple-mutated AML samples were categorized as “LSChigh,” defined by an LSC frequency greater than 1:30 000 cells compared with only 2 of 27 in the remaining samples (adapted from Pabst et al26 ; P = .0077; odds ratio 6.67, χ2 test). D, D mutated, NPM1wt, no FLT3-ITD; DF, D and F mutation, NPM1wt; F, FLT3-ITD, D and N not mutated; N, NPM1 mutated, no F or D mutation; ND, N and D mutation, no FLT3-ITD; NF, N and F mutation, D wt, DNF:triple-mutated; WT, not mutated for NPM1 (N) or DNMT3A (D) and no FLT3-ITD (F).
Triple-mutated AML samples are characterized by an aberrant GPR56high CD34low immunophenotype and high LSC frequency. (A) Mutational landscape of 65 AML samples at first diagnosis. Blue box indicates mutated, light gray box indicates nonmutated. Color coded bar on top shows grouping of samples according to their mutational status for FLT3-ITD, NPM1, and DNMT3A into single-mutated (n = 16, orange group), double-mutated (n = 14, green group), and triple-mutated samples (n = 22) split into those with a typical DNMT3A mutation at position R882 (n = 13, black) and those with other DNMT3A mutations (n = 9, dark gray). Samples not mutated for the 3 genes are included in the blue group (n = 13). Color-coded bar at the bottom indicates the immunophenotypic profile with regard to CD34 and GPR56 percentage determined by flow cytometry: profile 1 defined as CD34% > GPR56%, profile 2 as GPR56% > CD34%, and profile 3 as all CD34-negative samples (CD34 < 1%). (B) Representative examples of the 3 different immunophenotypic profiles as defined in panel A. (C) Numbers of triple mutations in patients with profile 2 vs other groups. Detection of the aberrant profile 2 at diagnosis implies an 84-fold greater chance to simultaneously harbor mutations in FLT3-ITD, NPM1, and DNMT3A (Fisher´s exact test, P < .0001). (D) GPR56 mRNA expression in AML samples at diagnosis in different genetic groups. Box and whiskers plot (Tukey) showing reads per kilobase per million mapped reads (RPKM, transformed as log10[RPKM + 0.001]) values for GPR56 mRNA based on RNA-Seq data in genetic groups (n = 388). Median RPKM for GPR56: 3.1 (WT), 6.6 (F), 12.47 (NF), 31.19 (DNF). P values provided in supplemental Table 2. (E, left) Box and whiskers plot (Tukey) showing GPR56 mRNA expression levels (transformed as log10(RPKM + 0.001) in FLT3-ITD-mutated patients with a mutant allele frequency > 0.5 (n = 34) and < 0.5 (n = 87). Medians were 9.25 vs 33.79 (P = .0005, Mann-Whitney U). (Right) FLT3-ITD mutant allele frequencies in samples with GPR56 mRNA expression above (n = 60) or below or equal to (n = 61) the median (RPKM 16). Allelic frequencies were 0.38 vs 0.55 (P < .0001, unpaired Student t test). (F) FLT3-ITD allelic frequencies in AML samples at diagnosis. Symbols represent individual samples, bars show average mutant allele frequencies in FLT3-ITD mutated patients with no mutation in NPM1 or DNMT3A (F, n = 34), with DNMT3A mutation and NPM1 WT (DF, n = 7), with NPM1 but no DNMT3A mutation (NF, n = 26), with NPM1 and DNMT3A mutation (DNF, n = 42). Average frequencies were 0.36 (F), 0.42 (DF), 0.41 (NF), and 0.48 (DNF; P = .018 for F vs DNF, unpaired Student t test). Of note, 24% of triple-mutated samples had FLT3-ITD allele frequencies above 0.5, suggesting that loss of heterozygosity had occurred vs only 8% in FLT3-ITD with nonmutated NPM1 and DNMT3A. (G) Numbers of samples with high LSC frequency in triple-mutated AML vs other groups. Five of 11 triple-mutated AML samples were categorized as “LSChigh,” defined by an LSC frequency greater than 1:30 000 cells compared with only 2 of 27 in the remaining samples (adapted from Pabst et al26 ; P = .0077; odds ratio 6.67, χ2 test). D, D mutated, NPM1wt, no FLT3-ITD; DF, D and F mutation, NPM1wt; F, FLT3-ITD, D and N not mutated; N, NPM1 mutated, no F or D mutation; ND, N and D mutation, no FLT3-ITD; NF, N and F mutation, D wt, DNF:triple-mutated; WT, not mutated for NPM1 (N) or DNMT3A (D) and no FLT3-ITD (F).
In line with flow cytometry data, GPR56 mRNA levels were also highest in triple-mutated AML compared with the other groups. (Figure 1D; supplemental Table 2 for P values). As allelic burden of FLT3-ITD (ITD-load) has been shown to play a more important role in prognosis than its presence alone,27 we determined FLT3-ITD mutant to wild-type ratios and found that even within the FLT3-ITD mutated samples, GPR56 expression levels increased with mutant allele frequency (Figure 1E). In parallel, we observed that the ITD-load was significantly higher when NPM1 and DNMT3A were co-mutated (Figure 1F; P = .019, unpaired Student t test; supplemental Table 3). These data suggested that co-mutations in NPM1 and DNMT3A better support expansion of the FLT3-ITD clone and potentially facilitate loss of heterozygosity compared with other mutations that co-occur with FLT3-ITD.
To analyze the association between triple-mutated AML and LSC content, we interrogated our database containing LSC frequencies of 56 AML samples26 and found significantly higher numbers of LSChigh samples in triple-mutated AML compared with other samples. This suggested that the 3 mutations synergize to induce specific self-renewal programs that enhance LSC activity (Figure 1G; supplemental Table 4).
Further evidence for such synergy came from survival analyses of patients with CN-AML within the German Acute Myeloid Leukemia Cooperative Group (AMLCG) cohort,17 which revealed significant prognostic value of FLT3-ITD only when both NPM1 and DNMT3A were mutated (P = .0086). FLT3-ITD on its own or in combination with mutations in either NPM1 or DNMT3A alone showed a trend toward poor prognosis, but had no significant prognostic value confirming previous reports11 in an independent patient cohort (supplemental Figure 1B).
Overall, these observations suggest that mutations in NPM1, DNMT3A, and FLT3-ITD interact with each other to drive a specific, aggressive subtype of AML characterized by high LSC frequency, high expression of the LSC-associated marker GPR56, and high FLT3-ITD allelic burden.
Triple-mutated leukemic subclones can be isolated on the basis of GPR56 protein expression
Given the strong association between FLT3-ITD load and GPR56 expression, we hypothesized that GPR56 might distinguish the triple-mutated from the DNMT3A, NPM1 double-mutated clone even within triple-mutated samples. To test this, we randomly selected 10 triple-mutated specimens, sorted GPR56- and CD34-positive and -negative fractions, and performed RNA-Seq to obtain information on gene expression and genetic alterations (outlined in Figure 2A). Indeed, we observed divergent FLT3-ITD mutant allele frequencies in the GPR56-positive and GPR56-negative fractions in 5 of the 10 samples (Figure 2B) and validated these results by semiquantitative polymerase chain reaction (PCR), using genomic DNA for 2 samples (Figure 2C). The copresence of heterozygous, bona fide AML-causing mutations in the genes NPM1, DNMT3A, and either IDH1 (R132H) or IDH2 (R140Q) in all 3 sorted fractions confirmed that all fractions contained a similarly high proportion of leukemic cells with no major contamination by normal cells (Figure 2D; supplemental Table 5). In 3 samples (07H042, 09H002, 09H083), we found subclonal PTPN11 and NRAS mutations, which were exclusively present in the GPR56 negative fractions, further demonstrating that GPR56-positive and GPR56-negative fractions had undergone individual clonal evolution. The most striking example was sample 09H083, in which copy neutral loss of heterozygosity occurred on (parts of) chromosome 13 after acquisition of an FLT3-ITD mutation (Figure 2E; supplemental Figure 2). It lost the PTPN11-mutated minor subclone at relapse, which was accompanied by the loss of the GPR56-negative population (Figure 2F). In conclusion, GPR56 expression characterized not only triple-mutated patients but also the triple-mutated leukemic subclones with high ITD load within individual samples.
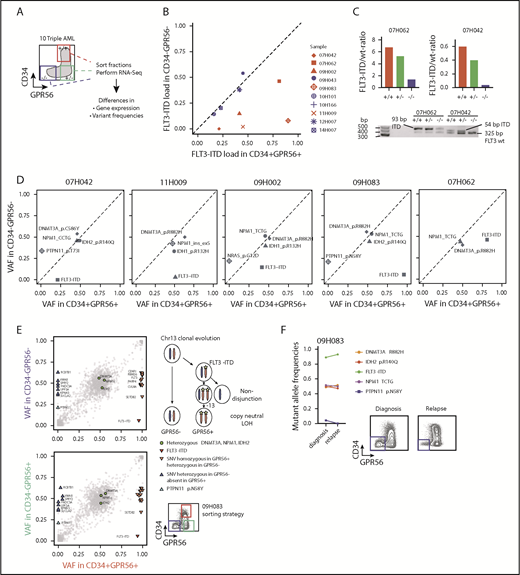
Triple-mutated leukemic subclones can be distinguished from double-mutated clones based on GPR56 expression. (A) Schematic overview of the sorting strategy of 10 triple-mutated AML samples. +/+, CD34+GPR56+; −/+, CD34−GPR56+; −/−, CD34−GPR56−. (B) FLT3-ITD mutant allele frequencies determined by kmer approach in RNA-Seq data obtained from CD34+GPR56+ and CD34−GPR56− fractions. Divergent FLT3-ITD frequencies were found in the sorted fractions of samples marked in red, whereas no difference was found in samples marked in blue. Of note, in the 5 samples, in which FLT3-ITD ratios were not divergent in the sorted fractions, FLT3-ITD was close to 50% allele frequency indicating that it was not subclonal in 12H007, 10H166, 09H043, whereas in 2 samples (14H007, 10H101) FLT3-ITD was below 50% in all fractions. (C) Confirmation of divergent FLT3 mutant/wild-type ratios in samples 07H042 and 07H062 by PCR using genomic DNA isolated from CD34+GPR56+ (+/+), CD34−GPR56+ (−/+), and CD34−GPR56− (−/−) sorted fractions (upper, bars indicating FLT3 mutant/wild-type ratios; lower, agarose gel showing FLT3 wild-type band at 325 bp, +93 bp ITD in sample 07H062, and +54 bp ITD in 07H042). (D) Variant allele frequencies (VAF) of mutations with known leukemogenic potential in GPR56 positive and negative fractions shown for 5 AML samples with divergent FLT3-ITD load. Mutations with VAF close to the diagonal line indicate no difference between the sorted fractions. See supplemental Table 5 for information on CD34−GPR56+ fractions. (E) Detailed VAF analysis in GPR56 positive and negative sorted fractions for sample 09H083. (F, left) Comparison of VAF in unsorted sample 09H083 compared with the corresponding unsorted relapse sample 10H068. (Right) Fluorescence-activated cell sorter (FACS) plots showing CD34 and GPR56 protein expression in sample 09H083 at diagnosis and in the corresponding relapse sample. The loss of the PTPN11 clone at relapse is accompanied by the loss of the GPR56 negative population.
Triple-mutated leukemic subclones can be distinguished from double-mutated clones based on GPR56 expression. (A) Schematic overview of the sorting strategy of 10 triple-mutated AML samples. +/+, CD34+GPR56+; −/+, CD34−GPR56+; −/−, CD34−GPR56−. (B) FLT3-ITD mutant allele frequencies determined by kmer approach in RNA-Seq data obtained from CD34+GPR56+ and CD34−GPR56− fractions. Divergent FLT3-ITD frequencies were found in the sorted fractions of samples marked in red, whereas no difference was found in samples marked in blue. Of note, in the 5 samples, in which FLT3-ITD ratios were not divergent in the sorted fractions, FLT3-ITD was close to 50% allele frequency indicating that it was not subclonal in 12H007, 10H166, 09H043, whereas in 2 samples (14H007, 10H101) FLT3-ITD was below 50% in all fractions. (C) Confirmation of divergent FLT3 mutant/wild-type ratios in samples 07H042 and 07H062 by PCR using genomic DNA isolated from CD34+GPR56+ (+/+), CD34−GPR56+ (−/+), and CD34−GPR56− (−/−) sorted fractions (upper, bars indicating FLT3 mutant/wild-type ratios; lower, agarose gel showing FLT3 wild-type band at 325 bp, +93 bp ITD in sample 07H062, and +54 bp ITD in 07H042). (D) Variant allele frequencies (VAF) of mutations with known leukemogenic potential in GPR56 positive and negative fractions shown for 5 AML samples with divergent FLT3-ITD load. Mutations with VAF close to the diagonal line indicate no difference between the sorted fractions. See supplemental Table 5 for information on CD34−GPR56+ fractions. (E) Detailed VAF analysis in GPR56 positive and negative sorted fractions for sample 09H083. (F, left) Comparison of VAF in unsorted sample 09H083 compared with the corresponding unsorted relapse sample 10H068. (Right) Fluorescence-activated cell sorter (FACS) plots showing CD34 and GPR56 protein expression in sample 09H083 at diagnosis and in the corresponding relapse sample. The loss of the PTPN11 clone at relapse is accompanied by the loss of the GPR56 negative population.
Transcriptome analysis of triple-mutated AML samples reveals specifically high expression of HLF
To investigate the molecular mechanisms underlying the pathology of triple-mutated AML, we analyzed RNA-Seq data of 137 CN-AML samples contained in the Leucegene cohort. A set of genes potentially driven by all 3 mutations was preselected by requiring their expression to be most extreme in either the WT or the triple-mutated group (n = 4025). These genes were subsequently grouped into 10 clusters on the basis of their expression profiles, using an unsupervised clustering approach (partitioning around medoids; Figures 3A-B; supplemental Table 6; see supplemental Information for details). Given that GPR56-positive and GPR56-negative fractions distinguished the triple- from the double-mutated clone in several samples (Figure 2), we also performed differential gene expression analysis on RNA-Seq data of the sorted fractions. Indeed, we found great overlap of differentially expressed genes that distinguished triple- from non-triple-mutated AML and GPR56-positive from GPR56-negative fractions (Figure 3A-B).
![Figure 3. Differential gene expression in triple-mutated AML. (A) Heat map of average normalized gene expression (Z-score) for each genetic group in the AML data set. Splits separate the different-gene clusters, and genes are sorted from high (top) to low (bottom) gene expression in triple-mutated AML. Only genes with an average expression of library-normalized raw-read counts higher than 30 are shown. Letter code as defined in Figure 1D. (B) Heat map of average Z-score normalized in GPR56 sorted fractions. Genes are sorted as in panel A. PP, GPR56+CD34+; MP, GPR56−CD34+; MM, GPR56−CD34−. (C) Enrichment analysis of biological processes for AML clusters. The background is defined using genes that are expressed and annotated to any ontology term. P values and odds ratios were calculated using Fisher's exact test, multiple-test correction using Benjamini and Hochberg method was applied to nominal P values. (D) Box and whisker plots of Z-score normalized gene expression for genes in clusters showing a gradual synergistic pattern compared with triple-mutated AML samples (ie, CL1-3 and CL8-10) for each of the 8 genetic groups. (E) Heat maps of the expression profile for transcription factors (rows) in the selected clusters shown in panel D in each genetic group (columns). (F) Normalized read counts for HLF, GLI2, and KLF12 in the defined, 8 genetic groups (left) and in the sorted fractions (right). Letter code defined in Figures 1E and 3B. (G) Combinatorial scatter plot showing gene expression (log[RPKM+0.001]) of HLF and GLI2 (left) and of HLF in combination with KLF12 (right) in AML and normal CD34+ populations. Symbols represent individual samples. (H) HLF mRNA expression (RPKM) in 8 matched diagnosis-relapse samples. Five pairs were triple-mutated at diagnosis and relapse (DNF), whereas 3 samples were NPM1 and DNMT3A double-mutated and gained an FLT3-ITD mutation at relapse (DN/DNF). Numbers indicate matched sample IDs.](https://ash.silverchair-cdn.com/ash/content_public/journal/blood/134/3/10.1182_blood.2018862383/3/m_blood862383f3.png?Expires=1763541078&Signature=Njvm5grD3xJmgrgoKcGMbEt5djYH9h1Oj1kGQAD0SCJ6pQEWq4-0032uO4fEIuMJwP-6fi6Na6t~cSh4JF4exPvSFX40ny34saOUJcqUoei8YX~6BewyyBtcJgkKq7upNqTXnv54efBvfreQj2weEEKsz3FYSR0x9JfUHR0buKn-0P40TwJTMIp4-E-VMXEnQ8QYp4ErflwAs4M83tC-~~JdYT2~Vo-4kekzWoyzQwWKEdzf-uq4JXqrzM7hJoTpwhXKUsx7Y6y5YAnEI~aMmGuudHXLA0DTcAP8oUOciXb1C5Uz2m6~V3awuhZZXRrr0ry54-DhxdbbERLcEwPm4A__&Key-Pair-Id=APKAIE5G5CRDK6RD3PGA)
Differential gene expression in triple-mutated AML. (A) Heat map of average normalized gene expression (Z-score) for each genetic group in the AML data set. Splits separate the different-gene clusters, and genes are sorted from high (top) to low (bottom) gene expression in triple-mutated AML. Only genes with an average expression of library-normalized raw-read counts higher than 30 are shown. Letter code as defined in Figure 1D. (B) Heat map of average Z-score normalized in GPR56 sorted fractions. Genes are sorted as in panel A. PP, GPR56+CD34+; MP, GPR56−CD34+; MM, GPR56−CD34−. (C) Enrichment analysis of biological processes for AML clusters. The background is defined using genes that are expressed and annotated to any ontology term. P values and odds ratios were calculated using Fisher's exact test, multiple-test correction using Benjamini and Hochberg method was applied to nominal P values. (D) Box and whisker plots of Z-score normalized gene expression for genes in clusters showing a gradual synergistic pattern compared with triple-mutated AML samples (ie, CL1-3 and CL8-10) for each of the 8 genetic groups. (E) Heat maps of the expression profile for transcription factors (rows) in the selected clusters shown in panel D in each genetic group (columns). (F) Normalized read counts for HLF, GLI2, and KLF12 in the defined, 8 genetic groups (left) and in the sorted fractions (right). Letter code defined in Figures 1E and 3B. (G) Combinatorial scatter plot showing gene expression (log[RPKM+0.001]) of HLF and GLI2 (left) and of HLF in combination with KLF12 (right) in AML and normal CD34+ populations. Symbols represent individual samples. (H) HLF mRNA expression (RPKM) in 8 matched diagnosis-relapse samples. Five pairs were triple-mutated at diagnosis and relapse (DNF), whereas 3 samples were NPM1 and DNMT3A double-mutated and gained an FLT3-ITD mutation at relapse (DN/DNF). Numbers indicate matched sample IDs.
Differential gene expression in triple-mutated AML. (A) Heat map of average normalized gene expression (Z-score) for each genetic group in the AML data set. Splits separate the different-gene clusters, and genes are sorted from high (top) to low (bottom) gene expression in triple-mutated AML. Only genes with an average expression of library-normalized raw-read counts higher than 30 are shown. Letter code as defined in Figure 1D. (B) Heat map of average Z-score normalized in GPR56 sorted fractions. Genes are sorted as in panel A. PP, GPR56+CD34+; MP, GPR56−CD34+; MM, GPR56−CD34−. (C) Enrichment analysis of biological processes for AML clusters. The background is defined using genes that are expressed and annotated to any ontology term. P values and odds ratios were calculated using Fisher's exact test, multiple-test correction using Benjamini and Hochberg method was applied to nominal P values. (D) Box and whisker plots of Z-score normalized gene expression for genes in clusters showing a gradual synergistic pattern compared with triple-mutated AML samples (ie, CL1-3 and CL8-10) for each of the 8 genetic groups. (E) Heat maps of the expression profile for transcription factors (rows) in the selected clusters shown in panel D in each genetic group (columns). (F) Normalized read counts for HLF, GLI2, and KLF12 in the defined, 8 genetic groups (left) and in the sorted fractions (right). Letter code defined in Figures 1E and 3B. (G) Combinatorial scatter plot showing gene expression (log[RPKM+0.001]) of HLF and GLI2 (left) and of HLF in combination with KLF12 (right) in AML and normal CD34+ populations. Symbols represent individual samples. (H) HLF mRNA expression (RPKM) in 8 matched diagnosis-relapse samples. Five pairs were triple-mutated at diagnosis and relapse (DNF), whereas 3 samples were NPM1 and DNMT3A double-mutated and gained an FLT3-ITD mutation at relapse (DN/DNF). Numbers indicate matched sample IDs.
To gain insight into potential pathways that might specifically be associated with triple-mutated AML, we performed gene ontology term enrichment analyses for the 10 defined clusters (Figures 3C-D; full list of enriched gene ontology terms provided in supplemental Table 7). Cluster 1 (CL1) showed the most distinct triple-mutated AML-defining expression profile for upregulated genes, and as expected, GPR56 was part of it (Figure 3A-B). Moreover, it contained genes associated with cilium assembly and microtubule-based transport, including several intraflagellar transport and Bardet-Biedl syndrome genes (supplemental Table 6; see supplemental Figure 3A-G and supplemental Text for additional information on transcriptome analysis).
As transcription factors (TFs) have been well described in orchestrating normal hematopoietic development,28 we next focused on the expression profiles of TFs in triple AML in comparison with the other genetic groups and with healthy blood cells. Among the 6 TFs significantly enriched in CL1 (Figure 3E), HLF reached high expression levels almost exclusively in triple AML, whereas the other 5 TFs showed already slightly elevated expression levels in the single-mutated groups (Figure 3E-F; supplemental Figure 3C). When analyzing coexpression patterns of these TFs in normal HSPCs, we found that high concomitant HLF and GLI2 expression was restricted to, and therefore aberrant in, AML, as it was observed neither in normal human CD34+ cord blood nor in CD34+CD33+ bone marrow myeloid progenitor cells (Figure 3G). In addition, high HLF expression and low expression of the CL10 genes KLF12 (Figure 3G) and HMGA2 (supplemental Figure 3F) was also an aberrant leukemia-associated pattern, as normal HSPCs coexpressed these genes at high levels. In 7 of 8 triple-mutated AML samples for which matched relapse samples were available, we observed higher HLF expression at relapse than at diagnosis (P = .038; Figure 3H). The 3 samples that gained most at relapse, however, were NPM1/DNMT3A double-mutated at diagnosis and had acquired an FLT3-ITD mutation at relapse (Figure 3H). In conclusion, our differential gene expression studies revealed HLF as one of the most triple-mutated AML-defining genes.
Methylation levels at the HLF transcription start site correlate with HLF expression and DNMT3A mutational status
Missense mutations at position R882 in DNMT3A lead to reduced de novo DNA methyltransferase activity.29 To investigate whether upregulation of HLF, for example, by NPM1c and FLT3-ITD co-mutations, might be facilitated by loss of DNA methylation at the transcription start site, we compared DNA methylation levels at cytosine guanine dinucleotide (CpG) sites along the HLF locus in AML samples with high and low HLF expression in the publicly available TCGA AML data sets.8 In line with our hypothesis, we found that HLF mRNA expression anticorrelated with methylation levels at CpG sites close to the HLF transcription start site determined by 450K methylation arrays (Figure 4A; supplemental Table 8). Moreover, methylation levels of CpGs close to the HLF transcription start site were significantly lower in patients with DNMT3A R882-mutated vs DNMT3A wild-type AML (Figure 4B; supplemental Table 9). In line with 450K array data, we also found decreased DNA methylation levels in DNMT3A-mutated patients around the HLF transcription start site in publicly available whole-genome bisulfite sequencing data18 (supplemental Figure 4). Together, these data point toward potential epigenetic regulation of HLF expression.
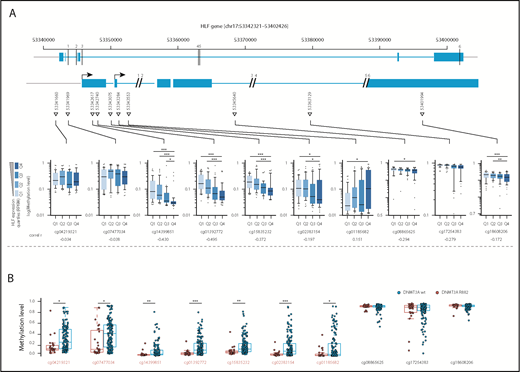
Methylation levels at the transcription start site correlate with HLF expression and DNMT3A mutational status. (A, upper) Schematic overview of the localization of CpGs assessed by the Illumina 450K methylation array in the HLF gene (upper row shows entire HLF gene with exons and introns; lower row shows enlarged regions assessed for CpG methylation; CpG positions are indicated by triangles, and numbered black bars indicate gaps not shown in the enlarged regions). (A, lower) Methylation levels at indicated CpGs according to HLF mRNA expression levels in the TCGA patient cohort. Patients were grouped according to HLF expression (RPKM) into quartiles (n = 156, box plots according to Tukey method; see supplemental Table 8 for details). Only P values <.005 are shown. **P < .005; ***P < .0005. Correl r: Pearson correlation coefficients for direct correlation of methylation and HLF mRNA expression levels. (B) Methylation levels in DNMT3A R882-mutated (red, n = 27) and wild-type patients (blue, n = 145) from the TCGA patient cohort. DNMT3A mutations other than R882 were excluded from the analysis, given their undetermined effect on DNA methylation levels. Positions marked in red indicate CpGs with significant differences in methylation level between the 2 groups. P values were determined by Mann-Whitney U test and were Benjamini-Hochberg corrected. *P < .05; **P < .005; ***P < .0005.
Methylation levels at the transcription start site correlate with HLF expression and DNMT3A mutational status. (A, upper) Schematic overview of the localization of CpGs assessed by the Illumina 450K methylation array in the HLF gene (upper row shows entire HLF gene with exons and introns; lower row shows enlarged regions assessed for CpG methylation; CpG positions are indicated by triangles, and numbered black bars indicate gaps not shown in the enlarged regions). (A, lower) Methylation levels at indicated CpGs according to HLF mRNA expression levels in the TCGA patient cohort. Patients were grouped according to HLF expression (RPKM) into quartiles (n = 156, box plots according to Tukey method; see supplemental Table 8 for details). Only P values <.005 are shown. **P < .005; ***P < .0005. Correl r: Pearson correlation coefficients for direct correlation of methylation and HLF mRNA expression levels. (B) Methylation levels in DNMT3A R882-mutated (red, n = 27) and wild-type patients (blue, n = 145) from the TCGA patient cohort. DNMT3A mutations other than R882 were excluded from the analysis, given their undetermined effect on DNA methylation levels. Positions marked in red indicate CpGs with significant differences in methylation level between the 2 groups. P values were determined by Mann-Whitney U test and were Benjamini-Hochberg corrected. *P < .05; **P < .005; ***P < .0005.
Loss of HLF reduces the CD34+GPR56+ LSC compartment in vivo
Before performing experiments with triple-mutated AML, we validated knockdown levels and effect of 2 small hairpin RNAs (shRNAs) targeting human HLF in cord blood CD34+ cells (Figure 5A). There was no significant difference in cell expansion or colony formation potential of lentivirally transduced fluorescent-positive cells between knockdown (KD) and respective control cells, using optimized culture conditions30 (supplemental Figure 5A-B). Although absolute cell counts were not affected, differentiation marker analysis during 4-week in vitro culture revealed more rapid loss of the HSC-enriched CD34+CD45RA− population and accelerated myelomonocytic differentiation upon HLF KD (Figure 5B; supplemental Figure 5C). Finally, in vivo experiments in NRGS mice showed significantly lower engraftment levels of HLF KD cells at all time points analyzed (Figure 5C). Of note, viability was not affected by HLF KD (supplemental Figure 5D).
![Figure 5. Loss of HLF reduces the CD34+ GPR56+ LSC compartment in vivo. (A) Knockdown level of HLF mRNA in CD34+ cord blood cells with 2 different shRNAs compared with shRNA against luciferase (shLuc) determined by quantitative PCR. HLF expression as percentage of glyceraldehyde-3-phosphate dehydrogenase (GAPDH) expression was normalized to shLuc controls. Values indicate means (shHLF.3441, mean fraction [range] of shLuc expression 0.4 [0.2-0.67]; shHLF.630 mean [range] fraction of shLuc expression 0.06 [0.03-0.12]). Bars and error bars represent means and standard deviation of 3 individual CD34+ cord blood infections. (B, left) FACS plots showing differentiation of cord blood CD34+ cells 5 and 27 days after infection with shRNA.3441 against HLF or luciferase. Shown is 1 of 4 replicates derived from 2 independent experiments. Protein expression of CD34 and CD45RA were tracked during a period of 27 days. Values indicate percentages. (Right) Box plots showing fractions of CD34+CD45RA− cells on day 5 (upper, median percentage 30.85% vs 25.65%; P = .02) and CD34+CD45RA+ cells on day 27 (lower, 20.80% vs 7.2%; P = .02) after infection with shHLF.3441 or shLuc (4 replicates of 2 independent infections, Mann-Whitney U test, *P < .05). (C) Engraftment of cord blood CD34+ cells in NRGS mice after infection with shRNAs against HLF or luciferase, using tagRFP as fluorescent marker. Horizontal lines indicate means; symbols represent individual mice. Shown are the percentages of human CD45+tagRFP+ cells in mouse bone marrow. At weeks 4 and 12, bone marrow was collected by aspiration from 1 femur, whereas bones from tibia, femur, pelvis, and spine were analyzed after sacrificing the mice in week 17. Mean engraftment levels at week 4: 24.8% vs 59.5% (n = 6 per group; P = .01); week 12: 0.6% vs 10.1% (n = 4, shHLF group, no aspiration material for 2 mice; n = 5, shLuc group, no aspiration material for 1 mouse; P = .046); week 17: 2.9% vs 11% (n = 5, shHLF, 1 mouse died before week 17; n = 6, shLuc; P = .029). (D) Cartoon illustrating experimental setup of in vitro and in vivo experiments. See Materials and methods for details. (E) Western blot showing human HLF protein expression in triple-mutated primary human AML cells (AML#04H112) harvested from mice 14 weeks after injection of cells electroporated with either sgRNA against HLF (sgHLF) or GFP (sgGFP, negative control) and Cas9 recombinant protein. GAPDH was used as loading control. Numbers below western blot indicate the knockout efficiency (%) for HLF, determined by Sanger sequencing on the genomic DNA from the same cells (see supplemental Figure 6B for gDNA results). Mouse IDs in bold indicate mice used for secondary transplantations. (F) Engraftment levels of total human CD45+ cells (left; mean percentages, from left to right, 99%, 98%, 99%), and fractions of CD34+GPR56+ (middle; mean percentages, from left to right, 15.80%, 38.5%, 34.9%), and CD34−GPR56− (right; mean percentages, from left to right, 36%, 14%, 12%) cells of human CD45+ cells in primary recipient mice. Shown are individual mice and means. *P < .05; **P < .05, unpaired Student t test. (G) Representative FACS plots showing CD34 and GPR56 expression in sgGFP cells (left; HLF protein not lost), sgHLF cells with confirmed loss of HLF protein (middle), and those with sgHLF but no loss of HLF protein (see supplemental Figure 6 for complete data). Mice #247 and #198 were used for secondary transplantations. Values indicate percentages; #s indicate mouse IDs. (H) Proliferation curves for 5 sgGFP samples (blue) and 3 sgHLF samples with confirmed loss of HLF protein (red). Shown is fold-increase in absolute cell counts per well normalized to the start date of the culture. From each bone marrow sample, 6 replicate cultures were started. The average cell counts of the 6 cultures of each sample were used to compare the 5 sgGFP vs the 3 sgHLF samples (mean fold-change on day 3 was 2.3 vs 1 and on day 5 was 3.2 vs 0.8). Cells were counted by HTS-FACS. *P < .05; **P < .005, unpaired Student t test. (I) Overall human engraftment levels and CD34 and GPR56 surface expression in secondary recipients injected with 2 × 10⁶ sgGFP (#246) or sgHLF (#198) cells. Shown are means and individual values for week 4 and 7 bone marrow aspirates and final bone marrow analysis post mortem in week 8 for total human CD45+ levels (left; mean percentages, week 4: 4.8% vs 29%; week 7: 87% vs 98%; final: 96% vs 99%), CD34+GPR56+ fractions of human CD45+ cells (middle; mean percentages, week 4: 13% vs 8%; week 7: 26% vs 0.7%; final: 37% vs 1.6%), and CD34−GPR56− fractions of human CD45+ cells (right; mean percentages, week 4: 9% vs 18%; week 7: 6% vs 45%; final: 5.5% vs 34%). *P < .05; **P < .005; ***P < .0005, unpaired Student t test. The third sgGFP mouse died before final bone marrow analysis, so data for this mouse are only available from week 4 and 7. (J) Representative FACS profiles showing CD34 and GPR56 expression of human sgGFP and sgHLF cells engrafted in secondary recipients 8 weeks after injection of 2 × 10⁶ cells. Numbers in quadrants indicate percentages. (K) Proliferation curves of sgHLF and sgGFP (control) cells in vitro after harvest from secondary recipients 8 weeks after injection of 2 × 10⁶ (2M) cells. Six cultures were started in 96-well plate formats from each mouse. Average cell counts of the 6 cultures per sample were used to compare the groups and were normalized to the start date of the culture. Cells were counted by HTS-FACS. *P < .05; **P < .005, unpaired Student t test. +, positive; AM, ametrine; BM, bone marrow; i.v., intravenous; K, thousand; M, million; n.s., not significant.](https://ash.silverchair-cdn.com/ash/content_public/journal/blood/134/3/10.1182_blood.2018862383/3/m_blood862383f5.png?Expires=1763541078&Signature=2vgylsCnkMYz~3-Ey5tdw3vGTyMRZ1F5-hI53XRxS9pXTiDE9arWb8PYA-z8dp00jh~t0vIxQBhG7tewR6-K6k0rCvb1ZQeTle1ZoUDuSady~rpCswsv5TM03QuNtGksXIb8EWiWNyMIL~M2NlaHowzQijrpDT51VSbKgVLODt3qlnbGzZ3Z6MnuamSYRx8ZerPI3soqj~4pxdD9dYRcacw5OvSQLHUaeizrlq1n0zoGIdfvOzv3eCA7fr-TtaPIfJLszJ9QP2jaCVWO81s6RqXgia3sRIp4q8QV9aeg14~EVB7X93eQCo~qz~uZbjySp~mBtJpr3I7I3wh016-SIg__&Key-Pair-Id=APKAIE5G5CRDK6RD3PGA)
Loss of HLF reduces the CD34+ GPR56+ LSC compartment in vivo. (A) Knockdown level of HLF mRNA in CD34+ cord blood cells with 2 different shRNAs compared with shRNA against luciferase (shLuc) determined by quantitative PCR. HLF expression as percentage of glyceraldehyde-3-phosphate dehydrogenase (GAPDH) expression was normalized to shLuc controls. Values indicate means (shHLF.3441, mean fraction [range] of shLuc expression 0.4 [0.2-0.67]; shHLF.630 mean [range] fraction of shLuc expression 0.06 [0.03-0.12]). Bars and error bars represent means and standard deviation of 3 individual CD34+ cord blood infections. (B, left) FACS plots showing differentiation of cord blood CD34+ cells 5 and 27 days after infection with shRNA.3441 against HLF or luciferase. Shown is 1 of 4 replicates derived from 2 independent experiments. Protein expression of CD34 and CD45RA were tracked during a period of 27 days. Values indicate percentages. (Right) Box plots showing fractions of CD34+CD45RA− cells on day 5 (upper, median percentage 30.85% vs 25.65%; P = .02) and CD34+CD45RA+ cells on day 27 (lower, 20.80% vs 7.2%; P = .02) after infection with shHLF.3441 or shLuc (4 replicates of 2 independent infections, Mann-Whitney U test, *P < .05). (C) Engraftment of cord blood CD34+ cells in NRGS mice after infection with shRNAs against HLF or luciferase, using tagRFP as fluorescent marker. Horizontal lines indicate means; symbols represent individual mice. Shown are the percentages of human CD45+tagRFP+ cells in mouse bone marrow. At weeks 4 and 12, bone marrow was collected by aspiration from 1 femur, whereas bones from tibia, femur, pelvis, and spine were analyzed after sacrificing the mice in week 17. Mean engraftment levels at week 4: 24.8% vs 59.5% (n = 6 per group; P = .01); week 12: 0.6% vs 10.1% (n = 4, shHLF group, no aspiration material for 2 mice; n = 5, shLuc group, no aspiration material for 1 mouse; P = .046); week 17: 2.9% vs 11% (n = 5, shHLF, 1 mouse died before week 17; n = 6, shLuc; P = .029). (D) Cartoon illustrating experimental setup of in vitro and in vivo experiments. See Materials and methods for details. (E) Western blot showing human HLF protein expression in triple-mutated primary human AML cells (AML#04H112) harvested from mice 14 weeks after injection of cells electroporated with either sgRNA against HLF (sgHLF) or GFP (sgGFP, negative control) and Cas9 recombinant protein. GAPDH was used as loading control. Numbers below western blot indicate the knockout efficiency (%) for HLF, determined by Sanger sequencing on the genomic DNA from the same cells (see supplemental Figure 6B for gDNA results). Mouse IDs in bold indicate mice used for secondary transplantations. (F) Engraftment levels of total human CD45+ cells (left; mean percentages, from left to right, 99%, 98%, 99%), and fractions of CD34+GPR56+ (middle; mean percentages, from left to right, 15.80%, 38.5%, 34.9%), and CD34−GPR56− (right; mean percentages, from left to right, 36%, 14%, 12%) cells of human CD45+ cells in primary recipient mice. Shown are individual mice and means. *P < .05; **P < .05, unpaired Student t test. (G) Representative FACS plots showing CD34 and GPR56 expression in sgGFP cells (left; HLF protein not lost), sgHLF cells with confirmed loss of HLF protein (middle), and those with sgHLF but no loss of HLF protein (see supplemental Figure 6 for complete data). Mice #247 and #198 were used for secondary transplantations. Values indicate percentages; #s indicate mouse IDs. (H) Proliferation curves for 5 sgGFP samples (blue) and 3 sgHLF samples with confirmed loss of HLF protein (red). Shown is fold-increase in absolute cell counts per well normalized to the start date of the culture. From each bone marrow sample, 6 replicate cultures were started. The average cell counts of the 6 cultures of each sample were used to compare the 5 sgGFP vs the 3 sgHLF samples (mean fold-change on day 3 was 2.3 vs 1 and on day 5 was 3.2 vs 0.8). Cells were counted by HTS-FACS. *P < .05; **P < .005, unpaired Student t test. (I) Overall human engraftment levels and CD34 and GPR56 surface expression in secondary recipients injected with 2 × 10⁶ sgGFP (#246) or sgHLF (#198) cells. Shown are means and individual values for week 4 and 7 bone marrow aspirates and final bone marrow analysis post mortem in week 8 for total human CD45+ levels (left; mean percentages, week 4: 4.8% vs 29%; week 7: 87% vs 98%; final: 96% vs 99%), CD34+GPR56+ fractions of human CD45+ cells (middle; mean percentages, week 4: 13% vs 8%; week 7: 26% vs 0.7%; final: 37% vs 1.6%), and CD34−GPR56− fractions of human CD45+ cells (right; mean percentages, week 4: 9% vs 18%; week 7: 6% vs 45%; final: 5.5% vs 34%). *P < .05; **P < .005; ***P < .0005, unpaired Student t test. The third sgGFP mouse died before final bone marrow analysis, so data for this mouse are only available from week 4 and 7. (J) Representative FACS profiles showing CD34 and GPR56 expression of human sgGFP and sgHLF cells engrafted in secondary recipients 8 weeks after injection of 2 × 10⁶ cells. Numbers in quadrants indicate percentages. (K) Proliferation curves of sgHLF and sgGFP (control) cells in vitro after harvest from secondary recipients 8 weeks after injection of 2 × 10⁶ (2M) cells. Six cultures were started in 96-well plate formats from each mouse. Average cell counts of the 6 cultures per sample were used to compare the groups and were normalized to the start date of the culture. Cells were counted by HTS-FACS. *P < .05; **P < .005, unpaired Student t test. +, positive; AM, ametrine; BM, bone marrow; i.v., intravenous; K, thousand; M, million; n.s., not significant.
Loss of HLF reduces the CD34+ GPR56+ LSC compartment in vivo. (A) Knockdown level of HLF mRNA in CD34+ cord blood cells with 2 different shRNAs compared with shRNA against luciferase (shLuc) determined by quantitative PCR. HLF expression as percentage of glyceraldehyde-3-phosphate dehydrogenase (GAPDH) expression was normalized to shLuc controls. Values indicate means (shHLF.3441, mean fraction [range] of shLuc expression 0.4 [0.2-0.67]; shHLF.630 mean [range] fraction of shLuc expression 0.06 [0.03-0.12]). Bars and error bars represent means and standard deviation of 3 individual CD34+ cord blood infections. (B, left) FACS plots showing differentiation of cord blood CD34+ cells 5 and 27 days after infection with shRNA.3441 against HLF or luciferase. Shown is 1 of 4 replicates derived from 2 independent experiments. Protein expression of CD34 and CD45RA were tracked during a period of 27 days. Values indicate percentages. (Right) Box plots showing fractions of CD34+CD45RA− cells on day 5 (upper, median percentage 30.85% vs 25.65%; P = .02) and CD34+CD45RA+ cells on day 27 (lower, 20.80% vs 7.2%; P = .02) after infection with shHLF.3441 or shLuc (4 replicates of 2 independent infections, Mann-Whitney U test, *P < .05). (C) Engraftment of cord blood CD34+ cells in NRGS mice after infection with shRNAs against HLF or luciferase, using tagRFP as fluorescent marker. Horizontal lines indicate means; symbols represent individual mice. Shown are the percentages of human CD45+tagRFP+ cells in mouse bone marrow. At weeks 4 and 12, bone marrow was collected by aspiration from 1 femur, whereas bones from tibia, femur, pelvis, and spine were analyzed after sacrificing the mice in week 17. Mean engraftment levels at week 4: 24.8% vs 59.5% (n = 6 per group; P = .01); week 12: 0.6% vs 10.1% (n = 4, shHLF group, no aspiration material for 2 mice; n = 5, shLuc group, no aspiration material for 1 mouse; P = .046); week 17: 2.9% vs 11% (n = 5, shHLF, 1 mouse died before week 17; n = 6, shLuc; P = .029). (D) Cartoon illustrating experimental setup of in vitro and in vivo experiments. See Materials and methods for details. (E) Western blot showing human HLF protein expression in triple-mutated primary human AML cells (AML#04H112) harvested from mice 14 weeks after injection of cells electroporated with either sgRNA against HLF (sgHLF) or GFP (sgGFP, negative control) and Cas9 recombinant protein. GAPDH was used as loading control. Numbers below western blot indicate the knockout efficiency (%) for HLF, determined by Sanger sequencing on the genomic DNA from the same cells (see supplemental Figure 6B for gDNA results). Mouse IDs in bold indicate mice used for secondary transplantations. (F) Engraftment levels of total human CD45+ cells (left; mean percentages, from left to right, 99%, 98%, 99%), and fractions of CD34+GPR56+ (middle; mean percentages, from left to right, 15.80%, 38.5%, 34.9%), and CD34−GPR56− (right; mean percentages, from left to right, 36%, 14%, 12%) cells of human CD45+ cells in primary recipient mice. Shown are individual mice and means. *P < .05; **P < .05, unpaired Student t test. (G) Representative FACS plots showing CD34 and GPR56 expression in sgGFP cells (left; HLF protein not lost), sgHLF cells with confirmed loss of HLF protein (middle), and those with sgHLF but no loss of HLF protein (see supplemental Figure 6 for complete data). Mice #247 and #198 were used for secondary transplantations. Values indicate percentages; #s indicate mouse IDs. (H) Proliferation curves for 5 sgGFP samples (blue) and 3 sgHLF samples with confirmed loss of HLF protein (red). Shown is fold-increase in absolute cell counts per well normalized to the start date of the culture. From each bone marrow sample, 6 replicate cultures were started. The average cell counts of the 6 cultures of each sample were used to compare the 5 sgGFP vs the 3 sgHLF samples (mean fold-change on day 3 was 2.3 vs 1 and on day 5 was 3.2 vs 0.8). Cells were counted by HTS-FACS. *P < .05; **P < .005, unpaired Student t test. (I) Overall human engraftment levels and CD34 and GPR56 surface expression in secondary recipients injected with 2 × 10⁶ sgGFP (#246) or sgHLF (#198) cells. Shown are means and individual values for week 4 and 7 bone marrow aspirates and final bone marrow analysis post mortem in week 8 for total human CD45+ levels (left; mean percentages, week 4: 4.8% vs 29%; week 7: 87% vs 98%; final: 96% vs 99%), CD34+GPR56+ fractions of human CD45+ cells (middle; mean percentages, week 4: 13% vs 8%; week 7: 26% vs 0.7%; final: 37% vs 1.6%), and CD34−GPR56− fractions of human CD45+ cells (right; mean percentages, week 4: 9% vs 18%; week 7: 6% vs 45%; final: 5.5% vs 34%). *P < .05; **P < .005; ***P < .0005, unpaired Student t test. The third sgGFP mouse died before final bone marrow analysis, so data for this mouse are only available from week 4 and 7. (J) Representative FACS profiles showing CD34 and GPR56 expression of human sgGFP and sgHLF cells engrafted in secondary recipients 8 weeks after injection of 2 × 10⁶ cells. Numbers in quadrants indicate percentages. (K) Proliferation curves of sgHLF and sgGFP (control) cells in vitro after harvest from secondary recipients 8 weeks after injection of 2 × 10⁶ (2M) cells. Six cultures were started in 96-well plate formats from each mouse. Average cell counts of the 6 cultures per sample were used to compare the groups and were normalized to the start date of the culture. Cells were counted by HTS-FACS. *P < .05; **P < .005, unpaired Student t test. +, positive; AM, ametrine; BM, bone marrow; i.v., intravenous; K, thousand; M, million; n.s., not significant.
To investigate the role of HLF in AML, we selected a triple-mutated sample with very high LSC frequency determined in previous studies (04H112),26 and pursued 2 parallel approaches to reduce HLF expression (Figure 5D): 1 based on a plasmid-free CRISPR/Cas9 system and another based on lentiviral transduction of shRNAs. For both approaches, we used an optimized NSGW41 xenotransplantation model allowing engraftment of very low stem cell numbers without prior irradiation.14 As primary AML cells rapidly change LSC activity in vitro despite optimized culture conditions,31 we injected triple-mutated AML cells directly after transfection with the most efficient sgRNA against HLF and Cas9, using sgRNA against GFP as negative control (supplemental Figure 6A). When harvesting cells 14 weeks after transplantation, we determined cleavage efficiency on genomic DNA (supplemental Figure 6B) and confirmed loss of HLF protein by western blot in 3 of 5 mice (Figure 5E).
Overall engraftment levels of human CD45+ cells were close to 100% (saturation) in all mice. In contrast, the CD34+GPR56+ compartment, which we previously showed to be highly enriched for LSCs,26 was significantly lower in mice, in which HLF protein was lost (hereafter called HLF knockout [KO] cells) compared with controls; Figures 5F-G; supplemental Figure 6C-D). At the same time, the double-negative compartment, which we showed before to contain no or minimal LSC activity,26 was significantly increased in HLF KO cells compared with controls. When reintroduced in culture, HLF KO cells were not able to further expand, in contrast to control cells (Figure 5H). After reinjecting high and low doses of HLF KO and control cells in secondary recipients, we detected human leukemic engraftment in all mice, but HLF KO cells reached high engraftment levels more rapidly (Figure 5I). Although the CD34+GPR56+ fraction in control cells did not differ between primary and secondary transplantations, it was even more strongly reduced in secondary compared with primary mice transplanted with HLF KO cells (Figures 5I,J; supplemental Figure 6E). When reintroduced in culture, we observed again that HLF KO cells had significantly reduced proliferative capacity (Figure 5K; supplemental Figure 6F).
We noticed that some nonnormal karyotype AML samples mimic the GPR56highCD34low profile 2 of triple-mutated AML (supplemental Figure 6G). To test whether such samples respond in a similar way to HLF knockdown, we transduced AML-491 with shRNAs against HLF or shLuc control. We observed similar effects compared with those observed with triple-mutated AML 04H112 using the CRISPR/Cas9 system: HLF KD significantly reduced the CD34+GPR56+ compartment in primary recipients and, more severely, in secondary recipients, and accelerated engraftment in secondary recipients (supplemental Figure 6H-J). Together, these results showed that loss of HLF impaired the function of GPR56highCD34low AML cells.
Loss of HLF expression accelerates cell cycle progression and reduces the expression levels of HES1 and CDKN1C/p57
Given the distinct engraftment dynamics, we sought to further characterize cell cycle and proliferative properties of HLF KO and control cells. Carboxyfluorescein diacetate succinimidyl ester (CFSE) labeling of cells harvested from secondary recipients showed that sgHLF cells had divided more often when analyzed 4 days after experiment start (Figure 6A; supplemental Figure 7A-B). To determine which phase of the cell cycle was most affected by loss of HLF, we performed EdU (5-ethynyl-2′-deoxyuridine) pulse-chase experiments (supplemental Methods). Directly after the 90-minute EdU pulse, we found a significantly higher fraction of EdU-positive sgHLF cells compared with controls in the group injected with 105 (100K) cells (Figure 6B-C). This was accompanied by a significantly lower fraction of sgHLF cells in G1. There were only slight differences between sgHLF and control cells from mice injected with 2 × 10⁶ (2M) cells when assessed directly after the 90-minute pulse. Importantly, despite these initial differences, we observed similar phenotypes when comparing sgHLF with sgGFP cells 14 hours later in both the 100K and 2M groups: a significantly higher fraction of cells had become EdU-positive, accompanied by a reduction of the G1 fraction (Figures 6B-C). Moreover, the fractions of G2/M cells identified by 4′,6-diamidino-2-phenylindole staining were significantly higher in sgHLF compared with control cells at 14 hours after EdU pulse. A significant increase in S phase was also observed for cells that had not incorporated EdU, ruling out an effect of EdU incorporation on the results (supplemental Figure 7C). We did not detect any significant difference in the fractions of quiescent, pyronin-negative, G0 cells (supplemental Figure 7D).

Loss of HLF expression accelerates G1/S transition and reduces the expression levels of HES1 and CDKN1C. (A) CFSE experiment performed with sgGFP and sgHLF cells harvested from secondary recipients. (Upper) Fractions of cells in generations 3 to 6, 4 days after incubation with CFSE. Shown are results of mice injected with 2 × 10⁶ sgGFP (n = 2 mice, 3 cultures per sample) or 2 × 10⁶ sgHLF cells (n = 3 mice, 3 cultures per sample). *P < .05. (Lower) Representative histograms showing distribution of generations 4 days after experiment start. Blue bar indicates starting CFSE intensity, green bar indicates background fluorescence intensity. Numbers indicate mouse IDs. Data from recipients of 105 cells available in supplemental Figure 7A-B. (B) Representative FACS plots of EdU experiment performed with sgGFP and sgHLF cells harvested from secondary recipients injected with 105 cells. Shown is distribution of cells in different cell cycle phases after 90-minute pulse with EdU (t0) and 14 hours later (t14h). Numbers indicate percentages of total. 4′,6-diamidino-2-phenylindole was used to determine DNA content, EdU was detected in fluorescein isothiocyanate channel. (C) EdU experiment performed with cells harvested from secondary recipients injected with either 2 × 10⁶ cells (sgGFP, n = 2; sgHLF, n = 3) or 105 cells (sgGFP, n = 3; sgHLF, n = 3). Shown are mean percentages (and standard deviations) of cells in the indicated cell cycle phases after 90-minute EdU pulse (upper) and after 14 hours (lower) of all viable cells. *P < .05; **P < .005; ***P < .0005. (D) Compound sensitivity testing. Cells harvested from secondary recipients injected with either 2 × 10⁶ cells (sgGFP n = 4 cultures from 2 different mice; sgHLF, n = 6 cultures derived from 3 different mice) or 105 cells (n = 6 cultures derived from 3 different mice per group) were exposed to 50 nM AraC, 50 nM daunorubicin, or 2 µM etoposide compared with DMSO (vehicle) for 5 days. Viable cell counts on day 5 were normalized to cell counts in DMSO. *P < .05; ***P < .0005. (E, left) Volcano plot showing log2-fold changes in mRNA expression (x-axis) and transformed P values (y-axis) for RNA-Seq data performed on triple-mutated cells after 1 round of in vivo expansion, followed by infection with shRNAs against HLF (shHLF.630, n = 3) or shLuc control (n = 3). Data points highlighted by colors represent genes with log2-fold change more than 1 (blue) or less than −1 (red) and FDR<10%. Because of space constraints, not all gene symbols are displayed. See also supplemental Table 10 for gene names. (Right) Mean RPKM values for HES1 (upper) and CDKN1C (lower), n = 3 per group. *P < .05. (F) Expression levels in percentage of GAPDH expression determined by quantitative PCR (qPCR) for HES1 and CDKN1C in sgHLF vs sgGFP cells from primary recipients (upper, sgGFP: #247, #246 vs sgHLF: #197, #198, #199) and secondary recipients (lower, sgGFP: #8013, #8014 vs sgHLF: #8248, #8249). *P < .05; **P < .005. (G, upper) HLF, CDKN1C, and HES1 expression in percentage of GAPDH expression determined by qPCR in the model leukemia MN1/ND13 after lentiviral transduction with shRNA against HLF (sh.630) vs shLuc control after 1 round of in vivo expansion (n = 3 recipients). (Lower) HLF and HES1 expression in healthy cord blood CD34+ cells after lentiviral transduction with 2 different shRNAs against HLF or shLuc control 5 days after infection normalized to shLuc. Numbers indicate mean fractions of shLuc. (H) Kaplan-Meier survival curves showing overall survival from time of diagnosis in patients from the Leucegene prognostic cohort with very high (4th quartile, red line) vs low HLF expression (quartiles 1-3, blue line). Log-rank test. (I) Model indicating the proposed functional role of HLF in triple-mutated AML. HLF induces upregulation of HES1 and CDKN1C, decelerates cell cycle progression, and maintains the CD34+GPR56+ compartment in vivo. Gen, generation; K, thousand; M, million.
Loss of HLF expression accelerates G1/S transition and reduces the expression levels of HES1 and CDKN1C. (A) CFSE experiment performed with sgGFP and sgHLF cells harvested from secondary recipients. (Upper) Fractions of cells in generations 3 to 6, 4 days after incubation with CFSE. Shown are results of mice injected with 2 × 10⁶ sgGFP (n = 2 mice, 3 cultures per sample) or 2 × 10⁶ sgHLF cells (n = 3 mice, 3 cultures per sample). *P < .05. (Lower) Representative histograms showing distribution of generations 4 days after experiment start. Blue bar indicates starting CFSE intensity, green bar indicates background fluorescence intensity. Numbers indicate mouse IDs. Data from recipients of 105 cells available in supplemental Figure 7A-B. (B) Representative FACS plots of EdU experiment performed with sgGFP and sgHLF cells harvested from secondary recipients injected with 105 cells. Shown is distribution of cells in different cell cycle phases after 90-minute pulse with EdU (t0) and 14 hours later (t14h). Numbers indicate percentages of total. 4′,6-diamidino-2-phenylindole was used to determine DNA content, EdU was detected in fluorescein isothiocyanate channel. (C) EdU experiment performed with cells harvested from secondary recipients injected with either 2 × 10⁶ cells (sgGFP, n = 2; sgHLF, n = 3) or 105 cells (sgGFP, n = 3; sgHLF, n = 3). Shown are mean percentages (and standard deviations) of cells in the indicated cell cycle phases after 90-minute EdU pulse (upper) and after 14 hours (lower) of all viable cells. *P < .05; **P < .005; ***P < .0005. (D) Compound sensitivity testing. Cells harvested from secondary recipients injected with either 2 × 10⁶ cells (sgGFP n = 4 cultures from 2 different mice; sgHLF, n = 6 cultures derived from 3 different mice) or 105 cells (n = 6 cultures derived from 3 different mice per group) were exposed to 50 nM AraC, 50 nM daunorubicin, or 2 µM etoposide compared with DMSO (vehicle) for 5 days. Viable cell counts on day 5 were normalized to cell counts in DMSO. *P < .05; ***P < .0005. (E, left) Volcano plot showing log2-fold changes in mRNA expression (x-axis) and transformed P values (y-axis) for RNA-Seq data performed on triple-mutated cells after 1 round of in vivo expansion, followed by infection with shRNAs against HLF (shHLF.630, n = 3) or shLuc control (n = 3). Data points highlighted by colors represent genes with log2-fold change more than 1 (blue) or less than −1 (red) and FDR<10%. Because of space constraints, not all gene symbols are displayed. See also supplemental Table 10 for gene names. (Right) Mean RPKM values for HES1 (upper) and CDKN1C (lower), n = 3 per group. *P < .05. (F) Expression levels in percentage of GAPDH expression determined by quantitative PCR (qPCR) for HES1 and CDKN1C in sgHLF vs sgGFP cells from primary recipients (upper, sgGFP: #247, #246 vs sgHLF: #197, #198, #199) and secondary recipients (lower, sgGFP: #8013, #8014 vs sgHLF: #8248, #8249). *P < .05; **P < .005. (G, upper) HLF, CDKN1C, and HES1 expression in percentage of GAPDH expression determined by qPCR in the model leukemia MN1/ND13 after lentiviral transduction with shRNA against HLF (sh.630) vs shLuc control after 1 round of in vivo expansion (n = 3 recipients). (Lower) HLF and HES1 expression in healthy cord blood CD34+ cells after lentiviral transduction with 2 different shRNAs against HLF or shLuc control 5 days after infection normalized to shLuc. Numbers indicate mean fractions of shLuc. (H) Kaplan-Meier survival curves showing overall survival from time of diagnosis in patients from the Leucegene prognostic cohort with very high (4th quartile, red line) vs low HLF expression (quartiles 1-3, blue line). Log-rank test. (I) Model indicating the proposed functional role of HLF in triple-mutated AML. HLF induces upregulation of HES1 and CDKN1C, decelerates cell cycle progression, and maintains the CD34+GPR56+ compartment in vivo. Gen, generation; K, thousand; M, million.
To test whether loss of HLF sensitized the cells toward drug treatment, we exposed them to high concentrations of the antileukemia drugs AraC (50 nM), daunorubicin (50 nM), and etoposide (2 µM) and observed significantly higher sensitivity of sgHLF vs control cells (Figure 6D). To corroborate our findings, we performed the same experiments again in the GPR56highCD34low non-CN AML-491 and observed similar results in EdU, CFSE labeling, and drug treatment experiments (supplemental Figure 7E-H).
To gain insight into the potential mechanism, we had simultaneously performed RNA-Seq with the same triple-mutated AML sample 04H112 (Figure 5D; supplemental Figure 7I). RNA-Seq revealed downregulation of HES1 and cyclin-dependent kinase inhibitor CDKN1C in HLF KD cells (Figure 6E; supplemental Table 10). To validate these findings, we performed qPCR, with CRISPR/Cas9-transfected cells from primary and secondary transplantations confirming significantly decreased expression of HES1 and CDKN1C in HLF KO cells (Figure 6F). To further support these data, we performed qPCR with a model leukemia (MN1/ND13) generated through overexpression of the 2 oncogenes MN1 and NUP98-HOXD13 in cord blood CD34+ cells,12 and observed a similar decrease in HES1 and CDKN1C expression upon HLF KD indicating that the effect of HLF KD on HES1 and CDKN1C expression was not specific to the triple-mutated AML sample 04H112 (Figure 6G). Similar effects were observed with AML-491, in which Pearson correlation analysis revealed a highly significant correlation between HLF and CDKN1C expression (supplemental Figure 7J). HES1 expression was also decreased in healthy CD34+ cells 5 days after transduction with shRNAs against HLF (Figure 6G). In line with these findings, publicly available ChIP-Seq data obtained from murine HSPCs suggested direct binding of Hlf to the Hes1 transcription start site (supplemental Figure 7K).
Having confirmed a functional role for HLF in high-risk triple-mutated AML, we questioned whether HLF expression itself was associated with patient outcome. We found that high HLF expression was significantly associated with poor overall survival and relapse-free survival in the Leucegene data set from time of diagnosis and after allogeneic stem cell transplantation (Figure 6H; supplemental Figure 78A). Similar results were found with the Verhaak and AMLCG data sets (www.leukemia-gene-atlas.org/LGAtlas/; supplemental Figure 8B). High HLF expression remained a prognostic factor of poor overall survival in multivariate analyses, including age, white blood cell counts, and cytogenetic risk (supplemental Table 11 and 12). In summary, we propose that HLF plays a crucial role for triple-mutated AML by maintaining the CD34+GPR56+ compartment and slowing down cell cycle progression, and identified HES1 and CDKN1C as novel HLF downstream targets possibly mediating these effects (Figure 6I).
Discussion
Here we determined transcriptomic and immunophenotypic characteristics of CN-AML triple-mutated for NPM1, DNMT3A, and FLT3-ITD. We found that presence of all 3 mutations was highly associated with an aberrant immunophenotype defined by high expression of the LSC marker GPR56,26 which itself correlated with FLT3-ITD allelic burden and allowed separation of triple- and double-mutated subclones within the same sample. Moreover, we performed functional in vitro and in vivo experiments and identified a key role for HLF in triple-mutated AML.
Among all TFs that were overexpressed in triple-mutated AML, HLF was clearly different from the others, as it was the only TF for which we observed no expression in single-mutated DNMT3A, NPM1, or FLT3-ITD AML samples, pointing toward synergistic interaction of the 3 mutations. Furthermore, we previously found that Hlf was important for proliferation in an Mn1-induced mouse leukemia model,32 supporting the rationale for studying HLF in AML. Recapitulation of the ancestral disease, including maintenance of the stem cell compartment, is a hallmark of self-renewing LSCs.33,34 Here we found that HLF KO cells were not able to maintain the CD34+GPR56+ compartment, which we showed before to be highly enriched for LSCs26 indicating that HLF was required for propagating the ancestral disease in serial transplantations.
Hlf was identified as a key regulator of stem cell activity in murine HSCs by maintaining quiescent HSCs in G0 and preventing them from entering cell cycle.19,35 Although we did not observe a difference in the G0 fraction between HLF KO vs control AML cells when harvested from mice at late points, we cannot rule out that a difference was present in the early engrafting LSCs. Major alterations in cell cycle dynamics were, however, also detectable when harvesting cells at saturation. EdU pulse-chase and CFSE labeling experiments revealed that loss of HLF strongly enhanced cycling of triple-mutated AML cells. Interestingly, these differences were only visible with cells freshly harvested from mice, as HLF KO cells rapidly lost their expansion potential upon in vitro culture, suggesting that the proliferative capacity of HLF KO cells was dependent on supporting niche factors.
RNA-Seq studies revealed the transcription factor HES1 and CDKN1C/p57 as HLF target genes. Both HES1 through upregulation of p2136 and CDKN1C/p57 together with p2737 have been shown to induce quiescence of normal CD34+ HSCs. CDKN1C also inhibited proliferation of different cancer cell types.38,39 In addition to its role in inducing cell cycle exit,37 CDKN1C seems to also affect other cell cycle phases; for example, induction of CDKN1C in Jurkat cells reduced cyclin E and cyclin A activities, as well as the fraction of cells in S phase,40 which is in line with our EdU experiments, in which loss of HLF accelerated S phase entry.
Although the known function of these target genes is strongly suggestive for a functional role in the HLF-mediated phenotypes, more studies are needed to dissect the mechanisms downstream of HLF.
HLF had been identified in pediatric acute lymphoblastic leukemia (ALL) as a fusion partner of E2A, causing a treatment-resistant disease, whereas ALL induced by fusion of E2A with PBX1 did not,41 suggesting that HLF is the key driver of chemoresistance in E2A-HLF–mutated ALL. In line, we observed that HLF KO cells were more sensitive to in vitro treatment with antileukemic drugs and found that high HLF expression itself correlated with poor survival of patients with AML.
Together, our data establish HLF as a crucial transcription factor in triple-mutated AML, which modulates cell cycle dynamics and maintains the CD34+GPR56+ LSC-enriched compartment in this high-risk genetic subgroup.
Sequencing data are available through Gene Expression Omnibus accession numbers GSE49642, GSE52656, GSE62190, GSE66917, GSE67039, GSE48843, GSE48846, GSE51984, GSE68623, GSE129094, and GSE128848. HLF ChIP data were downloaded from GSE69817.
The online version of this article contains a data supplement.
The publication costs of this article were defrayed in part by page charge payment. Therefore, and solely to indicate this fact, this article is hereby marked “advertisement” in accordance with 18 USC section 1734.
Acknowledgments
The authors acknowledge D. Gagné and V. Eckstein for technical support with cell sorting. Clinical specimens were collected and analyzed by the Banque de Cellules Leucémiques du Québec, supported by the Cancer Research Network of the Fonds de Recherche du Québec en Santé. The authors thank B. Meier for performing FLT3-ITD ratio analyses and T. Herold and K. Metzeler for providing AMLCG cohort data for survival analyses.
This work was supported by the Government of Canada through Genome Canada and the Ministère de l’économie, de l’innovation et de l’exportation du Québec through Génome Québec. G.S. holds a Canada Research Chair in Molecular Genetics of Stem Cells, and J.H. holds a Research Chair in Leukemia supported by Industrielle-Alliance (Université de Montréal). A.R.-P has been a recipient of a postdoctoral fellowship granted by Fundación Ramón Areces and the Research Program “Atracción de Talento de la Comunidad de Madrid” (2017-T2/BMD-5532). This work was further supported by Deutsche Forschungsgemeinschaft (DFG PA2815/1-1), by a Max-Eder-Grant of the German Cancer Aid (70111531), and by the Leukemia and Lymphoma Society of Canada.
Authorship
Contribution: S.G. performed experiments, analyzed data, generated figures, and wrote the manuscript; A.R.-P. performed computational analyses, generated figures, and wrote the manuscript; L.H. contributed to in vivo experiments and edited the manuscript; A.B. performed sorting experiments; V.-P.L., S.L., and P.G. performed RNA-sequencing and mutational analyses of the Leucegene cohort samples; P.J. and J.X. helped perform in vivo experiments and lentiviral transductions; C.R. and C.M.-T. performed and analyzed 450K arrays on AML samples; D.B.L. analyzed 450K arrays; S.I. and R.K.H. generated model leukemia cells; C.W. provided NSGW41 mice and supported in vivo experiments; B.V. and I.J. generated and characterized patient-derived xenografted AML cells; G.R.-C. performed the survival analyses in the Leucegene cohort; J.H. and G.S. provided AML samples, RNA-Seq, and clinical data of the Leucegene sample cohort; J.B.Z. performed bioinformatics analyses, revised the manuscript, and cosupervised the project; and F.B. and C.P. codirected the project and wrote the manuscript.
Conflict-of-interest disclosure: The authors declare no competing financial interests.
Correspondence: Caroline Pabst, Department of Medicine V, Hematology, Oncology and Rheumatology, University Hospital Heidelberg, Im Neunheimer Feld 410, 69120 Heidelberg, Germany; e-mail: caroline.pabst@med.uni-heidelberg.de.

This feature is available to Subscribers Only
Sign In or Create an Account Close Modal