

Key Points
NS-causing SHP2 gain-of-function mutation induces a signaling defect–related thrombopathy with an increased bleeding risk.
NSML-causing SHP2 loss of function induces an elevated platelet response to collagen at high shear rate.

Abstract
Src homology 2 domain–containing phosphatase 2 (SHP2), encoded by the PTPN11 gene, is a ubiquitous protein tyrosine phosphatase that is a critical regulator of signal transduction. Germ line mutations in the PTPN11 gene responsible for catalytic gain or loss of function of SHP2 cause 2 disorders with multiple organ defects: Noonan syndrome (NS) and NS with multiple lentigines (NSML), respectively. Bleeding anomalies have been frequently reported in NS, but causes remain unclear. This study investigates platelet activation in patients with NS and NSML and in 2 mouse models carrying PTPN11 mutations responsible for these 2 syndromes. Platelets from NS mice and patients displayed a significant reduction in aggregation induced by low concentrations of GPVI and CLEC-2 agonists and a decrease in thrombus growth on a collagen surface under arterial shear stress. This was associated with deficiencies in GPVI and αIIbβ3 integrin signaling, platelet secretion, and thromboxane A2 generation. Similarly, arterial thrombus formation was significantly reduced in response to a local carotid injury in NS mice, associated with a significant increase in tail bleeding time. In contrast, NSML mouse platelets exhibited increased platelet activation after GPVI and CLEC-2 stimulation and enhanced platelet thrombotic phenotype on collagen matrix under shear stress. Blood samples from NSML patients also showed a shear stress–dependent elevation of platelet responses on collagen matrix. This study brings new insights into the understanding of SHP2 function in platelets, points to new thrombopathies linked to platelet signaling defects, and provides important information for the medical care of patients with NS in situations involving risk of bleeding.
Introduction
Noonan syndrome (NS; Mendelian inheritance in man #163950) is 1 of the most common autosomal dominant genetic diseases, with an estimated prevalence of 1 per 2500 live births. This syndrome, characterized by facial dysmorphic features, cardiopathies, and growth retardation, belongs to the family of RASopathies because of mutations in genes encoding protein components of the so-called RAS/mitogen-activated protein kinase (MAPK) signaling pathway, such as the tyrosine phosphatase Src homology 2 domain–containing phosphatase 2 (SHP2), the RAS exchange factor SOS, the kinase RAF1, and the GTP-binding protein RIT1.1-3 Half of the patients with NS carry heterozygous missense mutations in the PTPN11 gene encoding SHP2.4,5 Biochemical studies have revealed that NS-causing PTPN11 mutations result in a hyperactivation of SHP2 catalytic activity by disrupting the intramolecular autoinhibitory interaction between its catalytic and SH2 domains.5,6 Bleeding disorders of variable severity, ranging from easy bruising to more severe bleeding diathesis, are reported in 50% of NS patients, and major bleeding is seen in 3% of NS patients.7-11 The presence of PTPN11 mutations in NS patients has been significantly associated with easy bruising.12 Hemostatic abnormalities, including clotting factor deficiencies, von Willebrand factor (VWF) disease, and/or abnormal platelet count, have been reported in NS patients.7,13-16 However, these defects are not necessarily correlated with the bleeding phenotype of NS patients, and the reasons for increased bleeding risk remain incompletely understood. The clinically heterogeneous nature of this rare disorder and the implication of different genes and mutations at the origin of disease complicate interpretation of these correlative studies. Although 1 study reported that 83% of NS patients had reduced platelet aggregation in response to certain agonists,7 data on platelet activation from NS patients remain sparse. Moreover, whether platelet signaling defects contribute to the bleeding diathesis observed in NS patients with PTPN11 mutations is unknown.
SHP2 plays important roles downstream of many membrane receptors by dephosphorylating specific tyrosine residues, thereby regulating key intracellular signaling pathways, such as RAS/MAPK, phosphoinositide 3-kinase (PI3K)/AKT, and Src family kinases (SFKs). SHP2 has a pleiotropic role in organism development and cell homeostasis, as shown by the phenotype of total or tissue-specific knockout of the Ptpn11 gene.17-19 In platelets, SHP2 has been shown to negatively regulate immunoreceptor tyrosine-based activation motif (ITAM)–coupled receptor signaling via its recruitment by immunoreceptor tyrosine-based inhibitory motif (ITIM)–coupled receptors, such as PECAM-1, PIR-B, and G6b-B.20-22 Targeted deletion of SHP2 in the megakaryocyte/platelet lineage established that this tyrosine phosphatase is a negative regulator of CLEC-2– and αIIbβ3-mediated responses in platelets.23 In addition, SHP2 negatively regulates thrombus stability under pathological shear rate by acting downstream of thromboxane A2 (TXA2)/TP receptor and regulating the outside-in αIIbβ3 integrin signaling.24 To determine whether increased SHP2 activity may be responsible for a thrombopathy related to a signaling defect, we explored platelet responses in 10 NS patients carrying heterozygous PTPN11 mutations and in a well-characterized mouse model of NS expressing the heterozygous D61G mutation of the Ptpn11 gene (Ptpn11D61G/+).25
Another RASopathy clinically related to NS is NS with multiple lentigines (NSML), previously referred to as LEOPARD syndrome (according to the acronym: multiple Lentigines, ECG conduction abnormalities, Ocular hypertelorism, Pulmonic stenosis, Abnormal genitalia, Retardation of growth, and sensorineural Deafness).5,6 It is a rare developmental genetic disorder (1 per 100 000 live births) with characteristic features, including hearing deficits and multiple pigmented skin lesions called lentigines. A majority of patients with NSML (∼85%) exhibit heterozygous mutations in the PTPN11 gene. Despite the clinical overlap between the 2 syndromes, NSML-causing mutations result in reduced SHP2 catalytic activity.1,26 By using a previously characterized mouse model of NSML, heterozygous for the T468M mutation of the Ptpn11 gene (Ptpn11T468M/+)27 and blood from 3 NSML patients, we investigated the impact of decreased SHP2 activity on platelet responses and compared it with that of the NS platelet phenotype.
Our study provides novel insights into the understanding of the bleeding diathesis observed in SHP2-mutated NS patients and the platelet phenotype of NSML-related SHP2 loss-of-function mutations.
Methods
Human blood samples
Patient blood samples were obtained after informed consent, in accordance with the Declaration of Helsinki and with an agreement from the French National Ethical Committee (Comité de Protection des Personnes) for the constitution of the collection of clinical and biological data of patients with NS and NSML, which were used in this study (DC-2015-2450).
Animals
Ptpn11D61G/+ and Ptpn11T468M/+ mice have been described previously25,27 and were maintained in a B6 × 129Sv F1 hybrid background. Eight- to 14-week-old male mice were used for all experiments and housed in the US006-CREFRE/Anexplo (Toulouse, France) vivarium in accordance with institutional guidelines. Ptpn11D61G/+ or Ptpn11T468M/+ mice were compared with Ptpn11+/+ littermates, referred to as wild type (WT). Ethical approval for animal experiments was obtained from the French Ministry of Research, in agreement with European Union guidelines.
Preparation of murine washed platelets, human platelet–rich plasma sample preparation, and platelet surface glycoprotein expression are described in the supplemental Methods (available on the Blood Web site). Platelet light transmission aggregometry experiments were performed on human platelet–rich plasma isolated from citrated blood or on murine washed platelets at a concentration of 2 × 10⁸ platelets per mL. Platelet aggregation in response to different concentrations of various agonists (0.37-3.3 µg/mL of collagen, 0.5-1 µg/mL of collagen-related peptide [CRP], 5-10 µg/mL of CLEC-2 antibody, 0.1 µM of TXA2 analog U46619, 0.1 U/mL of thrombin, 5-10 µM of adenosine 5′-diphosphate [ADP], and 1.25 mg/mL of ristocetin) was monitored in siliconized glass cuvettes under continuous stirring (1000 revolutions min−1) at 37°C using a turbimetric method in an octochannel aggregometer (SD Medical, Frouard, France). Platelet aggregation was monitored over 10 minutes. The maximal aggregation percentage and the area under curve were analyzed using Thrombosoft 1.6 software (SD Medical). All experiments were performed within 2 hours after blood sampling.
Flow assay on collagen, platelet adhesion on immobilized VWF under flow conditions, αIIbβ3 integrin function assays, P-selectin exposure analysis, TXB2 production quantification, and platelet cytosol depletion were performed as described in the supplemental Methods. Tail bleeding time was measured as previously described,28 as was carotid artery thrombosis.28
Statistical analysis
Data are expressed as mean ± standard error of the mean (SEM). Significance of differences was determined by GraphPad software using the 2-tailed Student t test, 1-sample t test, 1-way analysis of variance (ANOVA) followed by Tukey posttest, or 2-way ANOVA followed by Bonferroni posttest. P < .05 was considered significant.
Results
NS mice carrying catalytic gain of function of SHP2 have defective platelet responses
To assess mechanisms by which NS-causing gain-of-function mutations of SHP2 influenced platelet activation and bleeding, we took advantage of a mouse model heterozygous for the D61G-mutant form of SHP2 (Ptpn11D61G/+, referred to as NS mice).25 These mice had a minor reduction in platelet count (<15%; Table 1). All other parameters, including platelet volume, surface receptor expression, and extrinsic (PR) or intrinsic (aPTT) coagulation pathways, were normal (Table 1). However, platelets from NS mice aggregated less well than those form WT mice in response to the GPVI-specific agonist CRP and collagen, as well as to low concentrations of an activating antibody to the hemi-ITAM receptor CLEC-2 (Figure 1A). Platelets from NS mice responded normally to higher concentrations of these agonists and to low concentrations of the G protein–coupled receptor agonist thrombin and the TXA2 analog U46619 (Figure 1B).
Ptpn11D61G/+ mouse characteristics
| Mean ± SEM | ||
|---|---|---|
| WT | Ptpn11D61G/+ | |
| Platelet count, ×109/L* | 647 ± 22 | 513 ± 29† |
| MPV, µm3* | 6.8 ± 0.3 | 6.2 ± 0.3 |
| Fibrinogen, g/L‡ | 1.9 ± 0.1 | 2.1 ± 0.1 |
| PR, %‡ | 133 ± 5 | 170 ± 10 |
| aPTT, s‡ | 27.8 ± 0.5 | 31.9 ± 2.7 |
| GPIb, MFI§ | 2569 ± 222 | 2954 ± 277 |
| GPIIb, MFI§ | 8749 ± 261 | 8312 ± 394 |
| CLEC-2, MFI§ | 5365 ± 258 | 6018 ± 463 |
| α2, MFI§ | 55 ± 7 | 44 ± 2 |
| GPVI, MFI§ | 1336 ± 62 | 1465 ± 78 |
aPTT, activated partial thromboplastin time; MFI, mean fluorescence intensity; MPV, mean platelet volume; PR, prothrombin ratio.
Whole-blood platelet count and MPV were measured by using a HORIBA ABX Micros 60 analyzer (n = 22 mice of each genotype).
P < .001 vs WT according to Student t test.
PR, aPTT ratio, and fibrinogen concentration were measured as described in “Methods” (n = 5 mice of each genotype).
Platelet surface expressions of GPIb, GPIIb, CLEC-2, α2, and GPVI were measured by flow cytometry using specific antibodies (n = 6 mice of each genotype).
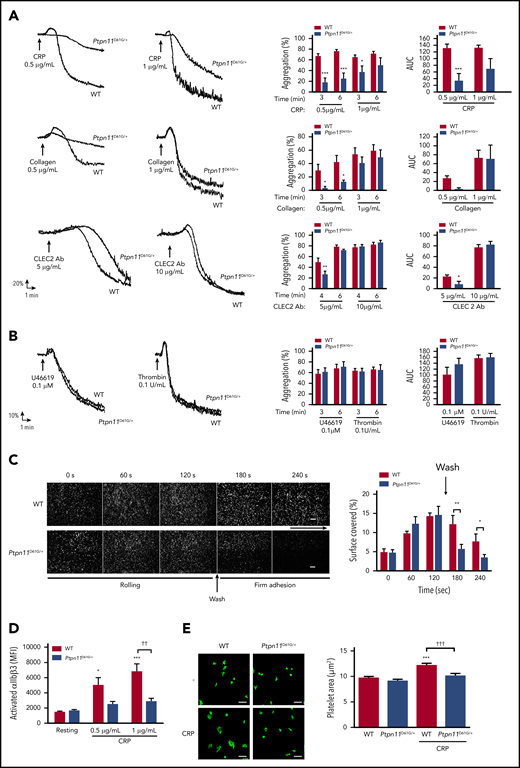
In vitro aggregation and integrin αIIbβ3 activation of platelets from Ptpn11D61G/+ mice.Ptpn11D61G/+ platelets were stimulated with CRP (0.5 and 1 μg/mL), collagen (0.5 and 1 μg/mL), or CLEC-2 antibody (Ab) (5 and 10 μg/mL) (A) or with TXA2 analog (U46619) (0.1 μM) or thrombin (0.1 U/mL) (B). Representative aggregation curves are shown. Percentage of maximal aggregation at different times and area under curve (AUC) were measured (mean ± SEM; n = 5). (C) Anticoagulated mice whole blood, where platelets were labeled with DiOC6, was perfused through Cellix Vena8 Fluoro+ biochips at arteriolar physiological shear rate of 1500 s−1 on VWF matrix over 2 minutes to analyze platelet rolling. Platelet firm adhesion was measured over 2 minutes after capillary wash. Platelet adhesion was visualized in real time by videomicroscopy (scale bar, 20 μm). Profiles shown are representative of 4 WT mice and 4 Ptpn11D61G/+ mice. Surface covered by platelets was quantified by using ImageJ software (mean ± SEM). (D) JON/A-phycoerythrin Ab binding to resting or stimulated platelets with CRP (0.5 and 1 μg/mL) was analyzed by flow cytometry. Graph represents mean ± SEM of mean fluorescence intensity (n = 6 mice of each genotype). (E) Washed platelets were allowed to spread on a fibrinogen-coated surface over 20 minutes in presence or not of CRP (1 µg/mL). Platelet surface was measured by using ImageJ software. Representative confocal images are shown (scale bar, 10 µm). Graph represents mean ± SEM (n = 30 platelets from 3 mice per genotype). *P < .05, **P < .01, ***P < .001 vs WT; ††P < .01 according to 2-way ANOVA; †††P < .001 according to 1-way ANOVA.
In vitro aggregation and integrin αIIbβ3 activation of platelets from Ptpn11D61G/+ mice.Ptpn11D61G/+ platelets were stimulated with CRP (0.5 and 1 μg/mL), collagen (0.5 and 1 μg/mL), or CLEC-2 antibody (Ab) (5 and 10 μg/mL) (A) or with TXA2 analog (U46619) (0.1 μM) or thrombin (0.1 U/mL) (B). Representative aggregation curves are shown. Percentage of maximal aggregation at different times and area under curve (AUC) were measured (mean ± SEM; n = 5). (C) Anticoagulated mice whole blood, where platelets were labeled with DiOC6, was perfused through Cellix Vena8 Fluoro+ biochips at arteriolar physiological shear rate of 1500 s−1 on VWF matrix over 2 minutes to analyze platelet rolling. Platelet firm adhesion was measured over 2 minutes after capillary wash. Platelet adhesion was visualized in real time by videomicroscopy (scale bar, 20 μm). Profiles shown are representative of 4 WT mice and 4 Ptpn11D61G/+ mice. Surface covered by platelets was quantified by using ImageJ software (mean ± SEM). (D) JON/A-phycoerythrin Ab binding to resting or stimulated platelets with CRP (0.5 and 1 μg/mL) was analyzed by flow cytometry. Graph represents mean ± SEM of mean fluorescence intensity (n = 6 mice of each genotype). (E) Washed platelets were allowed to spread on a fibrinogen-coated surface over 20 minutes in presence or not of CRP (1 µg/mL). Platelet surface was measured by using ImageJ software. Representative confocal images are shown (scale bar, 10 µm). Graph represents mean ± SEM (n = 30 platelets from 3 mice per genotype). *P < .05, **P < .01, ***P < .001 vs WT; ††P < .01 according to 2-way ANOVA; †††P < .001 according to 1-way ANOVA.
Thrombus formation is a multistep process that is also dependent on the GPIb-IX-V receptor for initial platelet rolling and on integrins α2β1 and αIIbβ3 for firm adhesion to collagen, VWF, and fibrinogen.29 To analyze the ability of NS platelets to roll and adhere on a VWF matrix, whole blood was perfused on this matrix at an arteriolar shear rate of 1500 s−1. Although platelets from NS mice exhibited normal rolling on the VWF matrix, firm adhesion to VWF was significantly reduced (Figure 1C), suggesting that the integrin αIIbβ3, essential for stable platelet adhesion to VWF,30 was not efficiently activated. To determine whether this was the case, we investigated JON/A binding to activated αIIbβ3 integrin after GPVI stimulation by flow cytometry and αIIbβ3-mediated platelet adhesion to a fibrinogen matrix. NS platelets displayed a significant decrease in the level of activated αIIbβ3 integrin on their surface in response to CRP (Figure 1D) compared with WT platelets, demonstrating that CRP-induced αIIbβ3 integrin inside-out signaling was defective in NS platelets. NS platelets spread to a similar extent to WT platelets on immobilized fibrinogen (mean platelet area, 9.7 ± 0.2 μm2 for WT vs 9.1 ± 0.2 μm2 for NS), suggesting normal outside-in signaling of the integrin αIIbβ3 (Figure 1E). However, enhanced spreading of WT platelets on fibrinogen after pretreatment with CRP was abrogated in NS platelets (mean platelet area, 12.3 ± 0.3 μm2 for WT vs 10.1 ± 0.4 μm2 for NS; (Figure 1E), providing further evidence of defective αIIbβ3 inside-out signaling in NS platelets.
Platelet secretion and TXA2 generation are key regulators for the recruitment of circulating platelets on the forming thrombus.31 The analysis of P-selectin exposure at the NS platelet surface showed a strong inhibition of platelet secretion after GPVI stimulation with CRP (Figure 2A). In addition, TXB2 production, which is a reflection of TXA2 generation, was significantly reduced in CRP-stimulated NS platelets (Figure 2B).
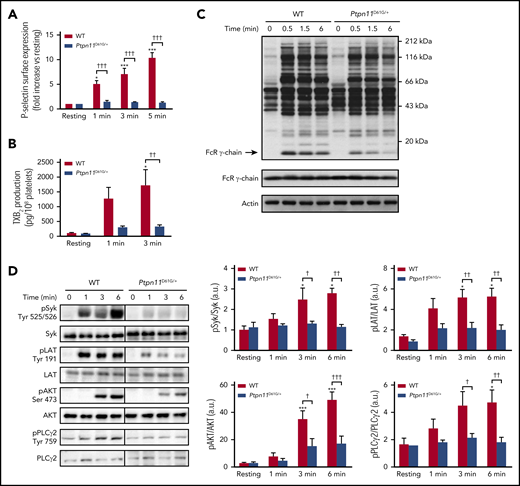
Platelet secretion and signaling under GPVI stimulation in Ptpn11D61G/+ mice. (A) P-selectin surface expression in resting platelets or after CRP (1 μg/mL) stimulation was analyzed by flow cytometry. Graph represents mean ± SEM of mean fluorescence intensity fold increase when comparing with resting condition (n = 4 mice of each genotype). (B) TXA2 production in resting or CRP-stimulated (1 μg/mL) platelets was analyzed by mass spectrometry by quantifying the production of its stable derivative, TXB2. Graph represents mean ± SEM (n = 4 mice of each genotype). (C) Ptpn11D61G/+ platelets were stimulated with CRP (3 μg/mL) at 37°C in nonaggregating conditions over 0.5, 1.5, and 6 minutes. Platelet lysates were analyzed by western blotting using an antiphosphotyrosine (clone 4G10) antibody (Ab). FcRγ chain and actin were used as loading controls. Representative western blots of 3 independent experiments are shown. (D) Ptpn11D61G/+ platelets were stimulated with CRP (1 μg/mL) at 37°C in nonaggregating conditions over 1, 3, and 6 minutes. Platelet lysates were analyzed by western blotting using specific Abs: phosphorylated Syk (pSyk) (Tyr525/526), pLAT (Tyr191), pAKT (Ser473), and pPLCγ2 (Tyr759). Syk, LAT, AKT, and PLCγ2 proteins were used as loading controls. Representative western blots are shown, and quantifications are represented as mean ± SEM (n = 5 mice of each genotype). *P < .05, ***P < .001 vs WT; †P < .05, ††P < .01, †††P < .001 according to 2-way ANOVA.
Platelet secretion and signaling under GPVI stimulation in Ptpn11D61G/+ mice. (A) P-selectin surface expression in resting platelets or after CRP (1 μg/mL) stimulation was analyzed by flow cytometry. Graph represents mean ± SEM of mean fluorescence intensity fold increase when comparing with resting condition (n = 4 mice of each genotype). (B) TXA2 production in resting or CRP-stimulated (1 μg/mL) platelets was analyzed by mass spectrometry by quantifying the production of its stable derivative, TXB2. Graph represents mean ± SEM (n = 4 mice of each genotype). (C) Ptpn11D61G/+ platelets were stimulated with CRP (3 μg/mL) at 37°C in nonaggregating conditions over 0.5, 1.5, and 6 minutes. Platelet lysates were analyzed by western blotting using an antiphosphotyrosine (clone 4G10) antibody (Ab). FcRγ chain and actin were used as loading controls. Representative western blots of 3 independent experiments are shown. (D) Ptpn11D61G/+ platelets were stimulated with CRP (1 μg/mL) at 37°C in nonaggregating conditions over 1, 3, and 6 minutes. Platelet lysates were analyzed by western blotting using specific Abs: phosphorylated Syk (pSyk) (Tyr525/526), pLAT (Tyr191), pAKT (Ser473), and pPLCγ2 (Tyr759). Syk, LAT, AKT, and PLCγ2 proteins were used as loading controls. Representative western blots are shown, and quantifications are represented as mean ± SEM (n = 5 mice of each genotype). *P < .05, ***P < .001 vs WT; †P < .05, ††P < .01, †††P < .001 according to 2-way ANOVA.
We next investigated the molecular mechanisms underlying the functional defects of NS platelets expressing hyperactive SHP2 in response to CRP. We measured the total level of tyrosine phosphorylation in whole-cell lysates of WT and NS platelets and the phosphorylation of key signaling proteins involved in the GPVI signaling cascade, namely FcRγ chain, spleen tyrosine kinase (Syk), LAT, AKT, and phospholipase C-γ2 (PLCγ2).32 We found that the basal level of tyrosine phosphorylation was comparable between WT and NS platelets. However, NS platelets exhibited a significant decrease in the intensity of tyrosine phosphorylation of several proteins compared with WT platelets after CRP stimulation (Figure 2C). One of these proteins migrated at the expected molecular weight of the FcRγ chain. SFKs are known to phosphorylate the tandem tyrosine residues in the ITAM-containing FcRγ chain associated with GPVI, leading to the binding of the SH2 domains of Syk and in turn its activation, which can be indirectly measured by monitoring the autophosphorylation of tyrosine residues 525 and 526. Activated Syk phosphorylates tyrosine residues with the transmembrane adaptor protein LAT, nucleating formation of the LAT signalosome, which includes PI3K and PLCγ2.32 As expected, CRP-stimulated WT platelets contained increased Syk activity. In contrast, Syk was marginally activated in NS platelets (Figure 2D). Furthermore, the phosphorylation and activation of downstream effectors of Syk were also weakly activated in CRP-stimulated NS platelets. This was also the case for tyrosine phosphorylation of LAT, AKT (a major effector of PI3K), and PLCγ2 (Figure 2D). Reduced SHP2 was detected at the plasma membrane/cytoskeleton compartment of NS platelets after CRP stimulation compared with WT platelets (supplemental Figure 1), strongly suggesting that a gain-of-function mutation of SHP2 alters the formation of SHP2-containing tyrosine phosphorylation–dependent signaling complexes at the membrane/cytoskeleton interface after platelet stimulation. Collectively, these data support the hypothesis that defective GPVI proximal signaling is the cause of the reduction of NS platelet activation by CRP.
When anticoagulated whole blood from WT and NS mice was perfused over a collagen surface under a physiological arterial wall shear rate, NS platelets were able to adhere to collagen fibers and form thrombi, but to a lesser extent compared with WT platelets. The significant reduction in surface coverage by NS platelets was associated with a threefold decrease in thrombus volume compared with WT platelets after 2 minutes of perfusion (Figure 3A). This correlated with a significant reduction in thrombus formation in NS mice after ferric chloride–induced injury of the carotid artery, with >50% of NS mice being protected against the formation of an occlusive thrombus and unable to occlude the carotid within 35 minutes compared with WT mice, which formed an occlusive thrombus within 20 minutes (Figure 3B). To assess if the thrombosis defect in NS mice was associated with a bleeding diathesis, we performed a tail bleeding time assay. We observed that although some NS mice exhibited a normal bleeding time, a majority of these mice displayed a significant increase in bleeding, because they were not able to stop bleeding 15 minutes after tail injury (Figure 3C), and local compression was needed to stop the bleeding. These results indicate that hyperactive SHP2 associated with NS in mice recapitulates the bleeding syndrome observed in PTPN11-mutated NS patients. Taken together, these findings demonstrate reduced platelet thrombotic capacity associated with increased tail bleeding time in a majority of NS mice harboring the D61G gain-of-function mutation.

Ex vivo and in vivo thrombus formation in Ptpn11D61G/+ mice. (A) Mouse heparinized whole blood, where platelets were labeled with DiOC6, was perfused through Cellix Vena8 Fluoro+ biochips at arterial physiological shear rate of 500 s−1 on fibrillar collagen matrix over 2 minutes. Thrombus formation was visualized in real time by videomicroscopy. Representative 2- and 3-dimensional images were respectively obtained after processing with ImageJ and Imaris software (scale bar, 20 μm). Surface covered by platelets and thrombus volume were quantified by using ImageJ software (mean ± sSEM; n = 4 mice of each genotype). (B) Time to blood flow cessation was measured with a transonic flow probe at the carotid artery of mice after exposure to 7% FeCl3 for 3 minutes. Graph represents the percentage of mice displaying no carotid occlusion. (C) Time required for the bleeding to stop after 3-mm tail-tip transection of anesthetized mice. Each point represents a mouse. *P < .05 vs WT according to 2-way ANOVA and 1-sample t test.
Ex vivo and in vivo thrombus formation in Ptpn11D61G/+ mice. (A) Mouse heparinized whole blood, where platelets were labeled with DiOC6, was perfused through Cellix Vena8 Fluoro+ biochips at arterial physiological shear rate of 500 s−1 on fibrillar collagen matrix over 2 minutes. Thrombus formation was visualized in real time by videomicroscopy. Representative 2- and 3-dimensional images were respectively obtained after processing with ImageJ and Imaris software (scale bar, 20 μm). Surface covered by platelets and thrombus volume were quantified by using ImageJ software (mean ± sSEM; n = 4 mice of each genotype). (B) Time to blood flow cessation was measured with a transonic flow probe at the carotid artery of mice after exposure to 7% FeCl3 for 3 minutes. Graph represents the percentage of mice displaying no carotid occlusion. (C) Time required for the bleeding to stop after 3-mm tail-tip transection of anesthetized mice. Each point represents a mouse. *P < .05 vs WT according to 2-way ANOVA and 1-sample t test.
NS patients carrying catalytic gain of function of SHP2 display hemostasis defects
We had the opportunity to characterize bleeding disorders in a cohort of 10 young NS patients (age 11.0 ± 4.8 years) with different PTPN11 mutations responsible for a catalytic gain of function of SHP2. All patients displayed easy cutaneous bruising and mucosal bleeding, with a Tosetto bleeding score33 ranging from normal (1) to high (6; Table 2). No significant defect was observed in platelet number, platelet volume, aPTT, PR, plasma fibrinogen concentration, or VWF activity or antigen levels (Table 3). NS platelets exhibited reduced aggregating capacity in response to low concentration of collagen, which was overcome in 50% of the patients when higher concentrations of collagen were used (Figure 4A). ADP-induced platelet aggregation and platelet agglutination induced by ristocetin were comparable to those of healthy controls (supplemental Figure 2). The thrombotic capacity of NS platelets was also evaluated by perfusing whole blood from NS patients over a collagen surface and analyzing platelet thrombus formation and growth at a physiological arterial wall shear rate. As shown in Figure 4B, thrombus growth in blood from NS patients was significantly affected, with the formation of very small thrombi 3 minutes postperfusion. These data show that NS patients carrying catalytic hyperactive SHP2 display reduced platelet aggregation after collagen stimulation, with significantly affected thrombus growth.
Genetics and Tosetto bleeding scores of NS and NSML patients
| Patient | Gene | Exon | Mutation on DNA | Mutation on protein | Cutaneous bruising/mucosal bleeding | Tosetto bleeding score |
|---|---|---|---|---|---|---|
| NS 1 | PTPN11 | 8 | c.922 A>G | p.Asn308Asp | Yes | 1 |
| NS 2 | PTPN11 | 3 | c.215 C>G | p.Ala72Gly | Yes | 6 |
| NS 3 | PTPN11 | 13 | c.1510 A>G | p.Met504Val | Yes | 2 |
| NS 4 | PTPN11 | 4 | c.417 G>C | p.Glu139Asp | Yes | 3 |
| NS 5 | PTPN11 | 4 | c.417 G>C | p.Glu139Asp | Yes | 6 |
| NS 6 | PTPN11 | 6 | c.767 A>G | p.Gln256Arg | Yes | 1 |
| NS 7 | PTPN11 | 6 | c.767 A>G | p.Gln256Arg | Yes | 2 |
| NS 8 | PTPN11 | 8 | c.922 A>G | p.Asn308Asp | Yes | 5 |
| NS 9 | PTPN11 | 3 | c.184 T>G | p.Tyr62Asp | Yes | 3 |
| NS 10 | PTPN11 | 6 | c.767 A>G | p.Gln256Arg | Yes | 3 |
| NSML 1 | PTPN11 | 7 | c.836 A>G | p.Tyr279Cys | Yes | 7 |
| NSML 2 | PTPN11 | 12 | c.1043 C>T | p.Thr468Met | No | 1 |
| NSML 3 | PTPN11 | 12 | c.1043 C>T | p.Thr468Met | No | 2 |
Measurements of whole blood platelet count, MPV, PR, aPTT, fibrinogen concentration, and VWF activity and antigen
| Mean ± SEM | Healthy controls, range | ||
|---|---|---|---|
| NS patients (n = 10) | NSML patients (n = 3) | ||
| Platelet count, ×109/L* | 231 ± 32 | 282 ± 44 | 150-450 |
| MPV, fL* | 10.2 ± 0.3 | 10.5 ± 1.0 | 8.5-12 |
| PR, %† | 81.3 ± 2.7 | 92.3 ± 3.9 | 70-100 |
| aPTT ratio† | 1.3 ± 0.1 | 1.1 ± 0.1 | <1.2 |
| Fibrinogen, g/L† | 2.8 ± 0.2 | 3.0 ± 0.5 | 2.0-4.0 |
| VWF activity, %† | 76.5 ± 6.8 | 73.3 ± 16.9 | 50-160 |
| VWF antigen, %† | 86.2 ± 9.6 | 84.3 ± 13.7 | 50-120 |
Data shown for 10 NS patients and 3 NSML patients, with range of raw values for healthy controls.
MPV, mean platelet volume.
Whole-blood platelet count and MPV were measured by using a HORIBA ABX Micros 60 analyzer (n = 22 mice of each genotype).
PR, aPTT ratio, fibrinogen concentration and VWF parameters were measured as described in “Methods.”
![In vitro aggregation and ex vivo thrombus formation of platelets from NS patients. (A) Platelets from healthy controls and NS patients were stimulated with different doses of collagen. Representative aggregation curves are shown. Graph represents the percentage of maximal aggregation (mean ± SEM; n ≥ 5 healthy controls and n ≥ 6 NS patients [patients 1 to 10; Table 2]). (B) Anticoagulated whole blood from healthy controls or NS patients, where platelets were labeled with DiOC6, was perfused through Cellix Vena8 Fluoro+ biochips at arterial physiological shear rate of 500 s−1 on fibrillar collagen matrix over 3 minutes. Thrombus formation was visualized in real time by videomicroscopy. Profiles shown are representative of 4 healthy controls and 4 NS patients (patients 5 to 8; Table 2). Two- and 3-dimensional images were respectively obtained after processing with ImageJ and Imaris software (scale bar, 20 μm). Surface covered by platelets and thrombus volume were quantified by using ImageJ software (mean ± SEM). *P < .05, **P < .01, ***P < .001 vs healthy controls according to 2-way ANOVA and 1-sample t test.](https://ash.silverchair-cdn.com/ash/content_public/journal/blood/134/25/10.1182_blood.2019001543/9/m_bloodbld2019001543f4.png?Expires=1765892664&Signature=Ps1KextEcHhmEu~B87~kOCQld814PBsmz6LoH1mmVD2PtRiFPjhsMG9CjYGcg1A4Cwa3bjWdMV~p5YMb8uqH0MymSbxIuiYAsGvIk5LwdMinI~c1y4e~q5cc-CGRlbYVPbDDnH4i4a6NRJG2QSQLTPzIXsw3nXxJohKMDQbmieEvphm~KEQrMryP3eLqkRka9lPH7jV12kZ-ba7XbtODWLU1a8WXH3nogT4DJ9GwYHOj0sfarNjyaWjKlp3ukaB~sKlV5v01CrhpZxEa6KVtXzQRqxAgDlaPBNyAWdDAACe4RzuH65035CSMXViBmL6KOxl4hAYnaHP6Mfg0NfIFKA__&Key-Pair-Id=APKAIE5G5CRDK6RD3PGA)
In vitro aggregation and ex vivo thrombus formation of platelets from NS patients. (A) Platelets from healthy controls and NS patients were stimulated with different doses of collagen. Representative aggregation curves are shown. Graph represents the percentage of maximal aggregation (mean ± SEM; n ≥ 5 healthy controls and n ≥ 6 NS patients [patients 1 to 10; Table 2]). (B) Anticoagulated whole blood from healthy controls or NS patients, where platelets were labeled with DiOC6, was perfused through Cellix Vena8 Fluoro+ biochips at arterial physiological shear rate of 500 s−1 on fibrillar collagen matrix over 3 minutes. Thrombus formation was visualized in real time by videomicroscopy. Profiles shown are representative of 4 healthy controls and 4 NS patients (patients 5 to 8; Table 2). Two- and 3-dimensional images were respectively obtained after processing with ImageJ and Imaris software (scale bar, 20 μm). Surface covered by platelets and thrombus volume were quantified by using ImageJ software (mean ± SEM). *P < .05, **P < .01, ***P < .001 vs healthy controls according to 2-way ANOVA and 1-sample t test.
In vitro aggregation and ex vivo thrombus formation of platelets from NS patients. (A) Platelets from healthy controls and NS patients were stimulated with different doses of collagen. Representative aggregation curves are shown. Graph represents the percentage of maximal aggregation (mean ± SEM; n ≥ 5 healthy controls and n ≥ 6 NS patients [patients 1 to 10; Table 2]). (B) Anticoagulated whole blood from healthy controls or NS patients, where platelets were labeled with DiOC6, was perfused through Cellix Vena8 Fluoro+ biochips at arterial physiological shear rate of 500 s−1 on fibrillar collagen matrix over 3 minutes. Thrombus formation was visualized in real time by videomicroscopy. Profiles shown are representative of 4 healthy controls and 4 NS patients (patients 5 to 8; Table 2). Two- and 3-dimensional images were respectively obtained after processing with ImageJ and Imaris software (scale bar, 20 μm). Surface covered by platelets and thrombus volume were quantified by using ImageJ software (mean ± SEM). *P < .05, **P < .01, ***P < .001 vs healthy controls according to 2-way ANOVA and 1-sample t test.
NSML-associated SHP2 loss of function results in increased platelet activation
In comparison with NS-causing SHP2 gain of function, we analyzed the activation of platelets displaying catalytic loss of function of SHP2. We used a mouse model carrying the heterozygous T468M mutation of Ptpn11 (Ptpn11T468M/+), referred to as NSML mice. This mouse model recapitulates features of NSML patients, in particular growth retardation, craniofacial abnormalities, and cardiomyopathy.27 Platelet count and volume, surface protein expression, PR, and aPTT were normal in NSML mice (Table 4).
Ptpn11T468M/+ mouse characteristics
| Mean ± SEM | ||
|---|---|---|
| WT | Ptpn11T468M/+ | |
| Platelet count, ×109/L* | 707 ± 22 | 638 ± 24† |
| MPV, µm3* | 7.4 ± 0.3 | 6.7 ± 0.3 |
| Fibrinogen, g/L‡ | 1.1 ± 0.1 | 1.1 ± 0.1 |
| PR, %‡ | 140 ± 10 | 142 ± 7 |
| aPTT, s‡ | 34.3 ± 2.4 | 39.0 ± 1.0 |
| GPIb, MFI§ | 7242 ± 273 | 8422 ± 1057 |
| GPIIb, MFI§ | 9335 ± 427 | 9230 ± 212 |
| CLEC-2, MFI§ | 4693 ± 528 | 5782 ± 1085 |
| α2, MFI§ | 51 ± 6 | 49 ± 4 |
| GPVI, MFI§ | 1743 ± 93 | 1552 ± 78 |
MFI, mean fluorescence intensity; MPV, mean platelet volume.
Whole-blood platelet count and MPV were measured by using a HORIBA ABX Micros 60 analyzer (n = 22 mice of each genotype).
P < .001 vs WT according to Student t test.
PR, aPTT, ratio, and fibrinogen concentration were measured as described in “Methods” (n = 5 mice of each genotype).
Platelet surface expressions of GPIb, GPIIb, CLEC-2, αII, and GPVI were measured by flow cytometry using specific antibodies (n = 6 mice of each genotype).
We investigated washed platelet aggregation induced by ITAM and hemi-ITAM receptor agonists (CRP, collagen, and CLEC-2 antibody) and GPCR agonists (thrombin and U46619). Although the aggregation responses to thrombin and U46619 were comparable in WT and NSML platelets, we observed an increased rate of aggregation of NSML platelets at low concentrations of CRP, collagen, and CLEC-2 antibody (Figure 5A). NSML platelet secretion assessed by P-selectin surface expression and TXA2 generation after CRP stimulation were significantly increased compared with WT platelets (Figure 5B-5C). Whereas rolling and firm adhesion to VWF were normal (supplemental Figure 3A), we observed an increase in CRP-mediated αIIbβ3 integrin inside-out activation in NSML platelets (Figure 5D). In addition, the adhesion of platelets to fibrinogen was transiently increased when NSML platelets were pretreated with CRP (supplemental Figure 3B), confirming a rapid increase of αIIbβ3 integrin inside-out signaling in NSML platelets. These findings suggest that SHP2 loss of function enhances platelet activation in response to ITAM and hemi-ITAM–mediated platelet activation.

In vitro platelet activation under GPVI stimulation in Ptpn11T468M/+ mouse platelets. (A) Ptpn11T468M/+ platelets were stimulated with CRP (0.5 and 1 μg/mL), collagen (0.5 and 1 μg/mL), CLEC-2 antibody (Ab) (5 and 10 μg/mL), TXA2 analog (U46619) (0.1 μM), or thrombin (0.1 U/mL). Representative aggregation curves of 5 mice of each genotype are shown. Graphs represent the percentage of maximal aggregation at different times and area under curve (AUC) (mean ± SEM). (B) P-selectin surface expression in resting platelets or after CRP (1 μg/mL) stimulation was analyzed by flow cytometry. Graph represents mean ± SEM of the mean fluorescence intensity (MFI) fold increase when comparing with resting condition (n = 3 mice of each genotype). (C) TXA2 production in resting or CRP-stimulated (1 μg/mL) platelets was analyzed by mass spectrometry by quantifying the production of its stable derivative, TXB2. Graph represents mean ± SEM (n = 4 mice of each genotype). (D) JON/A-phycoerythrin Ab binding to resting or stimulated platelets with CRP (1 μg/mL) was analyzed by cytometry. Graph represents mean ± SEM of MFI. (E) Ptpn11T468M/+ platelets were stimulated with CRP (1 μg/mL) at 37°C in nonaggregating conditions over 1, 3, and 6 minutes. Platelet lysates were analyzed by western blotting using specific Abs: phosphorylated Syk (pSyk) (Tyr525/526), pLAT (Tyr191), pAKT (Ser473), and pPLCγ2 (Tyr759). Syk, LAT, AKT, and PLCγ2 proteins were used as loading controls. Representative western blots are shown, and quantifications are represented as mean ± SEM (n = 8 mice of each genotype). *P < .05, **P < .01, ***P < .001 vs WT or WT resting according to 2-way ANOVA; †P < .05 according to 2-way ANOVA; ‡P < .05, ‡‡P < .01, ‡‡‡P < .001 vs Ptpn11T468M/+ resting according to 2-way ANOVA.
In vitro platelet activation under GPVI stimulation in Ptpn11T468M/+ mouse platelets. (A) Ptpn11T468M/+ platelets were stimulated with CRP (0.5 and 1 μg/mL), collagen (0.5 and 1 μg/mL), CLEC-2 antibody (Ab) (5 and 10 μg/mL), TXA2 analog (U46619) (0.1 μM), or thrombin (0.1 U/mL). Representative aggregation curves of 5 mice of each genotype are shown. Graphs represent the percentage of maximal aggregation at different times and area under curve (AUC) (mean ± SEM). (B) P-selectin surface expression in resting platelets or after CRP (1 μg/mL) stimulation was analyzed by flow cytometry. Graph represents mean ± SEM of the mean fluorescence intensity (MFI) fold increase when comparing with resting condition (n = 3 mice of each genotype). (C) TXA2 production in resting or CRP-stimulated (1 μg/mL) platelets was analyzed by mass spectrometry by quantifying the production of its stable derivative, TXB2. Graph represents mean ± SEM (n = 4 mice of each genotype). (D) JON/A-phycoerythrin Ab binding to resting or stimulated platelets with CRP (1 μg/mL) was analyzed by cytometry. Graph represents mean ± SEM of MFI. (E) Ptpn11T468M/+ platelets were stimulated with CRP (1 μg/mL) at 37°C in nonaggregating conditions over 1, 3, and 6 minutes. Platelet lysates were analyzed by western blotting using specific Abs: phosphorylated Syk (pSyk) (Tyr525/526), pLAT (Tyr191), pAKT (Ser473), and pPLCγ2 (Tyr759). Syk, LAT, AKT, and PLCγ2 proteins were used as loading controls. Representative western blots are shown, and quantifications are represented as mean ± SEM (n = 8 mice of each genotype). *P < .05, **P < .01, ***P < .001 vs WT or WT resting according to 2-way ANOVA; †P < .05 according to 2-way ANOVA; ‡P < .05, ‡‡P < .01, ‡‡‡P < .001 vs Ptpn11T468M/+ resting according to 2-way ANOVA.
When the phosphorylation state of key signaling proteins involved in the GPVI pathway was investigated by western blotting using specific phosphoantibodies, we observed increased phosphorylation for Syk, LAT, AKT, and PLCγ2 3 minutes after CRP stimulation in NSML platelets. This increase in GPVI signaling was not observed at longer time points (6 minutes), except for PLCγ2 (Figure 5E). This transient increase of GPVI signaling was not accompanied by a modification of the compartmentalization of SHP2 to the plasma membrane/cytoskeleton in resting or CRP-stimulated NSML platelets (supplemental Figure 1).
We further checked if the increased GPVI response of NSML mouse platelets had consequences for thrombus formation on a collagen surface after whole-blood perfusion under shear stress. Intriguingly, adhesion and thrombus growth of NSML platelets were enhanced twofold compared with WT platelets when shear stress was increased from an arterial shear stress of 250 to 500 s−1 (Figure 6A). These findings demonstrate that loss of SHP2 catalytic activity amplifies the platelet response to collagen in a shear stress–dependent manner. Inhibiting the effect of secretion and TXA2 generation in platelets by treating platelets with ARC69931MX and indomethacin counteracted this response of NSML platelets (Figure 6B). However, NSML mice had a normal occlusion time after ferric chloride–induced carotid injury (Figure 6C) and a normal tail bleeding time (Figure 6D).
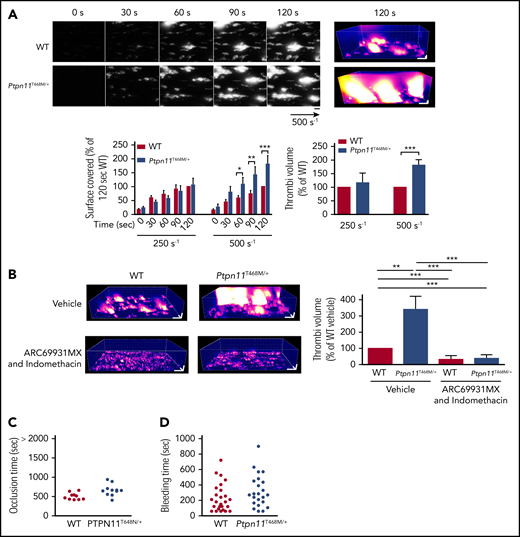
Ex vivo and in vivo thrombus formation in Ptpn11T468M/+ mice. (A) Heparinized whole blood from Ptpn11T468M/+ mice, where platelets were labeled with DiOC6, was perfused through Cellix Vena8 Fluoro+ biochips at arterial physiological shear rates of 250 s−1 and 500 s−1 on fibrillar collagen matrix during 2 minutes. Thrombus formation was visualized in real time by videomicroscopy. Representative 2- and 3-dimensional images were respectively obtained after processing with ImageJ and Imaris software (scale bar, 20 μm). Surface covered by platelets and thrombus volume were quantified by using ImageJ software (mean ± SEM; n = 6 mice of each genotype). (B) Heparinized whole blood from Ptpn11T468M/+ mice was treated or not with ARC69931MX (10 μM) and indomethacin (10 μM) over 30 minutes; platelets were labeled with DiOC6 and perfused through Cellix Vena8 Fluoro+ biochips at arterial physiological shear rate of 500 s−1 on fibrillar collagen matrix over 2 minutes. Representative 3-dimensional images were obtained after processing with Imaris software (scale bar, 20 μm) at 2 minutes of perfusion. At the end of the perfusion, thrombus volume was quantified by using ImageJ software (mean ± SEM; n = 6 mice of each genotype). (C) Time to blood flow cessation (occlusion time) was measured with a transonic flow probe at the carotid artery of mice after exposure to 7% FeCl3 for 3 minutes. Each point represents a mouse. (D) Time required for the bleeding to stop after 3-mm tail-tip transection of anesthetized mice. Each point represents a mouse. *P < .05, **P < .01, ***P < .001 according to 2-way ANOVA and 1-sample t test.
Ex vivo and in vivo thrombus formation in Ptpn11T468M/+ mice. (A) Heparinized whole blood from Ptpn11T468M/+ mice, where platelets were labeled with DiOC6, was perfused through Cellix Vena8 Fluoro+ biochips at arterial physiological shear rates of 250 s−1 and 500 s−1 on fibrillar collagen matrix during 2 minutes. Thrombus formation was visualized in real time by videomicroscopy. Representative 2- and 3-dimensional images were respectively obtained after processing with ImageJ and Imaris software (scale bar, 20 μm). Surface covered by platelets and thrombus volume were quantified by using ImageJ software (mean ± SEM; n = 6 mice of each genotype). (B) Heparinized whole blood from Ptpn11T468M/+ mice was treated or not with ARC69931MX (10 μM) and indomethacin (10 μM) over 30 minutes; platelets were labeled with DiOC6 and perfused through Cellix Vena8 Fluoro+ biochips at arterial physiological shear rate of 500 s−1 on fibrillar collagen matrix over 2 minutes. Representative 3-dimensional images were obtained after processing with Imaris software (scale bar, 20 μm) at 2 minutes of perfusion. At the end of the perfusion, thrombus volume was quantified by using ImageJ software (mean ± SEM; n = 6 mice of each genotype). (C) Time to blood flow cessation (occlusion time) was measured with a transonic flow probe at the carotid artery of mice after exposure to 7% FeCl3 for 3 minutes. Each point represents a mouse. (D) Time required for the bleeding to stop after 3-mm tail-tip transection of anesthetized mice. Each point represents a mouse. *P < .05, **P < .01, ***P < .001 according to 2-way ANOVA and 1-sample t test.
NSML patients carrying SHP2 catalytic loss-of-function mutations display a shear-dependent increase in platelet response
Characterization of platelet function is lacking in patients with NSML. We had the opportunity to study hemostasis and thrombosis parameters in 3 NSML patients (patient 1, age 16 years; patient 2, age 12 years; and patient 3, age 35 years). Of note, patients 2 and 3 carried the same mutation as the mouse model (T468M PTPN11 mutation; Table 2). Although neither bleeding nor thrombotic disorders had been reported in NSML patient 2 or 3, patient 1 displayed cutaneous bruising and mucosal bleeding, with a high Tosetto bleeding score33 (Table 2). All 3 NSML patients had normal platelet count and volume, aPTT, PR, and VWF activity (Table 3). We observed that platelets from the 3 NSML patients displayed normal aggregation in response to different concentrations of collagen (Figure 7A) and ADP (supplemental Figure 4). Ristocetin-mediated agglutination was also comparable to that in healthy donors (supplemental Figure 4). When whole blood from the NSML patients was perfused over a collagen surface at a physiological arterial shear rate, we observed normal platelet surface coverage and thrombus volume. However, increasing the shear rate to an arteriolar rate or that observed in pathological stenosis (3000 s−1) increased the adherence of NSML platelets to the collagen fibers and the thrombus growth by two- to threefold (Figure 7B). Collectively, these findings demonstrate that NSML platelets with SHP2 loss of function exhibit a shear rate–dependent increased platelet response to collagen.
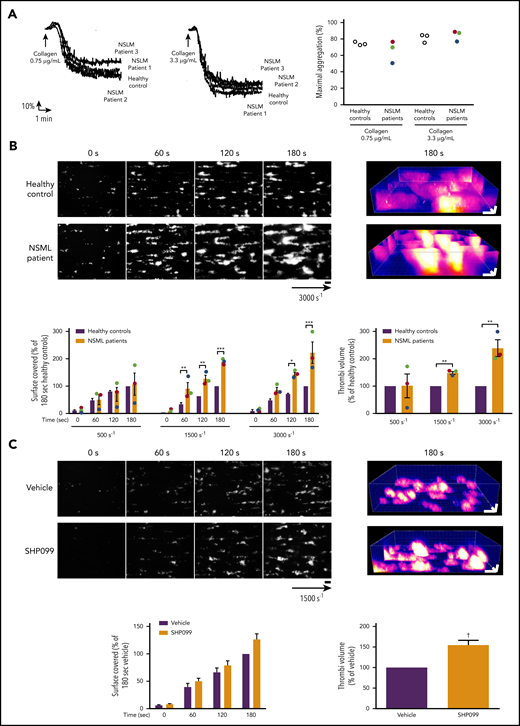
In vitro aggregation of platelet from NSML patients and ex vivo thrombus formation of blood from NSML patients or treated with SHP2 inhibitor. (A) Platelets from healthy controls and NSML patients were stimulated with collagen (0.75 and 3.3 µg/mL). Platelet aggregation curves of a representative healthy control and from each of the 3 NSML patients are shown. Graph represents the percentage of maximal aggregation of 3 healthy controls and 3 NSML patients. Each point corresponds to an individual. Patient 1 is represented in green, patient 2 in red, and patient 3 in blue. (B) Anticoagulated human whole blood, where platelets were labeled with DiOC6, was perfused through Cellix Vena8 Fluoro+ biochips at different shear rates on fibrillar collagen matrix over 3 minutes. Thrombus formation was visualized in real time by videomicroscopy. Shown are representative 2- and 3-dimensional images of NSML patient 2 blood perfusion at a stenosis shear rate of 3000 s−1 obtained after processing with ImageJ and Imaris software, respectively (scale bar, 20 μm). Surface covered by platelets and thrombus volume were quantified at different shear rates (500, 1500, and 3000 s−1) by using ImageJ software. Graphs represent mean ± SEM for 3 healthy controls and 3 NSML patients. For NSML patients, each point corresponds to an individual (patient 1 is represented in green, patient 2 in red, and patient 3 in blue). (C) Anticoagulated human whole blood treated with SHP099 (10 μM) or its vehicle, dimethyl sulfoxide, for 2 hours and labeled with DiOC6 was perfused through Cellix Vena8 Fluoro+ biochips at 1500s−1 on fibrillar collagen matrix over 3 minutes. Thrombus formation was visualized in real time by videomicroscopy. Shown are representative 2- and 3-dimensional images of blood from 7 healthy donors. Surface covered by platelets and thrombus volume were quantified by using ImageJ software. Graphs represent mean ± SEM for 7 healthy donors. *P < .05, **P < .01, ***P < .001 vs healthy controls according to 2-way ANOVA and 1-sample t test. †P < .001 vs vehicle according to 1-sample t test.
In vitro aggregation of platelet from NSML patients and ex vivo thrombus formation of blood from NSML patients or treated with SHP2 inhibitor. (A) Platelets from healthy controls and NSML patients were stimulated with collagen (0.75 and 3.3 µg/mL). Platelet aggregation curves of a representative healthy control and from each of the 3 NSML patients are shown. Graph represents the percentage of maximal aggregation of 3 healthy controls and 3 NSML patients. Each point corresponds to an individual. Patient 1 is represented in green, patient 2 in red, and patient 3 in blue. (B) Anticoagulated human whole blood, where platelets were labeled with DiOC6, was perfused through Cellix Vena8 Fluoro+ biochips at different shear rates on fibrillar collagen matrix over 3 minutes. Thrombus formation was visualized in real time by videomicroscopy. Shown are representative 2- and 3-dimensional images of NSML patient 2 blood perfusion at a stenosis shear rate of 3000 s−1 obtained after processing with ImageJ and Imaris software, respectively (scale bar, 20 μm). Surface covered by platelets and thrombus volume were quantified at different shear rates (500, 1500, and 3000 s−1) by using ImageJ software. Graphs represent mean ± SEM for 3 healthy controls and 3 NSML patients. For NSML patients, each point corresponds to an individual (patient 1 is represented in green, patient 2 in red, and patient 3 in blue). (C) Anticoagulated human whole blood treated with SHP099 (10 μM) or its vehicle, dimethyl sulfoxide, for 2 hours and labeled with DiOC6 was perfused through Cellix Vena8 Fluoro+ biochips at 1500s−1 on fibrillar collagen matrix over 3 minutes. Thrombus formation was visualized in real time by videomicroscopy. Shown are representative 2- and 3-dimensional images of blood from 7 healthy donors. Surface covered by platelets and thrombus volume were quantified by using ImageJ software. Graphs represent mean ± SEM for 7 healthy donors. *P < .05, **P < .01, ***P < .001 vs healthy controls according to 2-way ANOVA and 1-sample t test. †P < .001 vs vehicle according to 1-sample t test.
A selective allosteric and orally bioavailable SHP2 inhibitor (SHP099) was recently developed as a potential drug for cancer therapy.34-37 We therefore investigated if SHP099 treatment would modify platelet responses similarly to NSML. When we perfused over a collagen surface at a shear rate of 1500 s−1 whole blood from healthy donors treated ex vivo with SHP099 for 2 hours, we observed that the surface covered by SHP099-treated platelets was normal. However, SHP099 treatment induced the formation of bigger thrombi, as shown by increased thrombus volume (Figure 7C), confirming that SHP2 loss of function increases platelet reactivity to collagen surface and that a potential elevated thrombotic risk exists during SHP099 treatment.
Discussion
Bleeding disorders with variable degrees of severity are often reported in NS patients, ranging from cutaneous or mucosal bleeding for a majority of patients to excessive bleeding postsurgery.8 Herein, we focused on the impact of NS mutations affecting the PTPN11 gene on platelet activation in vitro and ex vivo using blood samples from either NS patients or a mouse model of NS. In a cohort of 10 young NS patients with catalytic gain of function of SHP2 resulting from different mutations of the PTPN11 gene, all had subcutaneous bleeding but normal VWF, platelet count and volume, and coagulation parameters. Ptpn11-mutated NS mice had a weak decrease in platelet count and normal coagulation parameters, but a majority exhibited an increase in the tail bleeding time assay. Both human and mouse NS platelets displayed a significant decrease in aggregation in response to low concentrations of collagen and CRP, which were overcome when high concentrations of GPVI agonists were used. A delay in the aggregation response was also observed after CLEC-2 stimulation. Furthermore, a significant reduction of thrombus formation and growth was observed when whole blood from NS patients or NS mice was perfused over a collagen matrix under arterial shear stress. Finally, using an in vivo thrombosis model, we demonstrate that a majority of NS mice were resistant to occlusive thromboembolism. Overall, these data demonstrate that the reduced activity of NS platelets likely contributes to the easy bruising and mucosal bleeding that are characteristic of NS patients with gain-of-function mutations in the PTPN11 gene and may contribute to the more serious bleeding diathesis observed in a subset of patients.
Importantly, these findings reveal that thrombopathy related to platelet signaling defects can be added to the different health issues exhibited by NS patients with PTPN11 gene mutations. Indeed, we showed that in the mouse model of NS, SHP2 gain of function resulted in negative regulation of GPVI ITAM signaling by controlling the phosphorylation of key downstream signaling proteins, including Syk, LAT, AKT, and PLCγ2, in platelets. In platelets, ITIM-containing receptors activate and position tyrosine phosphatases in close proximity to ITAM-containing receptors, where they can dephosphorylate key signaling components and downregulate ITAM-mediated signaling. SHP2 has been previously shown to negatively regulate GPVI signaling in platelets through its recruitment to ITIM-containing receptors PECAM-1, PIR-B, and G6b-B.20-22 GPVI and CLEC-2 share common downstream signaling proteins,32 and a recent report showed that SHP2 mediates its inhibitory effect on CLEC-2 hemi-ITAM signaling by regulating Syk activation through the involvement of the ITIM receptor G6b-B.38 Our results indicate that SHP2 gain of function in the NS mouse model affects GPVI proximal signaling, as evidenced by reduced tyrosine phosphorylation of the FcRγ chain phosphorylation and Syk. It has previously been shown through the use of SHP2 conditional knockout mouse models that platelet SHP2 negatively regulates thrombus stability under pathological shear rate by inhibiting TXA2 and αIIbβ3 outside-in signaling-dependent platelet activation.23,24 We did not, however, find thrombus instability of NS platelets under high shear stress or defects in U46619-induced platelet aggregation. The difference between our data and the previous 2 studies23,24 may be due to the loss of adaptor properties of SHP2, in addition to catalytic activity in SHP2-deficient mouse models, or possible dominant-negative effects in SHP2 gain-of-function mice.39,40 For instance, a SHP2-calmodulin complex has been suggested to contribute to αIIbβ3 outside-in signaling, independently of the catalytic activity of SHP2,8 and SHP2 has been implicated in PI3K trafficking to PECAM-1.22
In contrast to NS, catalytic loss of function of SHP2 is responsible for NSML, a very rare genetic disease. We show for the first time in a mouse model of NSML that the loss of SHP2 function resulted in accelerated platelet aggregation response to low concentrations of CRP, collagen, and CLEC-2 antibody, accompanied by a transient increase in tyrosine phosphorylation of Syk, LAT, AKT, and PLCγ2 downstream of GPVI. These molecular defects also affected platelet secretion, TXA2 generation, and αIIbβ3 integrin activation. Interestingly, an increased thrombotic response was observed when blood from NSML mice was perfused on collagen under physiological arterial shear stress compared with WT mice. The platelet prothrombotic phenotype in NSML patients was highly dependent on the shear rate. Our data show that NSML patients and mice have platelets highly responsive to ITAM-mediated activation, correlating with the prothrombotic platelet phenotype on collagen fibers under high or stenotic shear rates, but did not show major hemostatic or thrombotic dysregulation in vivo. It is, however, possible that the in vivo experimental arterial thrombosis conditions used were not appropriate to determine a potential defect. Moreover, some cardiovascular dysfunctions, including hypertrophic cardiomyopathy, have been associated with NSML27,41 and may directly or indirectly interfere with in vivo assays.
Our study shows the opposite effect between the gain and loss of function of SHP2 and in platelet activation and thrombosis in mice and humans. The thrombopathy associated with the catalytic gain of function of SHP2 and subsequent defective tyrosine kinase signaling we describe here may explain the bleeding syndromes characteristic of the NS patient population. This is an important advancement in the clinical management of NS patients, particularly if they have to undergo surgery or invasive procedures or if they require anticoagulant or antiplatelet therapies. In addition to the coagulation tests recommended in the NS clinical management guidelines (PT, aPTT, and factor XI assay; https://rasopathiesnet.org/wp-content/uploads/2014/01/265_Noonan_Guidelines.pdf), based on our study, we recommend including platelet aggregation testing using low concentrations of collagen (≤1 µg/mL) to help the screening of NS patients at risk of developing bleeding. It should be noted that the platelet defect described here may be exacerbated by other deficiencies, such as granule defects, but also by ingestion of nonsteroidal anti-inflammatory drugs, fish oils, or aspirin-containing products. In the case of excessive bleeding, platelet transfusion may be recommended for NS patients. More studies will be needed to determine the extent to which platelet function defects in NS patients contribute to serious bleeding complications like hemorrhagic menstruation or prolonged bleeding after injury or surgery. Regarding NSML patients with loss of function of SHP2, the platelet hyperactivity observed in response to ITAM-coupled receptors and under shear rate both in humans and mice may point to a potentially elevated risk of thrombotic events in certain conditions known to favor platelet activation, such as diabetes, obesity, or atherosclerosis with stenotic shear stress. Because we have shown that acute treatment with SHP099 enhanced thrombus formation, it will be important to take into account that SHP2 inhibition may increase the thrombotic risk of patients receiving long-term cancer therapy.34-37 Notably, despite the increased platelet response to ITAM-coupled receptors in NSML, and the fact that bleeding diathesis is not reported as a characteristic of NSML patients carrying PTPN11 mutations, 1 of 3 NSML patients analyzed displayed cutaneous bruising and mucosal bleeding, with a high Tosetto hemorrhagic score. Although NSML is a rare disease and caused by different PTPN11 mutations, our data should promote further investigation in a larger cohort of patients for suitable NSML patient medical care in terms of hemostasis and thrombosis.
In summary, by using mouse models and blood samples from patients, our study provides a better understanding of the role of SHP2 in regulating platelet function and brings mechanistic insights into the impact of diseases caused by dysregulation of SHP2 in platelet activation. Findings from this study are clinically relevant to patient care and management, particularly in situations in which NS patients are at risk of bleeding.
For publication-related data, please contact the corresponding author.
The online version of this article contains a data supplement.
The publication costs of this article were defrayed in part by page charge payment. Therefore, and solely to indicate this fact, this article is hereby marked “advertisement” in accordance with 18 USC section 1734.
Acknowledgments
The authors thank the personnel of Anexplo animal facilities (UMS US006/INSERM) for animal handling, the cytometry core facility of INSERM UMR1048 (A. Zakaroff-Girard and E. Riant), and the Genotoul imaging core facility (INSERM UMR1048). The authors also thank all members from the B.P. team, particularly P. Sié, for helpful discussions.
M.B. was supported by a Fondation pour la Recherche Médicale (FRM) fellowship (FRM grant ECO20160736022). Work in the B.P. laboratory was supported by INSERM and the FRM (FRM grant DEQ20170336737). B.P. is a scholar of the Institut Universitaire de France. J.M. was funded by British Heart Foundation (BHF) Programme Grant RG/15/13/31673. A.M. was funded by BHF Intermediate Fellowship FS/15/58/31784. Y.A.S. was funded by BHF Senior Fellowship FS/13/1/29894. A.Y. was supported by H2020/E-Rare-3 JTC 2015 (NSEuroNet).
Authorship
Contribution: M.B. designed and performed experiments, analyzed data, and wrote the article; C.G. performed patient experiments and analyzed data; B.G.N., A.Y., and P.V. provided mice models; T.E. and S.V. provided patient blood samples; C.C. performed FeCl3-induced thrombosis experiments; J.M., A.M., and Y.A.S. performed mouse experiments, analyzed data, and read and revised the manuscript; A.Y. and B.P. designed experiments and wrote the article; and S.S. designed and set up experiments and wrote the article.
Conflict-of-interest disclosure: The authors declare no competing financial interests.
Correspondence: Sonia Severin, Institut des Maladies Métaboliques et Cardiovasculaires, INSERM U1048 and Université Paul Sabatier, 1 Ave Jean Poulhes BP 84225, 31432 Toulouse Cedex 4, France; e-mail: sonia.severin@inserm.fr.

This feature is available to Subscribers Only
Sign In or Create an Account Close Modal