

Key Points
Mutant JAK2 induces a hitherto unrecognized metabolic phenotype, consisting of hypoglycemia, adipose tissue atrophy, and early mortality.
Increased energy demands of JAK2-mutant hematopoietic cells can be targeted by metabolic inhibitors to treat MPNs.

Abstract
Increased energy requirement and metabolic reprogramming are hallmarks of cancer cells. We show that metabolic alterations in hematopoietic cells are fundamental to the pathogenesis of mutant JAK2–driven myeloproliferative neoplasms (MPNs). We found that expression of mutant JAK2 augmented and subverted metabolic activity of MPN cells, resulting in systemic metabolic changes in vivo, including hypoglycemia, adipose tissue atrophy, and early mortality. Hypoglycemia in MPN mouse models correlated with hyperactive erythropoiesis and was due to a combination of elevated glycolysis and increased oxidative phosphorylation. Modulating nutrient supply through high-fat diet improved survival, whereas high-glucose diet augmented the MPN phenotype. Transcriptomic and metabolomic analyses identified numerous metabolic nodes in JAK2-mutant hematopoietic stem and progenitor cells that were altered in comparison with wild-type controls. We studied the consequences of elevated levels of Pfkfb3, a key regulatory enzyme of glycolysis, and found that pharmacological inhibition of Pfkfb3 with the small molecule 3PO reversed hypoglycemia and reduced hematopoietic manifestations of MPNs. These effects were additive with the JAK1/2 inhibitor ruxolitinib in vivo and in vitro. Inhibition of glycolysis by 3PO altered the redox homeostasis, leading to accumulation of reactive oxygen species and augmented apoptosis rate. Our findings reveal the contribution of metabolic alterations to the pathogenesis of MPNs and suggest that metabolic dependencies of mutant cells represent vulnerabilities that can be targeted for treating MPNs.
Introduction
Myeloproliferative neoplasms (MPNs) are clonal disorders of hematopoietic stem cells driven by gain-of-function mutations in JAK2, MPL, or CALR genes.1-7 Additional mutations that modify the course of disease have also been described.8 Three phenotypic manifestations of MPNs can be distinguished: polycythemia vera (PV), essential thrombocythemia (ET), and primary myelofibrosis.9
Genetic and epigenetic changes associated with cancers are often coupled with reprogramming of cellular metabolism, a paradigm that has been recognized as 1 of the hallmarks of cancers.10 Transformed cells require increased supply of nutrients to fuel their augmented energy demands and produce macromolecules needed for unconstrained proliferation and differentiation capacities.11,12 Cancer cells can also reprogram metabolism of neighboring nonmalignant cells through interactions with stromal cells and adipocytes by provoking them to secrete lipids, amino acids, and other soluble factors, which can directly influence disease progression.13,14 This may lead to cachexia, a life-threatening pathological condition involving adipose tissue atrophy and muscle wasting. Indeed, survival of cancer patients is inversely correlated with severity of cachexia.15,16 Therefore, delineating differences in metabolic activities between normal and cancer cells is important and may open new therapeutic approaches.
We studied conditional transgenic mouse models of MPNs that can be induced by tamoxifen to express either JAK2 V617F (VF)17,18 or a JAK2 exon 12 (N542-E543del) mutation (E12) in hematopoietic cells.19 We have previously shown that these mouse models recapitulate the phenotype of MPN patients, including aberrant production of platelets and erythrocytes and development of splenomegaly. These mice also show early mortality through incompletely understood mechanisms.18,19
Here we show that expression of mutant JAK2 in hematopoietic cells leads to cell-autonomous metabolic alterations, such as increase in glycolysis and oxidative phosphorylation, as well as to systemic changes, including hypoglycemia and adipose atrophy. We found that these JAK2-dependent metabolic alterations can be targeted therapeutically in vivo by limiting nutrient supply and inhibiting rate-limiting steps in glycolysis, with beneficial effects on MPN manifestation and survival.
Methods
Mice used in this study were kept in accordance with Swiss federal regulations, and all experiments were approved by the Cantonal Veterinary Office of Basel-Stadt. The collection of blood samples and clinical data from MPN patients was approved by the Ethik Kommission Beider Basel and the ethics boards of the University of Bonn and RWTH Aachen University (Aachen, Germany) and the Clinical Center of Serbia, University of Belgrade (Belgrade, Serbia). Written informed consent was obtained from all patients in accordance with the Declaration of Helsinki. The diagnosis of MPN was established according to the revised criteria of the World Health Organization.9
Data-sharing statement
For detailed description of methods, see supplement available with the online version of this article. For original data and reagents, please contact radek.skoda@unibas.ch. RNA sequencing (RNAseq) data are available at the Gene Expression Omnibus under accession #GSE 116571.
Results
Adipose tissue atrophy and severe hypoglycemia in mice expressing VF or JAK2 exon 12 mutations in hematopoietic cells
SclCreERVF- and SclCreERE12-mutant mice develop MPNs within 4 to 5 weeks after induction with tamoxifen.18,19 We noticed that these mice also displayed a marked reduction of fat tissue and significant decrease in body weight not previously reported (Figure 1A-B). Epididymal white adipose tissue was dramatically reduced, leading to an increase in lean body mass (Figure 1C-D), despite increased food intake and a trend toward reduced physical activity (Figure 1E-F). VF and E12 strains both displayed hypoglycemia (Figure 1G). Serum insulin levels were not suppressed, possibly reflecting a hyperactive insulin axis (Figure 1H). After induction of the mutant JAK2 by tamoxifen, hypoglycemia manifested earlier in E12 mice than in VF mice (Figure 1I) and preceded the reduction in body weight (Figure 1J). Glucose tolerance test showed that exogenous glucose was immediately used in both VF and E12 mice (Figure 1K). Ruxolitinib, a JAK1/2 tyrosine kinase inhibitor, normalized glucose levels in E12 mice, along with a reduction of red cell parameters (Figure 1L). The metabolic changes were also present in mice transplanted with VF or E12 BM cells (Figure 1M), indicating that expression of mutant JAK2 solely in hematopoietic cells was sufficient to transfer the metabolic alterations.
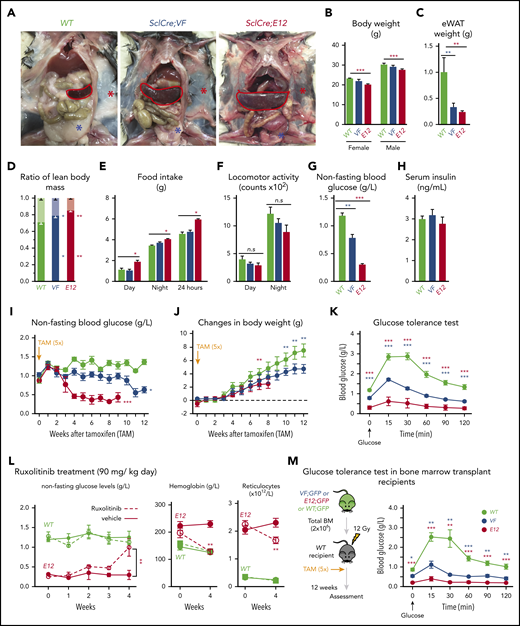
Hematopoietic-specific expression of mutant JAK2–induced adipose tissue atrophy, severe hypoglycemia, and global metabolic changes in MPN mice. (A) Representative pictures of wild-type (WT) and VF- and E12-mutant mice at 2 to 4 months after induction with tamoxifen. Red and blue asterisks indicate reduced subcutaneous and epididymal white adipose tissue (eWAT), respectively. (B) Body weight at 2 to 4 months after induction with tamoxifen (n = 8-12 mice per genotype). (C) eWAT weight (n = 8-12 mice per genotype). (D) Ratios of lean body mass/total body mass (solid colors) and fat mass/total body mass (transparent colors) at 2 to 4 months after induction with tamoxifen (n = 4-5 mice per group). (E-F) Food intake (E) and locomotor activity (on x-, y-, and z-axes) (F) as measured by comprehensive laboratory animal monitoring system (n = 5 mice per genotype). (G) Nonfasting blood glucose levels at 12 (VF) and 6 weeks (E12) after tamoxifen induction (n = 5-6 mice per genotype). (H) Serum insulin levels at 12 (VF) and 6 weeks (E12) after tamoxifen induction (n = 5-6 and n = 8 mice per genotype, respectively). (I,J) Nonfasting blood glucose levels (I) and time course of change in body weight (J) after tamoxifen induction (n = 5 mice per genotype). (K) Glucose tolerance test (GTT) 6 hours after starvation at 12 (VF) and 6 weeks (E12) after tamoxifen induction (n = 10-12 mice per genotype). (L) Tamoxifen-induced mice were treated with ruxolitinib (90 mg/kg twice daily). Time course of fasting blood glucose levels, peripheral hemoglobin levels, and reticulocyte counts (n = 5-6 mice per genotype). (M) GTT in recipients transplanted with BM cells (2 × 10⁶) from WT, VF, or E12 donor mice (n = 6 mice per genotype). All data are presented as mean ± standard error of the mean. One- or 2-way analyses of variance followed by Tukey’s multiple comparison tests were used for multiple-group comparisons. *P < .05, **P < .01, ***P < .001.
Hematopoietic-specific expression of mutant JAK2–induced adipose tissue atrophy, severe hypoglycemia, and global metabolic changes in MPN mice. (A) Representative pictures of wild-type (WT) and VF- and E12-mutant mice at 2 to 4 months after induction with tamoxifen. Red and blue asterisks indicate reduced subcutaneous and epididymal white adipose tissue (eWAT), respectively. (B) Body weight at 2 to 4 months after induction with tamoxifen (n = 8-12 mice per genotype). (C) eWAT weight (n = 8-12 mice per genotype). (D) Ratios of lean body mass/total body mass (solid colors) and fat mass/total body mass (transparent colors) at 2 to 4 months after induction with tamoxifen (n = 4-5 mice per group). (E-F) Food intake (E) and locomotor activity (on x-, y-, and z-axes) (F) as measured by comprehensive laboratory animal monitoring system (n = 5 mice per genotype). (G) Nonfasting blood glucose levels at 12 (VF) and 6 weeks (E12) after tamoxifen induction (n = 5-6 mice per genotype). (H) Serum insulin levels at 12 (VF) and 6 weeks (E12) after tamoxifen induction (n = 5-6 and n = 8 mice per genotype, respectively). (I,J) Nonfasting blood glucose levels (I) and time course of change in body weight (J) after tamoxifen induction (n = 5 mice per genotype). (K) Glucose tolerance test (GTT) 6 hours after starvation at 12 (VF) and 6 weeks (E12) after tamoxifen induction (n = 10-12 mice per genotype). (L) Tamoxifen-induced mice were treated with ruxolitinib (90 mg/kg twice daily). Time course of fasting blood glucose levels, peripheral hemoglobin levels, and reticulocyte counts (n = 5-6 mice per genotype). (M) GTT in recipients transplanted with BM cells (2 × 10⁶) from WT, VF, or E12 donor mice (n = 6 mice per genotype). All data are presented as mean ± standard error of the mean. One- or 2-way analyses of variance followed by Tukey’s multiple comparison tests were used for multiple-group comparisons. *P < .05, **P < .01, ***P < .001.
To determine whether increased supply of glucose can correct MPN-associated hypoglycemia and influence disease manifestations, we exposed JAK2-mutant mice and controls to high-glucose diet (HGD). However, HGD was unable to correct hypoglycemia in E12 mice (Figure 2A), whereas an increase in erythroid parameters in peripheral blood was noted in VF mice (Figure 2B), and an increase in spleen weight occurred in E12 mice (Figure 2C). Thus, HGD did not ameliorate hypoglycemia, but rather fueled erythrocytosis and splenomegaly.

Mutant JAK2–induced MPNs were vulnerable to modulation of nutrients in vivo. (A) Mice were induced by tamoxifen and treated with normal diet (ND) or HGD for 7 weeks. Time course of nonfasting blood glucose levels (n = 5-6 mice per treatment and genotype). (B) Peripheral blood counts of HGD- and ND-treated mice (n = 5-6 mice per genotype). (C) Spleen weight after 7 weeks of ND or HGD (n = 5-6 mice per treatment and genotype). (D) Nonfasting blood glucose levels in mice exposed to fed-fasting cycles or continuously fed with ND (n = 4-5 mice per genotype and condition). (E) Peripheral blood counts of mice exposed to fed-fasting cycles or continuously fed with ND. (F) Spleen weight in mice exposed to fed-fasting cycles or ND (n = 4-5 mice per genotype and condition). (G) Correlation of nonfasting blood glucose levels with peripheral blood counts. Peripheral blood counts and nonfasting blood glucose levels were monitored 6 to 8 weeks after tamoxifen injections (n = 4-5 mice per genotype). (H-I) Glucose uptake capacity of erythroid cells in spleen monitored by 2-NBDG fluorescence. After 4 hours of starvation, cells from spleen or BM were exposed to 2-NBDG for 30 minutes and analyzed by flow cytometry. (H) Histograms show 2-NBDG fluorescence in splenic CD71+Ter119+ cells, with quantification of the mean fluorescence intensity (MFI) presented as bar graphs (middle). 2-NBDG MFI in subsets of erythroid cells (I-V) (right). (I) Glucose uptake capacity of erythroid cells in bone marrow (n = 6 mice per genotype). All data are presented as mean ± standard error of the mean. One- or 2-way analyses of variance followed by Tukey’s multiple comparison tests were used for multiple-group comparisons. *P < .05, **P < .01. RBC, red blood cell.
Mutant JAK2–induced MPNs were vulnerable to modulation of nutrients in vivo. (A) Mice were induced by tamoxifen and treated with normal diet (ND) or HGD for 7 weeks. Time course of nonfasting blood glucose levels (n = 5-6 mice per treatment and genotype). (B) Peripheral blood counts of HGD- and ND-treated mice (n = 5-6 mice per genotype). (C) Spleen weight after 7 weeks of ND or HGD (n = 5-6 mice per treatment and genotype). (D) Nonfasting blood glucose levels in mice exposed to fed-fasting cycles or continuously fed with ND (n = 4-5 mice per genotype and condition). (E) Peripheral blood counts of mice exposed to fed-fasting cycles or continuously fed with ND. (F) Spleen weight in mice exposed to fed-fasting cycles or ND (n = 4-5 mice per genotype and condition). (G) Correlation of nonfasting blood glucose levels with peripheral blood counts. Peripheral blood counts and nonfasting blood glucose levels were monitored 6 to 8 weeks after tamoxifen injections (n = 4-5 mice per genotype). (H-I) Glucose uptake capacity of erythroid cells in spleen monitored by 2-NBDG fluorescence. After 4 hours of starvation, cells from spleen or BM were exposed to 2-NBDG for 30 minutes and analyzed by flow cytometry. (H) Histograms show 2-NBDG fluorescence in splenic CD71+Ter119+ cells, with quantification of the mean fluorescence intensity (MFI) presented as bar graphs (middle). 2-NBDG MFI in subsets of erythroid cells (I-V) (right). (I) Glucose uptake capacity of erythroid cells in bone marrow (n = 6 mice per genotype). All data are presented as mean ± standard error of the mean. One- or 2-way analyses of variance followed by Tukey’s multiple comparison tests were used for multiple-group comparisons. *P < .05, **P < .01. RBC, red blood cell.
We next examined whether reducing glucose supply through intermittent fasting-feeding regimen may alter the disease course of MPNs. Caloric restriction by intermittent fasting-feeding regimen was shown to affect hematopoietic stem and progenitor cell (HSPC) frequencies and their differentiation capacity in WT mice.20 Fasting-feeding regimen lowered blood glucose in VF recipients and in WT mice compared with uninterrupted feeding, but glucose was uniformly very low in E12 mice, irrespective of regimen (Figure 2D). However, E12 mice exposed to fasting-feeding regimen displayed slightly lower red cell parameters and neutrophil numbers (Figure 2E) and also significantly reduced erythroid progenitors in BM, whereas erythroid progenitors in spleen were increased (supplemental Figure 1B). Spleen weight was markedly reduced in E12 mice (Figure 2F). Thus, reducing glucose and energy supply through intermittent fasting ameliorated MPN phenotype, including splenomegaly and blood counts, in E12-mutant mice. The less prominent changes in VF mice were likely due to the slower kinetics of MPN development after tamoxifen compared with E12 mice.
To assess whether elevated blood counts and increased hematopoietic activity correlate with hypoglycemia, we examined glucose levels in several additional knock-in or transgenic VF models of MPNs that displayed various degrees of ET or PV phenotype21-23 and in a transgenic line (Tg6) that constitutively overexpressed erythropoietin (Epo) and displayed massive erythrocytosis.24 A strong inverse correlation between blood glucose concentration and red cell parameters (eg, hemoglobin [R2 = 0.822]) was noted, whereas no correlation was seen between glucose and platelets, neutrophils, or monocytes (Figure 2G). Hypoglycemia was present in all VF models with PV phenotype and also in Tg6 mice with erythrocytosis, as previously reported.25 However, hypoglycemia was absent in VF mice with a pure ET phenotype. These results suggest that increased glucose consumption by hyperactive erythropoiesis could have been responsible for hypoglycemia in these mouse models.
To further examine glucose usage, we determined glucose uptake using the fluorescent tracer 2-NBDG. VF and E12 cells showed increased glucose uptake compared with WT controls (Figure 2H-I). Interestingly, the intensity of 2-NBDG showed bimodal peaks, possibly indicating that a subset of VF and E12 cells was hyperactive in taking up glucose (Figure 2H). Erythroid cells of E12 mice from spleen showed higher uptake than cells from BM. Uptake of 2-NBDG in subsets of erythroid precursors was highest in the fractions 2 and 3, correlating with the highest proliferative activity of these fractions (Figure 2I). Thus, erythroid cells in MPN mice took up and avidly consumed glucose.
Because MPN mice showed severe loss of adipose deposits (Figure 1A-C), we tested whether high-fat diet (HFD) may affect MPN phenotype and survival. Whereas WT mice receiving HFD (60% fat) gained weight rapidly and after 24 weeks displayed a massive increase in body fat, E12 mice showed little or no weight gain or increase in body fat (Figure 3A-B). Female VF mice failed to gain weight, similar to E12 mice, whereas male VF mice showed a moderate increase in weight. HFD increased leptin levels compared with normal chow, but the relative increase was greater in WT mice (Figure 3C). Hypoglycemia in VF and E12 mice was not corrected by HFD, although a trend toward slightly higher levels was noted (Figure 3D). Insulin levels increased under HFD in VF despite hypoglycemia, but remained unchanged in E12 mice (Figure 3E). Remarkably, survival of E12 mice was substantially prolonged by HFD (P < .001) and allowed us to observe these mice for up to 30 weeks (Figure 3F). There was only a trend toward better survival in VF mice. HFD treatment has been shown to negatively affect hematopoietic differentiation capacity of HSPCs in the BM niche.26 We observed slightly reduced red cell parameters, but increased spleen size, in JAK2-mutant mice receiving HFD (Figure 3G-H).
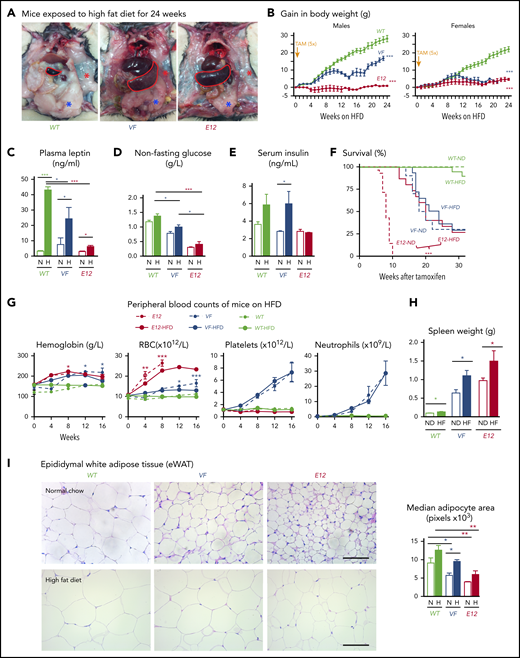
HFD treatment ameliorated early lethality phenotype of PV-exhibiting mutant JAK2–expressing mice. (A) Pictures of male WT and VF- and E12-mutant mice exposed to HFD for 24 weeks. Red and blue asterisks mark reduced subcutaneous and epididymal white adipose tissue (eWAT) fat content, respectively. (B) Time course of body weight gain of HFD-treated mice (n = 8-12 mice per genotype and sex). (C) Plasma leptin concentration in HFD- and normal diet (ND)–treated mice (n = 5 mice per treatment and genotype). (D) Nonfasting blood glucose levels in HFD- and ND-treated mice (n = 5 mice per treatment and genotype). (E) Serum insulin levels in ND- and HFD-treated mice (n = 4-5 mice per treatment and genotype). (F) Survival of mice receiving ND or HFD (n = 12 mice per treatment and genotype). (G) Hemoglobin levels and red blood cell (RBC), platelet, and neutrophil counts in peripheral blood during HFD or ND treatment in indicated mice (n = 6-8 mice per treatment and genotype). (H) Bar graph indicating spleen weight of HFD- and ND-treated mice (n = 5-6 mice per genotype). (I) Representative images of hematoxylin and eosin staining of eWAT from ND- or HFD-treated mice. Scale bars, 100 µm. Bar graph represents the median white adipocyte size of HFD-treated mice (n = 5 mice per). All data are presented as mean ± standard error of the mean. One- or 2-way analyses of variance followed by Tukey’s multiple comparison tests were used for multiple-group comparisons. Significance in survival curves was estimated with the log-rank test. *P ≤ .05, **P ≤ .01, ***P ≤ .001.
HFD treatment ameliorated early lethality phenotype of PV-exhibiting mutant JAK2–expressing mice. (A) Pictures of male WT and VF- and E12-mutant mice exposed to HFD for 24 weeks. Red and blue asterisks mark reduced subcutaneous and epididymal white adipose tissue (eWAT) fat content, respectively. (B) Time course of body weight gain of HFD-treated mice (n = 8-12 mice per genotype and sex). (C) Plasma leptin concentration in HFD- and normal diet (ND)–treated mice (n = 5 mice per treatment and genotype). (D) Nonfasting blood glucose levels in HFD- and ND-treated mice (n = 5 mice per treatment and genotype). (E) Serum insulin levels in ND- and HFD-treated mice (n = 4-5 mice per treatment and genotype). (F) Survival of mice receiving ND or HFD (n = 12 mice per treatment and genotype). (G) Hemoglobin levels and red blood cell (RBC), platelet, and neutrophil counts in peripheral blood during HFD or ND treatment in indicated mice (n = 6-8 mice per treatment and genotype). (H) Bar graph indicating spleen weight of HFD- and ND-treated mice (n = 5-6 mice per genotype). (I) Representative images of hematoxylin and eosin staining of eWAT from ND- or HFD-treated mice. Scale bars, 100 µm. Bar graph represents the median white adipocyte size of HFD-treated mice (n = 5 mice per). All data are presented as mean ± standard error of the mean. One- or 2-way analyses of variance followed by Tukey’s multiple comparison tests were used for multiple-group comparisons. Significance in survival curves was estimated with the log-rank test. *P ≤ .05, **P ≤ .01, ***P ≤ .001.
With normal chow, adipocytes from VF and E12 mice showed significantly reduced size compared with WT (Figure 3I). With HFD, the size of adipocytes increased in all genotypes, but adipocytes from VF and E12 mice remained smaller than adipocytes from WT mice (Figure 3G). Fat tissue from VF and E12 mice also displayed elevated messenger RNA expression of several inflammatory cytokines as well as CD36, a fatty acid uptake mediator (supplemental Figure 2A). Mutant JAK2 also altered brown adipose tissue morphology, with increased numbers of small fat vacuoles. HFD partially normalized these alterations (supplemental Figure 2B). In line with the elevated lipolysis, HFD-treated VF and E12 mice displayed reduced accumulation of lipids in the liver (supplemental Figure 2C), suggesting that these mice were less prone to hepatic steatosis upon HFD challenge.
Our data suggest that hematopoietic-specific expression of mutant JAK2 induced hypoglycemia as a result of increased consumption of glucose by erythroid cells, which was normalized by ruxolitinib, and that increased energy demand and elevated inflammatory cytokines led to lipolysis and adipose atrophy, which was partially corrected by HFD.
Because some of the metabolic alterations, particularly lipolysis, seemed to be a counter-regulatory adaptation to hypoglycemia involving nonhematopoietic tissue, we next sought to specify metabolic requirements unique to JAK2-mutant HSPCs. We performed RNAseq in megakaryocyte and erythroid progenitors (MEPs) of JAK2-mutant and WT mice. The numbers of differentially expressed genes in MEPs from BM of VF and E12 mice compared with WT MEPs and heatmaps are shown in Figure 4A-B. Ingenuity pathway analysis–based gene ontology enrichment revealed that most of the significantly up- or downregulated genes in JAK2-mutant mice were related to metabolism, JAK/STAT signaling, and inflammatory signaling pathways (supplemental Figure 3A). By competitive gene set testing on the Molecular Signatures Database hallmark gene sets,27 we also found that oxidative phosphorylation and JAK/STAT signaling target genes were among the 4 top gene sets (supplemental Figure 3B). Consistent with the elevated glucose uptake (Figure 2E-F), we observed increased expression of glucose transporters Glut1, Glut3, and Glut10, glutamine transporter Asct2, and the Slc27a family of fatty acid transporters (Figure 4C). Furthermore, enzymes involved in regulation of glycolysis (eg, Pkm1 and Pfkfb3) and their known transcriptional regulators (eg, Hif-1α, nMyc, Ahr, and Arnt) were also elevated in MEPs from VF and E12 mice (Figure 4D-E). These data suggest that activation of mutant JAK2 signaling altered the expression of genes involved the regulation of metabolic pathways.
![Transcriptomic and metabolic profiling identified altered metabolic pathways in HSPCs expressing mutant JAK2. (A) Venn diagram shows number of distinct and overlapping genes expressed between VF and E12 mice as compared with WT controls (log fold change [FC] > 1.5 and false discovery rate [FDR] < 0.05; n = 3 per genotype). (B) Heatmap showing differentially expressed genes in BM MEPs as determined by messenger RNA (mRNA) sequencing. Data show FC to the mean. (C-E) Heatmap showing expression of nutrient transporters (C), glycolysis pathway enzymes (D), and regulators of glycolysis pathway genes (E) in BM MEPs as determined by mRNA sequencing. Data shown are normalized expression levels in VF and E12 vs WT cells (n = 3 per genotype). (F) Metabolic pathway enrichment analysis of significantly upregulated metabolites in BM MEPs from VF and E12 compared with WT mice as determined by MetaboloAnalyst 3.0 (n = 3 per genotype; FC > 1.5; P < .05). (G) Measurements of glycolytic rates in BM lineage-negative Sca-1+ and cKit+ (LSK) cells and MEPs. Extracellular acidification rate values were normalized to cell numbers. Data are from 3 independent experiments (n = 6 mice per genotype). (H) Measurements of oxygen consumption rate (OCR), indicative of mitochondrial oxidative phosphorylation in BM LSK cells and MEPs. OCR values were normalized to cell numbers. Data are from 3 independent experiments (n = 6 mice per genotype). (I) Glucose uptake capacity of LSK cells and MEPs in BM and spleen as measured by mean fluorescence intensity (MFI) of 2-NBDG fluorescence (n = 6 mice per genotype). (J) Number of mitochondria per cell in BM LSK and MEP cells as determined by transmission electron microscopy (TEM) (n = 3 samples per genotype and 60-100 cells per genotype). (K) Mitochondrial DNA copy number in BM long-term hematopoietic stem cells (LT-HSCs), multipotent progenitors, and MEPs as measured by quantitative polymerase chain reaction (qPCR) (n = 3 per genotype). (L) Mitochondrial DNA copy number in peripheral blood of MPN patients as measured by qPCR presented as violin density plots. The horizontal width of the plots shows the density of the data along the y-axis. All data are presented as mean ± standard error of the mean. One-way analyses of variance followed by Tukey’s multiple comparison tests were used for multiple group comparisons. See also supplemental Figures 4 and 5. *P < .05, **P < .01, ***P < .001. FCCP, carbonyl cyanide-p-trifluoromethoxyphenylhydrazone; PMF, primary myelofibrosis.](https://ash.silverchair-cdn.com/ash/content_public/journal/blood/134/21/10.1182_blood.2019000162/7/m_bloodbld2019000162f4.png?Expires=1770132560&Signature=yEUWB8kfJC3faAiRxveeKSfyJuTTkhnKo8LGMwpcX-VujxRtsmFxId~5H8stnHuU9fmZNurW6ujooP0j9pT1ghEpiszQ31NODlkeqU8EljytV7ap0qFq-Y-aHhBGb00B9q37-2hu8v28jSe3B0TX2oNZ8~VZhuQY5NIArP~WufwWibSOGTery7llMNlOdMwye6YIL6e-0cAmI6W-hsJOmFHBqUW~MZbC1bEKR6V2roiNQEF2LzFCoGT97FOvsOQC2F3oXyJJNwhmzqoOVrpFJwn9AZjm3LO2UibxkQ6M~yFylPTzYp3m9vCmUfXJYHCWIPehnXbpVF1rmVsCA8AyYw__&Key-Pair-Id=APKAIE5G5CRDK6RD3PGA)
Transcriptomic and metabolic profiling identified altered metabolic pathways in HSPCs expressing mutant JAK2. (A) Venn diagram shows number of distinct and overlapping genes expressed between VF and E12 mice as compared with WT controls (log fold change [FC] > 1.5 and false discovery rate [FDR] < 0.05; n = 3 per genotype). (B) Heatmap showing differentially expressed genes in BM MEPs as determined by messenger RNA (mRNA) sequencing. Data show FC to the mean. (C-E) Heatmap showing expression of nutrient transporters (C), glycolysis pathway enzymes (D), and regulators of glycolysis pathway genes (E) in BM MEPs as determined by mRNA sequencing. Data shown are normalized expression levels in VF and E12 vs WT cells (n = 3 per genotype). (F) Metabolic pathway enrichment analysis of significantly upregulated metabolites in BM MEPs from VF and E12 compared with WT mice as determined by MetaboloAnalyst 3.0 (n = 3 per genotype; FC > 1.5; P < .05). (G) Measurements of glycolytic rates in BM lineage-negative Sca-1+ and cKit+ (LSK) cells and MEPs. Extracellular acidification rate values were normalized to cell numbers. Data are from 3 independent experiments (n = 6 mice per genotype). (H) Measurements of oxygen consumption rate (OCR), indicative of mitochondrial oxidative phosphorylation in BM LSK cells and MEPs. OCR values were normalized to cell numbers. Data are from 3 independent experiments (n = 6 mice per genotype). (I) Glucose uptake capacity of LSK cells and MEPs in BM and spleen as measured by mean fluorescence intensity (MFI) of 2-NBDG fluorescence (n = 6 mice per genotype). (J) Number of mitochondria per cell in BM LSK and MEP cells as determined by transmission electron microscopy (TEM) (n = 3 samples per genotype and 60-100 cells per genotype). (K) Mitochondrial DNA copy number in BM long-term hematopoietic stem cells (LT-HSCs), multipotent progenitors, and MEPs as measured by quantitative polymerase chain reaction (qPCR) (n = 3 per genotype). (L) Mitochondrial DNA copy number in peripheral blood of MPN patients as measured by qPCR presented as violin density plots. The horizontal width of the plots shows the density of the data along the y-axis. All data are presented as mean ± standard error of the mean. One-way analyses of variance followed by Tukey’s multiple comparison tests were used for multiple group comparisons. See also supplemental Figures 4 and 5. *P < .05, **P < .01, ***P < .001. FCCP, carbonyl cyanide-p-trifluoromethoxyphenylhydrazone; PMF, primary myelofibrosis.
Transcriptomic and metabolic profiling identified altered metabolic pathways in HSPCs expressing mutant JAK2. (A) Venn diagram shows number of distinct and overlapping genes expressed between VF and E12 mice as compared with WT controls (log fold change [FC] > 1.5 and false discovery rate [FDR] < 0.05; n = 3 per genotype). (B) Heatmap showing differentially expressed genes in BM MEPs as determined by messenger RNA (mRNA) sequencing. Data show FC to the mean. (C-E) Heatmap showing expression of nutrient transporters (C), glycolysis pathway enzymes (D), and regulators of glycolysis pathway genes (E) in BM MEPs as determined by mRNA sequencing. Data shown are normalized expression levels in VF and E12 vs WT cells (n = 3 per genotype). (F) Metabolic pathway enrichment analysis of significantly upregulated metabolites in BM MEPs from VF and E12 compared with WT mice as determined by MetaboloAnalyst 3.0 (n = 3 per genotype; FC > 1.5; P < .05). (G) Measurements of glycolytic rates in BM lineage-negative Sca-1+ and cKit+ (LSK) cells and MEPs. Extracellular acidification rate values were normalized to cell numbers. Data are from 3 independent experiments (n = 6 mice per genotype). (H) Measurements of oxygen consumption rate (OCR), indicative of mitochondrial oxidative phosphorylation in BM LSK cells and MEPs. OCR values were normalized to cell numbers. Data are from 3 independent experiments (n = 6 mice per genotype). (I) Glucose uptake capacity of LSK cells and MEPs in BM and spleen as measured by mean fluorescence intensity (MFI) of 2-NBDG fluorescence (n = 6 mice per genotype). (J) Number of mitochondria per cell in BM LSK and MEP cells as determined by transmission electron microscopy (TEM) (n = 3 samples per genotype and 60-100 cells per genotype). (K) Mitochondrial DNA copy number in BM long-term hematopoietic stem cells (LT-HSCs), multipotent progenitors, and MEPs as measured by quantitative polymerase chain reaction (qPCR) (n = 3 per genotype). (L) Mitochondrial DNA copy number in peripheral blood of MPN patients as measured by qPCR presented as violin density plots. The horizontal width of the plots shows the density of the data along the y-axis. All data are presented as mean ± standard error of the mean. One-way analyses of variance followed by Tukey’s multiple comparison tests were used for multiple group comparisons. See also supplemental Figures 4 and 5. *P < .05, **P < .01, ***P < .001. FCCP, carbonyl cyanide-p-trifluoromethoxyphenylhydrazone; PMF, primary myelofibrosis.
Analysis of messenger RNA expression was complemented with profiling of metabolite in purified BM MEP cells using liquid chromatography coupled with mass spectrometry. We found altered concentrations of metabolites that were classified into groups using metabolic pathway enrichment analysis (Figure 4F).28 The observed changes in JAK2-mutant MEPs were consistent with increased activities of glycolysis, pentose phosphate pathway, and terpenoid backbones for steroid biosynthesis (Figure 4F); the same changes were also observed in LSK cells (supplemental Figure 4A). Combined analysis of data obtained by RNAseq and metabolite profiling also showed altered regulation of glycolysis and pentose phosphate pathway genes as the main alterations in MEPs from JAK2-mutant mice (supplemental Figure 4B).
To assess glycolytic activity and mitochondrial respiration, we performed metabolic flux studies. Aerobic glycolysis, indicative of Warburg effect,11,29 was elevated in LSK and MEP cells from VF and E12 mice (Figure 4G). The same results were obtained in total spleen cells (supplemental Figure 4C). However, total BM cells from E12 mice unexpectedly showed slightly reduced rate of glycolysis compared with WT BM. Mitochondrial respiration was assessed by determining the OCR as an indicator of oxidative phosphorylation. BM LSK and MEP cells from VF and E12 mice showed an increased respiration rate compared with WT controls (Figure 4H). Likewise, unfractionated spleen cells from VF and E12 mice also showed increased basal respiration rate and higher maximal respiration rate than WT controls (supplemental Figure 4D). No differences in OCR between total BM cells from VF, E12, and WT mice were detected (supplemental Figure 4D). In line with the increased rate of glycolysis and oxidative phosphorylation, LSK cells and MEPs from VF and E12 mice showed increased glucose uptake (Figure 4I), similar to differentiated erythroid cells (Figure 2H-I).
Because mitochondrial respiration was increased, we used several methods to determine mitochondrial numbers and mass. Transmission electron microscopy showed that LSK and MEP cells of VF mice had reduced numbers of mitochondria, whereas the numbers of mitochondria of E12 mice were increased in MEPs (Figure 4J). Likewise, quantification of mitochondrial DNA copy number by quantitative polymerase chain reaction in E12 showed a similar pattern of decrease in long-term hematopoietic stem cells and increase in MEPs (Figure 4K), whereas in VF mice, no differences were noted in WT mice. A similar pattern was observed using the mitochondrial membrane–specific dye MitoTracker Green (supplemental Figure 4E). These results show an overall trend toward a decrease in mitochondrial numbers and mitochondrial mass in cells from JAK2-mutant mice. Thus, despite reduced mitochondrial mass, HSPCs from JAK2-mutant mice showed an increased rate of oxidative phosphorylation. We also found decreased mitochondrial DNA copy numbers in peripheral blood granulocytes from MPN patients (Figure 4L).
Because hematopoietic cells of JAK2-mutant mice showed elevated expression of glucose transporters and increased glucose uptake, we examined in greater detail the intracellular fate of glucose by tracking carbon-13 (13C)–labeled D-glucose ([U-13C6] D-glucose; Figure 5A). Purified MEP and LSK cells were cultured for 8 hours in serum-free medium with [U-13C6] D-glucose, and total number of metabolites, as well as number of 13C-labeled metabolites, was determined by ion chromatography–Fourier transform mass spectrometry.30 The glycolytic intermediates showed a high percentage 13C labeling in both WT and JAK2-mutated cells, whereas the absolute number of glycolytic intermediates was elevated only in cells from JAK2-mutant mice (Figure 5B), consistent with increased rate of glycolysis. The total amount of pyruvate in JAK2-mutant cells was higher than that in WT cells, in good correlation with the increased expression of pyruvate kinase (Pkm1). However, only 20% to 30% of pyruvate was labeled with 13C in cells from all genotypes, suggesting that a major proportion of pyruvate came from nonglucose sources (eg, amino acid metabolism). Consequently, the percentage of contribution of the 13C-labeled pyruvate to the TCA cycle was low (supplemental Figure 5A). Cells expressing mutant JAK2 also showed strong 13C labeling of pentose phosphate pathway intermediates, leading to increased biosynthesis of purine nucleotides (Figure 5B; supplemental Figure 5B). Consistently, phosphoribosyl pyrophosphate synthetase 2 (Prps2), the rate-limiting enzyme for phosphoribosyl pyrophosphate synthesis, was highly elevated in JAK2-mutant HSPCs (supplemental Figure 5C).
![Increased incorporation of glucose carbon through glycolysis and the pentose phosphate pathway in mutant JAK2–expressing HSPCs. (A) Schematic of glucose labeling and tracing in BM LSK and MEP cells. Fluorescence-activated cell sorted (FACS) LSK cells and MEPs were cultured with [U-13C6] d-glucose for 8 hours and analyzed by ion chromatography–Fourier transform mass spectrometry (IC-FTMS) to determine the fate of labeled carbon atoms derived from glucose in various downstream metabolites. (B) Bar graphs depicting the levels (μmoles per gram of protein) of glucose-derived 13C containing isotopologues of metabolites in glycolysis and pentose phosphate pathways. LSK and MEP cells were collected and pooled from 9 to 12 mice of matching genotype as 1 replicate. Data are from 2 independent experiments. Insert showing the key rate-limiting step in glycolysis in which the activity of Pfkfb enzyme potentiated activity of rate-limiting enzyme phosphofructokinase (Pfk) through generation of fructose-2,6-biphosphate (F2,6BP) from fructose-6-phosphate (F6P). 3-(3-pyridinyl)-1-(4-pyridinyl)-2-propen-1-1 (3PO) is a specific pharmacological inhibitor of Pfkfb3 isoform. (C) Pfkfb1-4 mRNA expression in MEP cells (n = 3 per genotype). (D) Pfkfb3 protein expression in BM LSK and MEP cells as measured by intracellular FACS (n = 3 per genotype). (E) Graphical representation of increased glycolysis rate-limiting step involving conversion of F6P to F1,6BP and its positive regulator PFKFB3, which can be inhibited by 3PO. All data are presented as mean ± standard error of the mean. See also supplemental Figure 6. ***P < .001. 6PG, 6-phosphogluconate; 6PGL, 6-phosphogluconolactone; ADP, adenosine 5′-diphosphate; ATP, adenosine triphosphate; DHAP, dihydroxyacetone phosphate; E4P, erythrose 4-phosphate; F6P, fructose 6-phosphate; FBP, fructose 1,6-bisphosphate; G6P, glucose 6-phosphate; PRPP, phosphoribosyl pyrophosphate; R5P, ribose 5-phosphate; Ru5P, ribulose 5-phosphate; S7P, sedoheptulose 7-phosphate; TCA, tricarboxylic acid cycle; Xu5P, xylulose 5-phosphate.](https://ash.silverchair-cdn.com/ash/content_public/journal/blood/134/21/10.1182_blood.2019000162/7/m_bloodbld2019000162f5.png?Expires=1770132560&Signature=sfIJ8Ap11SBsE3M3WxEU6-OmPLR3hwAKcGOPh5IORKkSxSmOxCjDnncogYywgVKwKmegR0gT17UO9ey52SCcSEXovJviz5j7IMUTk-c0meaLWrOn596yG1vO-PMzgJMy8RYenulw4HY-RHUbQIJJYLSMlZVZf~ce5nmXgJNtgu0WzC7-okhX-PA8W4YzibQ52yTDfR66mnAtYJarujZGbW1VW0M2q7Tpbwij3QIAySWMJsyNFle76n3Dgkn9PMANzxsbVfH6QH5uJqMyN9AcmpmMQiQsYLNC4nqGilx5I62TISGxAj1sUddn2KiW3XHHzUFk~fsoazhMbi89M-AFwQ__&Key-Pair-Id=APKAIE5G5CRDK6RD3PGA)
Increased incorporation of glucose carbon through glycolysis and the pentose phosphate pathway in mutant JAK2–expressing HSPCs. (A) Schematic of glucose labeling and tracing in BM LSK and MEP cells. Fluorescence-activated cell sorted (FACS) LSK cells and MEPs were cultured with [U-13C6] d-glucose for 8 hours and analyzed by ion chromatography–Fourier transform mass spectrometry (IC-FTMS) to determine the fate of labeled carbon atoms derived from glucose in various downstream metabolites. (B) Bar graphs depicting the levels (μmoles per gram of protein) of glucose-derived 13C containing isotopologues of metabolites in glycolysis and pentose phosphate pathways. LSK and MEP cells were collected and pooled from 9 to 12 mice of matching genotype as 1 replicate. Data are from 2 independent experiments. Insert showing the key rate-limiting step in glycolysis in which the activity of Pfkfb enzyme potentiated activity of rate-limiting enzyme phosphofructokinase (Pfk) through generation of fructose-2,6-biphosphate (F2,6BP) from fructose-6-phosphate (F6P). 3-(3-pyridinyl)-1-(4-pyridinyl)-2-propen-1-1 (3PO) is a specific pharmacological inhibitor of Pfkfb3 isoform. (C) Pfkfb1-4 mRNA expression in MEP cells (n = 3 per genotype). (D) Pfkfb3 protein expression in BM LSK and MEP cells as measured by intracellular FACS (n = 3 per genotype). (E) Graphical representation of increased glycolysis rate-limiting step involving conversion of F6P to F1,6BP and its positive regulator PFKFB3, which can be inhibited by 3PO. All data are presented as mean ± standard error of the mean. See also supplemental Figure 6. ***P < .001. 6PG, 6-phosphogluconate; 6PGL, 6-phosphogluconolactone; ADP, adenosine 5′-diphosphate; ATP, adenosine triphosphate; DHAP, dihydroxyacetone phosphate; E4P, erythrose 4-phosphate; F6P, fructose 6-phosphate; FBP, fructose 1,6-bisphosphate; G6P, glucose 6-phosphate; PRPP, phosphoribosyl pyrophosphate; R5P, ribose 5-phosphate; Ru5P, ribulose 5-phosphate; S7P, sedoheptulose 7-phosphate; TCA, tricarboxylic acid cycle; Xu5P, xylulose 5-phosphate.
Increased incorporation of glucose carbon through glycolysis and the pentose phosphate pathway in mutant JAK2–expressing HSPCs. (A) Schematic of glucose labeling and tracing in BM LSK and MEP cells. Fluorescence-activated cell sorted (FACS) LSK cells and MEPs were cultured with [U-13C6] d-glucose for 8 hours and analyzed by ion chromatography–Fourier transform mass spectrometry (IC-FTMS) to determine the fate of labeled carbon atoms derived from glucose in various downstream metabolites. (B) Bar graphs depicting the levels (μmoles per gram of protein) of glucose-derived 13C containing isotopologues of metabolites in glycolysis and pentose phosphate pathways. LSK and MEP cells were collected and pooled from 9 to 12 mice of matching genotype as 1 replicate. Data are from 2 independent experiments. Insert showing the key rate-limiting step in glycolysis in which the activity of Pfkfb enzyme potentiated activity of rate-limiting enzyme phosphofructokinase (Pfk) through generation of fructose-2,6-biphosphate (F2,6BP) from fructose-6-phosphate (F6P). 3-(3-pyridinyl)-1-(4-pyridinyl)-2-propen-1-1 (3PO) is a specific pharmacological inhibitor of Pfkfb3 isoform. (C) Pfkfb1-4 mRNA expression in MEP cells (n = 3 per genotype). (D) Pfkfb3 protein expression in BM LSK and MEP cells as measured by intracellular FACS (n = 3 per genotype). (E) Graphical representation of increased glycolysis rate-limiting step involving conversion of F6P to F1,6BP and its positive regulator PFKFB3, which can be inhibited by 3PO. All data are presented as mean ± standard error of the mean. See also supplemental Figure 6. ***P < .001. 6PG, 6-phosphogluconate; 6PGL, 6-phosphogluconolactone; ADP, adenosine 5′-diphosphate; ATP, adenosine triphosphate; DHAP, dihydroxyacetone phosphate; E4P, erythrose 4-phosphate; F6P, fructose 6-phosphate; FBP, fructose 1,6-bisphosphate; G6P, glucose 6-phosphate; PRPP, phosphoribosyl pyrophosphate; R5P, ribose 5-phosphate; Ru5P, ribulose 5-phosphate; S7P, sedoheptulose 7-phosphate; TCA, tricarboxylic acid cycle; Xu5P, xylulose 5-phosphate.
Taken together, these data suggest that expression of mutant JAK2 in hematopoietic cells reprogrammed metabolism by upregulating the expression of nutrient transporters and key regulatory enzymes of glucose metabolism, resulting in increased glycolysis, mitochondrial respiration, and nucleotide biosynthesis.
Targeting the activity of Pfkfb3, an early rate-limiting enzyme in glycolysis, reduces growth of human VF-expressing cell lines
We found that Pfkfb3, 1 of 4 Pfkfb isoforms, was significantly elevated in mutant HSPCs both at RNA and protein levels (Figure 5C-D). This enzyme catalyzes the conversion of fructose-6-phosphate to F2,6BP, which acts as an allosteric activator on phosphofructokinase and thereby accelerates one of the rate-limiting steps in glycolysis (Figure 5E).31 Pfkfb3 can be inhibited by 3PO,32 a small molecule that was found to reduce the intracellular concentration of F2,6BP and thereby to suppresses glycolysis.31 We first tested 3PO alone or in combination with ruxolitinib on growth, survival, and metabolic activity in human myeloid cell lines SET2, HEL, and UKE1 that express VF and in K562 cells that are transformed by BCR-ABL. We confirmed that PFKFB3 was expressed in these cells (supplemental Figure 6A). Treatment with 3PO alone increased apoptosis and attenuated the proliferation of all VF-expressing cell lines in a dose-dependent manner, and this effect was additive with ruxolitinib (Figure 6A-B; supplemental Figure 6B). In contrast, K562 cells were susceptible to 3PO treatment only at high concentrations (Figure 6A-B). VF-expressing cell lines treated with 3PO alone for 12 hours showed markedly reduced glycolytic rate in a dose-dependent manner and exhibited additive effects with ruxolitinib (Figure 6C). Interestingly, 3PO also reduced mitochondrial oxygen consumption rate (Figure 6D), possibly because of reduced supply of glycolysis pathway intermediates to the TCA cycle. Under similar conditions, no effect of 3PO on glycolysis or oxygen consumption was observed in K562 cells. These results suggest that human cell lines expressing VF highly depend on glycolysis and are susceptible to apoptotic cell death when subjected to glycolytic blockade.
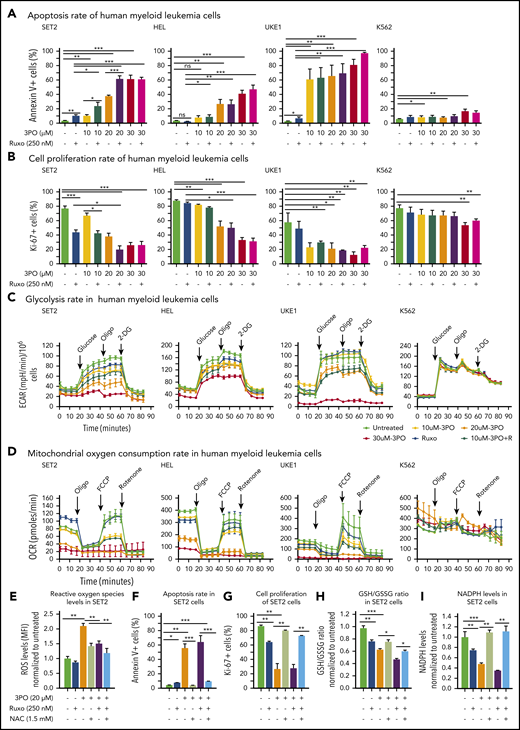
Dual treatment with 3PO and ruxolitinib induces cell-proliferation arrest and apoptosis in human cell lines expressing VF by altering redox homeostasis. (A) Apoptosis rate was determined by percentage of annexin V+ cells in indicated human myeloid leukemia cells after treatment with 3PO and/or ruxolitinib for 48 hours (n = 3 independent experiments). (B) Cell proliferation was determined by percentage of Ki67+ cells in indicated human myeloid leukemia cells in the presence of 3PO and/or ruxolitinib for 48 hours (n = 3 independent experiments). (C) Measurements of extracellular acidification rate (ECAR), indicative of glycolytic rates, in SET2, HEL UKE1, and K562 cells after treatment with 3PO and/or ruxolitinib for 12 to 16 hours (n = 3 independent experiments). (D) Measurements of OCR, indicative of mitochondrial oxidative phosphorylation, in indicated cells after treatment with 3PO and/or ruxolitinib for 12 to 16 hours (n = 3 independent experiments). (E) Total reactive oxygen species (ROS) levels in SET2 cells after treatment with 3PO and/or ruxolitinib for 24 hours. Cells were pretreated with 1.5 mM of N-acetyl-cysteine (NAC) for 6 hours. Data were normalized to vehicle-treated control (n = 3 independent experiments). (F-G) Apoptosis rate (F) and cell proliferation (G) were determined in SET2 cells treated with 3PO and/or ruxolitinib and/or NAC for 48 hours. Cells were pretreated with NAC for 6 hours. Normalized values to vehicle-treated controls are shown. (H-I) Ratio of glutathione (GSH)/glutathione disulfide (GSSG) (H) and NADPH levels (I) in SET2 cells treated with 3PO and/or ruxolitinib for 12 hours. Cells were pretreated with NAC for 6 hours. Normalized values to vehicle-treated controls are shown. All data are presented as mean ± standard error of the mean. Two-way analyses of variance with subsequent Bonferroni posttests were used. See also supplemental Figure 7. *P < .05, **P < .01, ***P < .001. MFI, mean fluorescence intensity.
Dual treatment with 3PO and ruxolitinib induces cell-proliferation arrest and apoptosis in human cell lines expressing VF by altering redox homeostasis. (A) Apoptosis rate was determined by percentage of annexin V+ cells in indicated human myeloid leukemia cells after treatment with 3PO and/or ruxolitinib for 48 hours (n = 3 independent experiments). (B) Cell proliferation was determined by percentage of Ki67+ cells in indicated human myeloid leukemia cells in the presence of 3PO and/or ruxolitinib for 48 hours (n = 3 independent experiments). (C) Measurements of extracellular acidification rate (ECAR), indicative of glycolytic rates, in SET2, HEL UKE1, and K562 cells after treatment with 3PO and/or ruxolitinib for 12 to 16 hours (n = 3 independent experiments). (D) Measurements of OCR, indicative of mitochondrial oxidative phosphorylation, in indicated cells after treatment with 3PO and/or ruxolitinib for 12 to 16 hours (n = 3 independent experiments). (E) Total reactive oxygen species (ROS) levels in SET2 cells after treatment with 3PO and/or ruxolitinib for 24 hours. Cells were pretreated with 1.5 mM of N-acetyl-cysteine (NAC) for 6 hours. Data were normalized to vehicle-treated control (n = 3 independent experiments). (F-G) Apoptosis rate (F) and cell proliferation (G) were determined in SET2 cells treated with 3PO and/or ruxolitinib and/or NAC for 48 hours. Cells were pretreated with NAC for 6 hours. Normalized values to vehicle-treated controls are shown. (H-I) Ratio of glutathione (GSH)/glutathione disulfide (GSSG) (H) and NADPH levels (I) in SET2 cells treated with 3PO and/or ruxolitinib for 12 hours. Cells were pretreated with NAC for 6 hours. Normalized values to vehicle-treated controls are shown. All data are presented as mean ± standard error of the mean. Two-way analyses of variance with subsequent Bonferroni posttests were used. See also supplemental Figure 7. *P < .05, **P < .01, ***P < .001. MFI, mean fluorescence intensity.
Perturbation of glycolysis and mitochondrial respiration can lead to altered redox homeostasis and aberrant levels of ROS. 3PO alone caused an increase in total ROS levels at just 6 hours after treatment (supplemental Figure 6C). Elevated ROS levels in SET2 cells persisted for at least 24 hours (Figure 6E) and resulted in increased apoptosis and decreased proliferation (Figure 6F-G). This suggested that the blockade of glycolysis by 3PO in VF-expressing cells rapidly depleted cellular antioxidant capacities. Indeed, treatment with 3PO alone or in combination with ruxolitinib reduced the GSH/glutathione disulfide (the oxidized form of GSH) ratio (Figure 6H). Consistent with diminished GSH/glutathione disulfide ratios, 3PO treatment alone or in combination with ruxolitinib also substantially reduced NADPH levels (Figure 6I), suggesting that decreased flux through the pentose phosphate pathway contributed to exhaustion of reductive reserves and defects in redox homeostasis in VF cells. The functional consequences of ROS-mediated actions are highly dose dependent; moderate increases in ROS may potentiate cell survival and proliferation, whereas high ROS levels that exceed cellular antioxidant capacity are detrimental to cell survival.33,34 The depleted antioxidant capacities of GSH or NADPH could be partially rescued by NAC, a potent ROS scavenger (Figure 6H-I).33 NAC treatment in SET2 cells not only lowered ROS levels close to baseline (Figure 6E), but also rescued OCR (supplemental Figure 6D) as well as the cell survival and proliferation disadvantage caused by 3PO (Figure 6E-H). 3PO treatment also caused apoptosis of peripheral blood mononuclear cells from MPN patients with high VF allele burden, which was rescued by NAC pretreatment (supplemental Figure 7). These data suggest that inhibition of glycolysis through 3PO increased ROS levels above the cellular antioxidant capacity and thereby contributed to inhibiting proliferation and survival of VF-expressing cells.
We then assessed the efficacy and tolerability of 3PO treatment in vivo in a cohort of VF and E12 mice. To allow monitoring of mutant JAK2 allele burden, competitive transplantation of BM coexpressing mutant JAK2 with a GFP reporter in VF and WT mice in a 1:1 mixture was performed (Figure 7A). Recipient mice treated with 3PO alone or in combination with ruxolitinib for 8 weeks showed reduction in spleen weight, increase in epididymal white adipose tissue, and improved glucose levels, including normalization of glucose tolerance (Figure 7B-E). 3PO also restored body fat in JAK2-mutant mice (supplemental Figure 8A), and combination with ruxolitinib augmented these beneficial effects (Figure 7B-E). Consistently, MPN patients significantly gained body weight when treated with ruxolitinib (supplemental Figure 8B), in line with previous reports.35,36 In VF mice, 3PO treatment alone also reduced red cell numbers, hemoglobin levels, and neutrophils (Figure 7F). These reductions were accentuated in combination of 3PO with ruxolitinib. 3PO alone had no effect on platelet counts, whereas ruxolitinib alone or in combination with 3PO increased platelet numbers in VF and E12 mice. This paradoxical effect of ruxolitinib on platelets has been reported previously.18,37 Our data obtained in human hematopoietic cell lines expressing VF and primary samples from MPN patients suggest that the same metabolic alterations as in mouse models are present in human MPNs. Furthermore, PV patients receiving cytoreductive therapies showed higher glucose levels (95.3 ± 13.5 mg/dL) as compared with PV patients treated with phlebotomy only (81.8 ± 6.1 mg/dL; Figure 7G). Taken together, these data suggest that targeting metabolic alterations in MPNs may open new therapeutic opportunities for human MPNs as well.
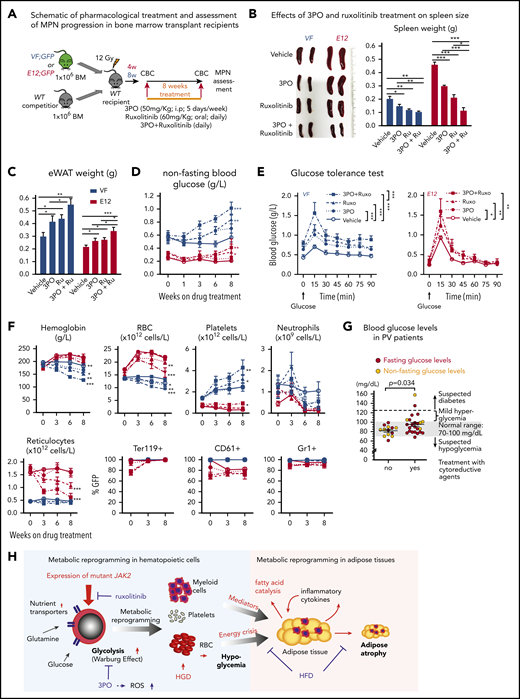
Combined targeting of elevated glycolysis and mutant JAK2 activity elicited additive effects in vivo. (A) Schematic of long-term 3PO and ruxolitinib treatment. Competitive BM transplant recipient mice were induced with tamoxifen (TAM) to activate the VF and E12 mutations; 4 (for E12) or 8 weeks (for VF) later, the treatment regimen was initiated. Mice were treated with vehicle or 3PO (50 mg/kg, intraperitoneally) alone or in combination with ruxolitinib (60 mg/kg orally) every day for 8 weeks. (B) Representative pictures and weights of spleen from mice treated with vehicle or 3PO and/or ruxolitinib (n = 6 mice per genotype). (C) Weight of epididymal white adipose tissue (eWAT) in 3PO- and/or ruxolitinib-treated mice (n = 6 mice per genotype). (D) Time course of nonfasting blood glucose levels in 3PO- and/or ruxolitinib-treated mice (n = 6 mice per genotype). (E) Glucose tolerance test in 3PO- and/or ruxolitinib-treated VF (left) and E12 mice (right) (n = 6 mice per genotype). (F) Peripheral blood cell counts (upper) and frequencies of GFP+ hematopoietic cells in peripheral blood (lower) in 3PO- and/or ruxolitinib-treated mice at indicated time points (n = 6 mice per genotype). (G) Blood glucose levels in PV patients with or without cytoreductive therapy. Cytoreductive drugs were hydroxyurea (n = 19), pegylated interferon-α (n = 1), ruxolitinib (n = 3), and anagrelide (n = 1). (H) Schematic drawing depicting the metabolic changes in hematopoietic and nonhematopoietic tissues induced by expression of mutant JAK2 in hematopoietic cells. Metabolic changes and MPNs are primarily driven by the expression of mutant JAK2 in hematopoietic cells. HGD promoted proliferation of the JAK2-mutant clone and accelerated MPN phenotype, whereas ruxolitinib, 3PO, and HFD reduced the MPN manifestations. Note that some changes in metabolism were direct effects of the JAK2-mutant hematopoietic cells, whereas other changes (eg, lipolysis) were indirect consequences of the general energy crisis and/or inflammatory mediators secreted by the JAK2-mutant cells. One-way analyses of variance (ANOVAs) followed by Tukey’s multiple comparison tests were used for multiple-group comparisons, or 2-way ANOVA with subsequent Bonferroni posttest or 2-tailed unpaired t test (G) was used. All data are presented as mean ± standard error of the mean. See also supplemental Figure 8. *P < .05, **P < .01. CBC, complete blood count.
Combined targeting of elevated glycolysis and mutant JAK2 activity elicited additive effects in vivo. (A) Schematic of long-term 3PO and ruxolitinib treatment. Competitive BM transplant recipient mice were induced with tamoxifen (TAM) to activate the VF and E12 mutations; 4 (for E12) or 8 weeks (for VF) later, the treatment regimen was initiated. Mice were treated with vehicle or 3PO (50 mg/kg, intraperitoneally) alone or in combination with ruxolitinib (60 mg/kg orally) every day for 8 weeks. (B) Representative pictures and weights of spleen from mice treated with vehicle or 3PO and/or ruxolitinib (n = 6 mice per genotype). (C) Weight of epididymal white adipose tissue (eWAT) in 3PO- and/or ruxolitinib-treated mice (n = 6 mice per genotype). (D) Time course of nonfasting blood glucose levels in 3PO- and/or ruxolitinib-treated mice (n = 6 mice per genotype). (E) Glucose tolerance test in 3PO- and/or ruxolitinib-treated VF (left) and E12 mice (right) (n = 6 mice per genotype). (F) Peripheral blood cell counts (upper) and frequencies of GFP+ hematopoietic cells in peripheral blood (lower) in 3PO- and/or ruxolitinib-treated mice at indicated time points (n = 6 mice per genotype). (G) Blood glucose levels in PV patients with or without cytoreductive therapy. Cytoreductive drugs were hydroxyurea (n = 19), pegylated interferon-α (n = 1), ruxolitinib (n = 3), and anagrelide (n = 1). (H) Schematic drawing depicting the metabolic changes in hematopoietic and nonhematopoietic tissues induced by expression of mutant JAK2 in hematopoietic cells. Metabolic changes and MPNs are primarily driven by the expression of mutant JAK2 in hematopoietic cells. HGD promoted proliferation of the JAK2-mutant clone and accelerated MPN phenotype, whereas ruxolitinib, 3PO, and HFD reduced the MPN manifestations. Note that some changes in metabolism were direct effects of the JAK2-mutant hematopoietic cells, whereas other changes (eg, lipolysis) were indirect consequences of the general energy crisis and/or inflammatory mediators secreted by the JAK2-mutant cells. One-way analyses of variance (ANOVAs) followed by Tukey’s multiple comparison tests were used for multiple-group comparisons, or 2-way ANOVA with subsequent Bonferroni posttest or 2-tailed unpaired t test (G) was used. All data are presented as mean ± standard error of the mean. See also supplemental Figure 8. *P < .05, **P < .01. CBC, complete blood count.
Discussion
We show that expression of mutant JAK2 in mouse models of MPNs induced profound metabolic alterations that have been hitherto overlooked, with strongly increased energy demands and vital dependence on glucose. In mouse models of acute myeloid leukemia, leukemic cells expressing both BCR/ABL and NUP98/HOXA9 or MLL-AF9 alone imposed systemic metabolic changes, resulting in mild hypoglycemia with markedly decreased insulin levels and insulin resistance.38 In contrast, our mutant JAK2 models displayed a more profound hypoglycemia without signs of insulin resistance, implying that acute myeloid leukemia and MPN cells differ in type and extent of the metabolic reprograming. Hypoglycemia strongly correlated with degree of increased erythropoiesis, consistent with the critical role of glucose metabolism in normal erythropoiesis.39 E12 mice, with predominantly erythroid hyperproliferation, had a more severe hypoglycemia than VF mice, which displayed trilineage involvement and a milder erythroid phenotype. Hypoglycemia was also observed in Tg6 mice that exhibited massive erythrocytosis as a result of transgenic overexpression of Epo under the control of the human PDGFR promoter.24,25 This suggests that excessive Epo signaling through WT JAK2 can lead to metabolic alterations similar to those from signaling through mutant JAK2.
In addition to altered glucose metabolism, JAK2-mutant mice also exhibited increased lipid catabolism. The changes in lipid metabolism could have been a consequence of the general energy crisis induced by hypoglycemia, but chronic inflammation mediated by elevated cytokine production may have further contributed to lipolysis in a non–cell-autonomous way. Cachexia in advanced primary myelofibrosis has also been linked to increased levels of proinflammatory cytokines.40 Tg6 mice also showed decreased fat stores,25 supporting a connection between excess erythropoiesis and lipolysis. However, Tg6 mice typically survive for 28 to 32 weeks,41 whereas E12 mice die within 8 to 10 weeks. Thus, signaling through mutant JAK2 has more deleterious consequences than signaling through WT JAK2 because of overexpressing of Epo.
Metabolic phenotyping and gene expression analyses of HSPCs revealed profound alterations in multiple metabolic pathways and allowed us to identify several potentially rate-limiting steps in glycolysis, pentose phosphate cycle, and citrate cycle. Inhibiting glycolysis by 3PO in VF-expressing human cell lines reduced proliferation and increased apoptosis through a mechanism that involved greatly increased ROS levels (Figure 6). Although the extent of metabolic alterations in patients with MPNs remains to be determined, the effectiveness of 3PO inhibition in JAK2-mutant human cell lines and primary samples from MPN patients is encouraging. 3PO also reduced blood counts and spleen size and normalized glucose levels and fat tissue in JAK2-mutant mice in vivo, further suggesting that lipolysis is primarily driven by increased glucose consumption and energy crisis (Figure 7H). Poor water solubility of 3PO makes this compound difficult to administer in patients. However, derivatives of 3PO, such as PFK15 and PFK-158, which also inhibit PFKFB3, are now in clinical trials for treating late-stage cancer patients.42
Increased glutamine metabolism was reported in BaF/3 cells expressing VF mutation.43 It will be interesting to determine whether targeting glutamine metabolism alone or in combination with inhibition of glycolysis can improve therapy for MPNs. A recent study investigated the cell-autonomous metabolic changes in mutant IDH2/JAK2–driven MPNs (present in 2% of MPN patients) and demonstrated that JAK2/IDH-mutant cells are sensitive to an IDH2 inhibitor.44 Although the presence of additional somatic mutations in MPNs may be difficult to target therapeutically, the resultant metabolic abnormalities might be common for different driver mutations and could represent new therapeutic targets.
Our findings support the potential of elucidating additional MPN cell–specific metabolic properties and provide a rationale for testing metabolic inhibitors in MPNs using a 2-pronged approach of cotargeting altered metabolic dependencies and mutant JAK2 activity.
The online version of this article contains a data supplement.
The publication costs of this article were defrayed in part by page charge payment. Therefore, and solely to indicate this fact, this article is hereby marked “advertisement” in accordance with 18 USC section 1734.
Acknowledgments
The authors thank the laboratory members for helpful discussions and critical reading of our manuscript; Jean-Luc Villeval and Anthony R. Green for providing the mouse Jak2 V617F knock-in and human JAK2 V617F knock-in mice, respectively; and Philippe Demougin and Katja Eschbach (D-BSSE, Genomics Facility Basel) for conducting next-generation sequencing. The analyses of RNA sequencing data were performed at sciCORE, the scientific computing center at University of Basel. The authors also thank Endre Laczko (Functional Genomics Center Zürich) for helpful discussions on metabolomics analysis and Petra Seebeck (University of Zurich) for performing EchoMRI scans of mice.
This work was supported by grants from the Swiss National Science Foundation (31003A-147016/1 and 31003A_166613), SystemsX.ch (Medical Research and Development Grant 2014/266), and the Swiss Cancer League (KLS-2950-02-2012 and KFS-3655-02-2015) (R.C.S.) and by grants from the Forschungsfonds der Universität Basel (DMM 2039) and Krebsliga Beider Basel (KLbB-4486) (T.N.R.). Stable isotope resolved metabolomics was performed with the support of the Resource Facility for Stable Isotope Resolved Metabolomics, funded by National Institutes of Health, National Institute of Diabetes and Digestive and Kidney Diseases grant 1U24DK097215-01A1 (T.W.-M.F.), and the Markey Cancer Center grant P30CA177558 supporting metabolomics instrumentation (B. M. Evers).
Authorship
Contribution: T.N.R. designed and performed research, analyzed data, and wrote the manuscript; N.H., J.H., S.R., J.-M.M., N.A., S.G., D.L., D.G., R.N., T.C., A.N.L., T.W.-M.F., C.B., S.K., V.P.C., and S.D.P. performed research and analyzed data; F.G. and M.G. analyzed data; H.H.-S. performed mice genotyping; J.T., D.W., and N.K. collected and analyzed MPN patient data; J.D. and C. Handschin performed research and analyzed data; S. Dimeloe performed research and analyzed data; S. Dirnhofer, C. Hess, and T.R. analyzed data; and R.C.S. designed research, analyzed data, and wrote the manuscript.
Conflict-of-interest disclosure: T.R. is a full-time employee of Novartis Pharma AG; R.C.S. has consulted for and received honoraria from Novartis, Shire, and Baxalta; and S.K. reports research funding from Novartis, AOP Orphan Pharmaceuticals AG, and Bristol-Myers Squibb as well as consultancy honoraria and travel reimbursements from Novartis, AOP Orphan Pharmaceuticals AG, and Bristol-Myers Squibb. The remaining authors declare no competing financial interests.
Correspondence: Radek C. Skoda, University of Basel, Hebelstrasse 20, Basel, 4031, Switzerland; e-mail: radek.skoda@unibas.ch; and Tata Nageswara Rao, University of Basel, Hebelstrasse 20, Basel, 4031, Switzerland; e-mail: rao.tata@unibas.ch.

This feature is available to Subscribers Only
Sign In or Create an Account Close Modal