

Key Points
MSCs can become cancer-associated fibroblasts and transfer mitochondria to rescue B-ALL cells from ROS-inducing chemotherapy.
Rescue of B-ALL cells is overcome by microtubule inhibitors, which interrupt the tunneling nanotubes used for mitochondrial transfer.

Abstract
We investigated and modeled the mesenchymal stromal cell (MSC) niche in adult acute lymphoblastic leukemia (ALL). We used gene expression profiling, cytokine/chemokine quantification, flow cytometry, and a variety of imaging techniques to show that MSCs, directly isolated from the primary bone marrow specimens of patients with ALL, frequently adopted an activated, cancer-associated fibroblast phenotype. Normal, primary human MSCs and the MSC cell line HS27a both were activated de novo, when exposed to the reactive oxygen species (ROS)–inducing chemotherapy agents cytarabine (AraC) and daunorubicin (DNR), a phenomenon blocked by the antioxidant N-acetyl cysteine. Chemotherapy-activated HS27a cells were functionally evaluated in a coculture model with ALL targets. Activated MSCs prevented therapy-induced apoptosis and death in ALL targets, via mitochondrial transfer through tunneling nanotubes (TNTs). Reduction of mitochondrial transfer by selective mitochondrial depletion or interference with TNT formation by microtubule inhibitors, such as vincristine (VCR), prevented the “rescue” function of activated MSCs. Corticosteroids, also a mainstay of ALL therapy, prevented the activation of MSCs. We also demonstrated that AraC (but not VCR) induced activation of MSCs, mitochondrial transfer, and mitochondrial mass increase in a murine NSG model of disseminated SEM cell–derived ALL, wherein CD19+ cells closely associated with nestin+ MSCs after AraC, but not in the other conditions. Our data propose a readily clinically exploitable mechanism for improving treatment of ALL, in which traditional ROS-inducing chemotherapies are often ineffective at eradicating residual disease, despite efficiently killing the bulk population.
Introduction
Relapse in ALL arises from putatively dormant, tumor-initiating cells that contribute to minimal residual disease, typically quantified by polymerase chain reaction (PCR) amplification of patient-specific immunoglobulin heavy chain/T-cell receptor gene rearrangements.1 Minimal residual disease monitoring shows that relapsed ALL usually has the same immunoglobulin/T-cell receptor rearrangements found at diagnosis. The intraclonal origins of relapsed ALL are typically accepted.2 Murine models also suggest that relapse of ALL does not necessarily arise from genetically distinct, chemoresistant cells, but more likely occurs due to protection of a subset of cells within a specific niche.3,4 The niche identified by Duan et al3 was induced by cytarabine (AraC, a DNA synthesis inhibitor) and daunorubicin (DNR, which intercalates DNA and prevents topoisomerase II progression) and was composed of homogeneous mesenchymal stromal cells (MSCs) expressing nestin and α-smooth muscle actin (αSMA). By contrast, recent data in a T-ALL model in which corticosteroids and vincristine (VCR) were used as therapy suggested that T-ALL cells may have a more dynamic interaction with bone marrow, without a specific niche.5 An important difference between the “niche” and “no niche” findings is the chemotherapy agents used to generate the model. “Niche-generating” AraC and DNR are DNA-damaging agents that trigger reactive oxygen species (ROS) in target cells and contrast with corticosteroids (potent anti-inflammatory agents) and VCR (a microtubule inhibitor) as a mechanism of action. The reasoning that ROS generation could be critical to niche formation is consistent with a recent study of patient-derived xenograft models of acute myeloid leukemia (AML) in which cells that were resistant to AraC showed very high ROS and increased mitochondrial mass. This suggested to us that chemotherapy-induced ROS perturbation correlates with ALL chemosensitivity within the niche.6
To investigate, we sought evidence of a protective MSC niche by using primary specimens from 70 patients enrolled in the UKALL14 trial (clinicaltrials.gov # NCT01085617). We noted the frequent presence of activated MSCs/cancer associated fibroblasts (CAFs), a phenomenon hitherto not described in ALL. We further modeled this process de novo, with in vitro work using both primary MSCs from healthy donors and an MSC cell line, HS27a, as well as an in vivo model of ALL. CAFs/activated MSCs could prevent ALL cell apoptosis and death from exogenously administered ROS-inducing agents by mitochondrial transfer along tunneling nanotubes (TNTs). Corticosteroids prevented the activation of CAFs, and VCR prevented the formation of the intracellular connections necessary for their ability to rescue ALL cells from chemotherapy.
Methods
Cells
Human specimens and consent
All primary material was used with informed consent in accordance with the Declaration of Helsinki (16/LO/2055).
Primary MSC isolation and expansion
Mononuclear cells were isolated by density gradient centrifugation (Ficoll; Amersham Biosciences, Little Chalfont, United Kingdom). MSCs were isolated and expanded in MesenCult plus MesenCult stimulatory supplements (Stemcell Technologies) plus 100 U/mL penicillin G, 100 mg/mL streptomycin, 2 mM l-glutamine (Gibco), and 1 ng/mL basic fibroblast growth factor (R&D Systems). Passage 4 and 5 MSCs were used in the experiments. Cell supernatants used were from passage 1 or 2. MSCs were characterized based on the International Society for Cellular Therapy7 criteria, using the Human MSC Functional Identification (R&D Systems) and Human MSC Verification kits (R&D Systems).
Cell lines
MSC and ALL coculture
MSCs were plated on day 0, ALL cells were added at 24 hours at a 1:4 ratio. The cells were flow sorted for use after 3 to 5 days. For the Transwell experiments, the ALL cells were added on a Transwell insert (pore size, 0.4-1.0 µm; Greiner Bio-one) at day 1.
Mitochondrial depletion
HS27a cells were cultured for 4 weeks in medium containing 0.1 µg/mL ethidium bromide, 50 µg/mL uridine, and 1 mM sodium pyruvate.
Immunocytochemistry
Cells were fixed with 4% paraformaldehyde, washed, and blocked for 2 hours with 1% bovine serum albumin, 10% normal donkey serum (Abcam), and 0.3% Triton X-100 (Sigma-Aldrich). Primary antibody and secondary antibodies were added for 1 hour each. 4′,6-Diamidino-2-phenylindole (DAPI; Santa Cruz Biotechnology) and the phalloidin F-actin stain Atto 633 (Sigma-Aldrich) were added for 10 minutes. Images were acquired on the Zeiss Axio Observer Z1 at room temperature with objectives 10× air (Plan-Neofluar NA 0.3), 20× air (Plan-Neofluar NA 0.4), and 40× air (Plan-Neofluar NA 0.75), using Axiovision Rel. 4.8 software and an AxioCam MR Rev 3 camera. Fluorochromes used included DAPI, red fluorescent protein, and cyanine-5. No image adjustments were required.
Flow cytometry
Samples were incubated with relevant antibodies at 4°C for 30 minutes. Fluorescence-minus-one controls were used to account for nonspecific background staining. Ten thousand intact single-cell events were collected on a BD LSRFortessa X-20 (Becton Dickinson, Oxford, United Kingdom). MSCs were sorted from ALL cells antiCD90-FITC and antiCD19-APC on the BD FACSAria Fusion. Data were analyzed with FlowJo software (version 10.4.2).
Mitochondrial transfer
MSCs were stained with MitoTracker Deep Red (M22426; ThermoFisher) at 37°C for 30 minutes, according to the manufacturer’s instructions. The cells were washed twice, then left for 3 hours to eliminate unbound probe before a final wash. The stained MSCs were cocultured with ALL cells for 24 to 72 hours. Mitochondrial transfer was quantified among the CD19-expressing ALL population.
Confocal time-lapse imaging
Differentially stained cells were cultured on a 35-mm glass-bottom dish (Maktek) coated with 20 µg/mL fibronectin at 37°C on a heated tray at 5% CO2. Chemotherapy was added immediately before imaging. Images were acquired on a Zeiss LSM 880 with Airyscan with a 63× Oil Plan-apochromat objective NA 1.40 at a resolution of 1024 × 1024 pixels in the x and y directions and 0.5-µm steps in the z direction. The pinhole diameter was set at 1 airy unit. DiO and Deep Red MitoTracker were excited with 488- and 633-nm lasers, respectively. A transmitted photomultiplier tube was used in transmitted mode to generate an image. Images were processed with Oxford Instruments, Bitplane Imaris 9.1, and Carl Zeiss ZEN Black.
Cell viability and apoptosis assay
MSCs were cocultured with ALL cells in a 6-well plate, with or without 200 nM AraC, 200 to 1000 nM dexamethasone (DEX), and 1.6 VCR nM. Other agents used were 500 nM latrunculin-B, 10 to 100 nM nocodazole, and 1.6 colchicine nM. At 48 hours, the cells were collected and stained with CD19 before staining with annexin V, according to the manufacturer’s (BD Biosciences) instructions, and then with DAPI. The CD19+ cells were analyzed by flow cytometry for annexin V/DAPI staining, to determine apoptotic and dead cell populations.
ROS quantification
MSCs were cocultured with ALL cells in a 6-well plate, with or without drugs. CellRox Green (C10444; ThermoFisher) staining was carried out at 24 hours, according to the manufacturer’s instructions, and quantified by flow cytometry.
Quantification of secreted proteins
Cytometric bead array
A cytometric bead array (BD Biosciences) was used according to the manufacturer’s instructions with the IL6 Flex Set (558276; BD Biosciences), human IL8 Flex Set (558277; BD Biosciences), or human MCP-1/CCL2 Flex Set (558287; BD Biosciences). Three hundred events per analyte from the live gate were collected on a BD FACSAria instrument (Becton Dickinson). Data were analyzed with FCAP Array Software, version 3.0.
Enzyme-linked immunosorbent assay
The supernatant was collected from the MSCs at subconfluence, passages 1 and 2 and stored at −80°C. Semiquantitative multianalyte enzyme-linked immunosorbent assays (ELISAs) were performed on the thawed, passage 1 cell supernatant with custom-made kits (Custom Mix-n-Match Multi-Analyte ELISArray Kit, 336111; Qiagen). Single-analyte quantitative ELISA kits (supplemental Table 2, available on the Blood Web site) were used on passage 2 supernatants.
MTS tetrazolium cell-viability assay
An MTS (CellTitre 96Aqueous One Solution Reagent; Promega) assay was performed, according to the manufacturer’s instruction. Absorbance was read at 570 nm on a BMG FLUOstar Galaxy absorbance reader.
RNA extraction
RNA was extracted from cells with TRIzol (15596026; Ambion, Life Technologies) and separated from DNA by using chloroform (Sigma-Aldrich). Isopropanol (Sigma-Aldrich) was added, and the samples were frozen overnight at −80°C. After it was thawed and washed with 70% ethanol, the pellet of RNA was resuspended in RNase-free water, and the concentration was measured on a NanoDrop spectrophotometer.
RT2 profiler PCR array
cDNA was synthesized with the RT2 First Strand kit (330401; Qiagen), according to the manufacturer’s instruction. The cDNA was then used for an RT2 Profiler PCR array, according to the manufacturer’s protocol with a predefined and preprepared selection of primers for appropriate CAF-defining targets listed in supplemental Table 3. Each sample was run in triplicate for each gene and quantified relative to the glyceraldehyde-3-phosphate dehydrogenase housekeeping control.
Mitochondrial DNA detection
DNA was extracted from the cells by using the QIAamp DNA Blood Mini Kit (51106; Qiagen). The DNA was amplified for detection of mitochondrial and nuclear DNA from both human and mouse, using the primers stated in the supplemental Data. Annealing temperature used was 60°C for 15 to 25 cycles. The PCR product was run in a 2% agarose (Sigma-Aldrich) gel and visualized under UV light.
Mouse model
Disseminated BFP-luciferase-SEM leukemia was established in sixteen 8- to 10-week-old NSG mice by tail vein injection. The mice were treated with AraC, VCR, nocodazole, or AraC+VCR, or phosphate-buffered saline (PBS) control. The experimental schema is shown in the supplemental Figures. At euthanasia, SEM cells were flow sorted and MSCs were cultured, and the assays were carried out as described. One femur per mouse was sent for histopathology. See the supplemental Methods for detail.
Statistical analysis
The data were analyzed on GraphPad Prism 6 software, except where otherwise indicated. For statistical comparisons, the χ2 , unpaired Student t test, or Mantel-Cox test was used, as indicated.
Results
To explore the stromal fibroblast niche in ALL, we isolated (68/84) and expanded (37/68) MSCs from 84 B-ALL bone marrow specimens from 70 patients (Table 1) participating in the UKALL14 trial. A significant difference in apparent CAF-related morphology between specimens taken after VCR and DEX exposure (6 of 16, 38%) and those taken after AraC-exposure (20 of 25, 80%; P = .006) prompted a more comprehensive documentation of CAFs, defined by proinflammatory cytokine secretion, altered morphology with prominent actin stress fibers, and a typical gene expression profile (GEP). After combined VCR, DEX, and DNR exposure, the IL8, CCL2, CXCL1, CXCL2, and IL6 secretion patterns appeared similar to those seen in the healthy donor MSCs, contrasted with an increase after AraC-containing treatment (Figure 1). In Figure 1B, phalloidin and DAPI staining of 3 samples from each time point, (red arrows in Figure 1A, based on available material) shows prominent F-actin stress fibers (indicated by red boxes around the images) at diagnosis and after AraC, but not in healthy donors or after VCR/DEX. The same specimens in Figure 1C showed strong upregulation of CAF-associated genes. The unexpected findings of CAF among primary patient ALL specimens prompted us to model their generation by chemotherapy drugs.
Patient characteristics
| Baseline characteristic | MSC sample population (n = 70) | Not in MSC sample population (n = 585) | P* |
|---|---|---|---|
| Age, median (range) | 43.0 (22-65) | 46.0 (23-65) | .068† |
| Sex | |||
| Male | 48 (68.6) | 310 (53.0) | .013 |
| Female | 22 (31.4) | 275 (47.0) | |
| Baseline WBC, median (range) | 11.0 (0.8-583.1) | 7.9 (0.11-889.6) | .24† |
| PH status | |||
| PH− | 51 (73.9) | 392 (68.7) | .37 |
| PH+ | 18 (26.1) | 179 (31.3) | |
| Missing/failed | 1 | 14 | |
| T(4,11) | |||
| Absent | 62 (91.2) | 497 (92.4) | .33 |
| Present | 6 (8.8) | 41 (7.6) | |
| Missing/failed | 2 | 47 | |
| Complexity | |||
| Absent | 53 (96.4) | 425 (95.1) | .97‡ |
| Present | 2 (3.6) | 22 (4.9) | |
| Missing/failed | 15 | 138 | |
| HoTr/near-haploidy | |||
| Absent | 55 (96.5) | 409 (89.7) | .10 |
| Present | 2 (3.5) | 47 (10.3) | |
| Missing/failed | 13 | 129 | |
| Any cytogenetic risk factors | |||
| Absent | 28 (50.0) | 186 (39.6) | .13 |
| Present | 28 (50.0) | 284 (60.4) | |
| Missing/failed | 14 | 115 | |
| High-risk baseline | |||
| Standard risk | 13 (19.4) | 64 (11.5) | .064 |
| High risk | 54 (80.6) | 492 (88.5) | |
| Unknown, assumed standard | 13 (19.4) | 64 (11.5) | .064 |
Data are expressed as n (%), unless otherwise stated.
HoTr, low hypodiploid/near triploidy; PH, Philadelphia chromosome; t4;11, presence of KMT2A/AFF1 rearrangement; WBC, white blood cell.
χ2, unless otherwise stated.
Wilcoxon Mann-Whitney test.
Fisher’s exact test.
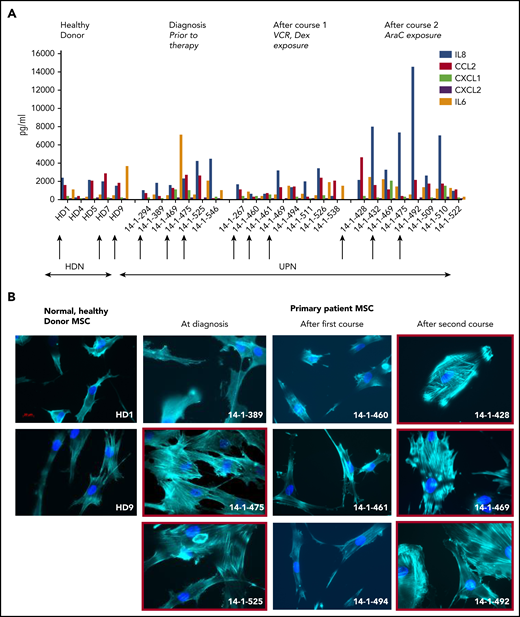
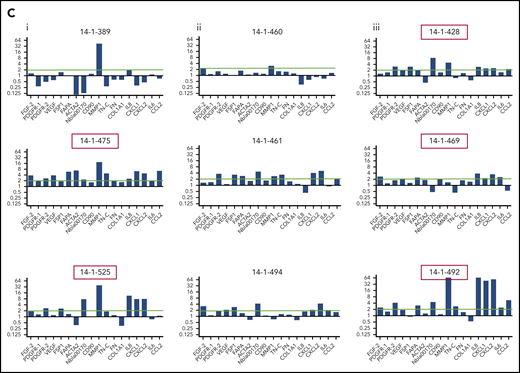
Activated fibroblasts are common in primary samples from patients with de novo ALL who are undergoing induction chemotherapy. (A) Cytokines and chemokines secreted by MSCs isolated from the normal healthy donor bone marrow or primary patient ALL specimens at diagnosis and after the first and second courses of chemotherapy. IL8 (blue), CCL2 (red), CXCL1 (green), CXCL2 (purple), and IL6 (orange), all in picograms per milliliter, are shown on the y-axis. The x-axis shows each sample denoted by UKALL14 trial patient number (UPN) or healthy donor number (HDN). Arrows below the x-axis indicate the specimens that were subsequently evaluated in more detail. (B) Photomicrographs (original magnification ×40), showing phalloidin and DAPI staining of MSCs isolated from primary patient ALL samples indicated by UPN or HDN. (C) Gene expression profile showing fold upregulation (y-axis) of 18 selected genes in primary patient MSCs (UPN indicated above the panel) at diagnosis (i) and after the first (ii) and second (iii) courses of chemotherapy, compared with the mean baseline of 3 normal healthy donor MSCs, isolated from patients with primary ALL. Red box around UPN indicates specimen with morphological changes. Gene names are shown on the x-axis. A blue line is drawn at twofold upregulation, which is considered significant.
Activated fibroblasts are common in primary samples from patients with de novo ALL who are undergoing induction chemotherapy. (A) Cytokines and chemokines secreted by MSCs isolated from the normal healthy donor bone marrow or primary patient ALL specimens at diagnosis and after the first and second courses of chemotherapy. IL8 (blue), CCL2 (red), CXCL1 (green), CXCL2 (purple), and IL6 (orange), all in picograms per milliliter, are shown on the y-axis. The x-axis shows each sample denoted by UKALL14 trial patient number (UPN) or healthy donor number (HDN). Arrows below the x-axis indicate the specimens that were subsequently evaluated in more detail. (B) Photomicrographs (original magnification ×40), showing phalloidin and DAPI staining of MSCs isolated from primary patient ALL samples indicated by UPN or HDN. (C) Gene expression profile showing fold upregulation (y-axis) of 18 selected genes in primary patient MSCs (UPN indicated above the panel) at diagnosis (i) and after the first (ii) and second (iii) courses of chemotherapy, compared with the mean baseline of 3 normal healthy donor MSCs, isolated from patients with primary ALL. Red box around UPN indicates specimen with morphological changes. Gene names are shown on the x-axis. A blue line is drawn at twofold upregulation, which is considered significant.
First, we evaluated whether clinically relevant concentrations of DNR, AraC, VCR, and DEX could generate CAF from healthy donor and/or HS27a MSCs. Figure 2A shows typical CAF cytomorphology in both HS27a and normal healthy donor MSCs after AraC and DNR but not after DEX and VCR. GEP (Figure 2B) shows that AraC and DNR generated similar CAF-like chemokine and cytokine gene upregulation seen in patient specimens, with MMP-1 upregulation particularly prominent. VCR upregulated chemokine and cytokine gene expression modestly, but not cytoskeletal and extracellular matrix remodelling and growth factor gene expression. After DEX, there was striking downregulation of MMP-1. The corresponding cytokine and chemokine levels (Figure 2C) confirmed the proinflammatory impact of AraC, DNR, and VCR, by contrast with the anti-inflammatory impact of DEX. To study the functional impact, we primed HS27a cells by exposing them to AraC, VCR, or DEX (DNR was excluded as it, paradoxically, extended MSC lifespan), then quantifying the survival of a cocultured B-ALL cell line SEM (specifically chosen for its low intrinsic ROS levels and known AraC susceptibility) exposed to the same agents. A clear pattern of reduced response to AraC, DEX, or VCR was seen when the MSCs were primed with AraC (red arrows) but not with the other agents (Figure 2Di-iii). A Transwell setup (Figure 2Div) abolished this impact.
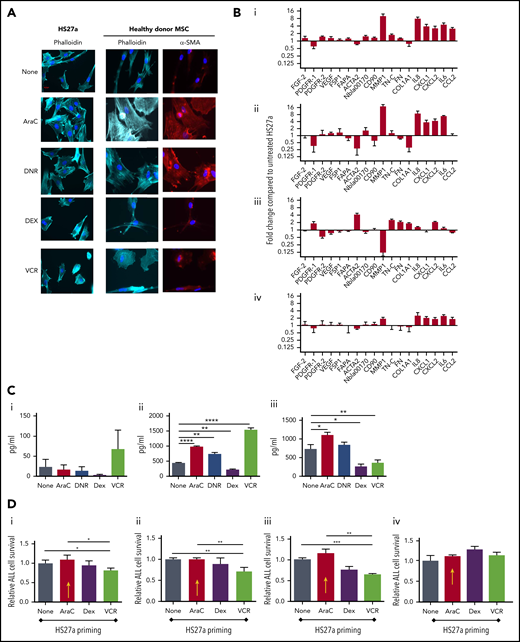
AraC and DNR activate MSCs, de novo which abrogates B-ALL target cell responses to chemotherapy agents in coculture. (A) Phalloidin, DAPI, or αSMA staining (original magnification ×40) of HS27a cells or healthy donor MSCs: at baseline or after exposure to the chemotherapy agents indicated. (B) Gene expression panel showing fold upregulation (compared with untreated) in HS27a cells after exposure to the chemotherapy agents AraC (i), DNR (ii), DEX (iii), and VCR (iv). (C) Cytokine bead assays for IL6 (i), IL8 (ii), and CCL2 (iii) (picograms per milliliter, y-axis) following exposure of HS27a cells to the chemotherapy agents indicated on the x-axis. All statistically significant comparisons (by unpaired Student t test) are as depicted: IL8, none vs AraC, P < .0001; IL8, none vs DNR, P = .002; IL8, none vs DEX, P = .001; and IL8, none vs VCR, P < .0001. CCL2, none vs AraC, P = .0169; CCL2, none vs DEX, P = .0166; and CCL2, none vs VCR, P = .0065. (D) MTS assays showing relative viability of SEM cells (y-axis) after treatment with AraC (i), DEX (ii), and VCR (iii) for 48 hours, after coculture with HS27a cells previously primed by chemotherapy before the treatment denoted on the x-axis. Data are shown relative to unprimed HS27a cells, set at 1. AraC-primed HS27a cells are highlighted throughout with a yellow arrow. All statistically significant comparisons (by unpaired Student t test) are as depicted: no pretreatment vs VCR, P = .041, and AraC vs VCR, P = .022 (i). No pretreatment vs VCR, P = .0087, and AraC vs VCR, P = .0087 (ii). No pretreatment vs VCR, P = .0006, AraC vs VCR, P = .0017 (iii). (iv) MTS assay showing relative viability of SEM cells (y-axis) after Transwell culture with primed HS27a cells as denoted on the x-axis. Data are relative to unprimed HS27a, set at 1. There are no statistically significant differences. All data are the mean ± SE of 3 independent experiments. *.01 < P ≤ .05; **.001 < P ≤ .01; ***.0001 < P ≤ .001; ****P ≤ .0001.
AraC and DNR activate MSCs, de novo which abrogates B-ALL target cell responses to chemotherapy agents in coculture. (A) Phalloidin, DAPI, or αSMA staining (original magnification ×40) of HS27a cells or healthy donor MSCs: at baseline or after exposure to the chemotherapy agents indicated. (B) Gene expression panel showing fold upregulation (compared with untreated) in HS27a cells after exposure to the chemotherapy agents AraC (i), DNR (ii), DEX (iii), and VCR (iv). (C) Cytokine bead assays for IL6 (i), IL8 (ii), and CCL2 (iii) (picograms per milliliter, y-axis) following exposure of HS27a cells to the chemotherapy agents indicated on the x-axis. All statistically significant comparisons (by unpaired Student t test) are as depicted: IL8, none vs AraC, P < .0001; IL8, none vs DNR, P = .002; IL8, none vs DEX, P = .001; and IL8, none vs VCR, P < .0001. CCL2, none vs AraC, P = .0169; CCL2, none vs DEX, P = .0166; and CCL2, none vs VCR, P = .0065. (D) MTS assays showing relative viability of SEM cells (y-axis) after treatment with AraC (i), DEX (ii), and VCR (iii) for 48 hours, after coculture with HS27a cells previously primed by chemotherapy before the treatment denoted on the x-axis. Data are shown relative to unprimed HS27a cells, set at 1. AraC-primed HS27a cells are highlighted throughout with a yellow arrow. All statistically significant comparisons (by unpaired Student t test) are as depicted: no pretreatment vs VCR, P = .041, and AraC vs VCR, P = .022 (i). No pretreatment vs VCR, P = .0087, and AraC vs VCR, P = .0087 (ii). No pretreatment vs VCR, P = .0006, AraC vs VCR, P = .0017 (iii). (iv) MTS assay showing relative viability of SEM cells (y-axis) after Transwell culture with primed HS27a cells as denoted on the x-axis. Data are relative to unprimed HS27a, set at 1. There are no statistically significant differences. All data are the mean ± SE of 3 independent experiments. *.01 < P ≤ .05; **.001 < P ≤ .01; ***.0001 < P ≤ .001; ****P ≤ .0001.
Next, we tested the concept that control of oxidative stress, via modification of ROS would explain the chemotherapy-induced support provided by activated MSCs to ALL cells. First, we showed that AraC and DNR treatment of SEM ALL directly elevated ROS (Figure 3Ai). VCR had no impact, whereas DEX reduced ROS. Figure 3Aii shows the functional impact in monoculture and coculture. Whereas all 4 drugs, as expected, readily killed SEM cells, coculture of SEM with HS27a MSCs lowered AraC-driven cell death by two thirds, DNR-driven death by one third, and VCR-driven death by about one half, but DEX-driven death, not at all. To confirm the relationship of ROS to the chemotherapy-induced MSC activation, we performed reversibility experiments with N-acetyl cysteine (NAC), a glutathione precursor antioxidant. NAC alone did not affect HS27a cells, whereas NAC prevented both AraC- and DNR-induced activation (Figure 3B). To confirm the critical functional role of ROS control by activated MSCs, we quantified ROS, apoptosis, and cell death of SEM ALL cells after AraC therapy, either alone or in coculture with HS27a MSCs. Although AraC significantly increased ROS in SEM cells in monoculture, ROS levels were significantly lowered in coculture with HS27a and were no longer affected by AraC (Figure 3Ci). The corresponding panels Cii and Ciii show that the MSC-mediated control of ROS significantly affected AraC-mediated SEM cell apoptosis and cell death, respectively. Cell–cell contact was critical: the chemoprotection of SEM by HS27a was completely lost without direct contact (Figure 3D). To further confirm the relevance of ROS, Figure 3E shows that NAC significantly reduced AraC-induced ROS and apoptosis. A reduction in cell death, albeit not statistically significant, was recorded.
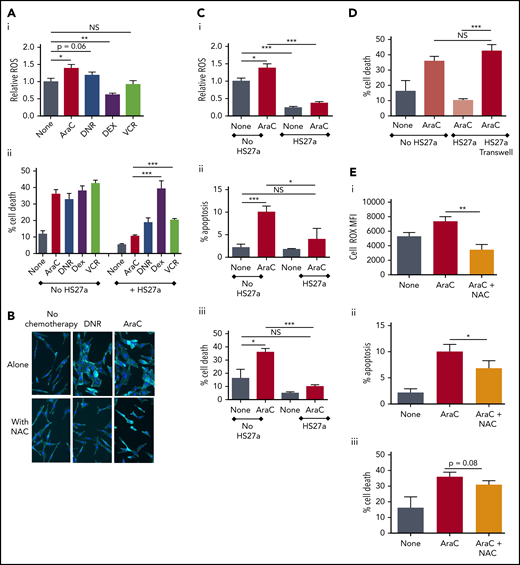
ROS promote CAF formation and MSC-mediated chemoprotection. (A) ROS levels relative to the untreated SEM baseline (1.0), y-axis, after exposure to chemotherapy agents indicated on the x-axis. Percentage cell death (DAPI+, y-axis) of SEM cells exposed to the chemotherapy agents indicated either in monoculture or during coculture with HS27a cells, all shown on the x-axis. Bars show the mean ± SE of 3 independent experiments. All statistically significant comparisons (by unpaired Student t test) are as depicted: (i) ROS level, none vs AraC, P = .0115; none vs DNR, P = .06, and none vs DEX, P = .0035. (ii) Percentage cell death, HS27a AraC vs DEX, P = .0007, and HS27a AraC vs VCR, P = .0003. (B) Phalloidin/DAPI staining of HS27a MSCs alone or exposed to DNR or AraC, with or without 5 mM NAC (original magnification ×20). (Ci) CellROX ROS assay showing the mitochondrial mass (y-axis) of SEM cells in monoculture, baseline set at 1.0, or after coculture with HS27a cells, with or without AraC (x-axis). Statistically significant comparisons (by unpaired Student t test) are as depicted: no HS27a none vs AraC, P = .0115; no HS27a vs HS27a none, P = .0002; and no HS27a+AraC vs HS27a+AraC, P = .0001. (ii) Percentage apoptosis (annexin V+, DAPI−, y-axis) of SEM cells in monoculture, baseline set at 1.0, or after coculture with HS27a cells, with or without AraC (x-axis). All statistically significant comparisons (by unpaired Student t test) are as depicted: no HS27a none vs AraC, P = .0009, and no HS27a+AraC vs HS27a+AraC, P = .0189. (iii) Cell death (DAPI+, y-axis) of SEM cells in monoculture, baseline set at 1.0 or after coculture with HS27a cells, with or without AraC. All statistically significant comparisons (by unpaired Student t test) are as depicted: no HS27a none vs AraC, P = .0102, and no HS27a+AraC vs HS27a+AraC, P = .0001. (D) Cell death (DAPI+, y-axis) of SEM cells in monoculture, with or without AraC, compared with SEM cocultured in contact with HS27a cells or in a Transwell, both with AraC (x-axis). All statistically significant comparisons (by unpaired Student t test) are as depicted: HS27a AraC vs HS27a Transwell+AraC, P = .0002. (E) ROS levels (i), apoptosis (ii), and cell death (iii) (y-axis), with no treatment, AraC treatment, or AraC treatment+NAC (x-axis). Bars show the mean ± SE of 3 independent experiments. Significant reductions in ROS (P = .002) and apoptosis (P = .0479) and a nonsignificant reduction in cell death (P = .08) by unpaired Student t test are shown. *.01 < P ≤ .05; **.001 < P ≤ .01; ***.0001 < P ≤ .001.
ROS promote CAF formation and MSC-mediated chemoprotection. (A) ROS levels relative to the untreated SEM baseline (1.0), y-axis, after exposure to chemotherapy agents indicated on the x-axis. Percentage cell death (DAPI+, y-axis) of SEM cells exposed to the chemotherapy agents indicated either in monoculture or during coculture with HS27a cells, all shown on the x-axis. Bars show the mean ± SE of 3 independent experiments. All statistically significant comparisons (by unpaired Student t test) are as depicted: (i) ROS level, none vs AraC, P = .0115; none vs DNR, P = .06, and none vs DEX, P = .0035. (ii) Percentage cell death, HS27a AraC vs DEX, P = .0007, and HS27a AraC vs VCR, P = .0003. (B) Phalloidin/DAPI staining of HS27a MSCs alone or exposed to DNR or AraC, with or without 5 mM NAC (original magnification ×20). (Ci) CellROX ROS assay showing the mitochondrial mass (y-axis) of SEM cells in monoculture, baseline set at 1.0, or after coculture with HS27a cells, with or without AraC (x-axis). Statistically significant comparisons (by unpaired Student t test) are as depicted: no HS27a none vs AraC, P = .0115; no HS27a vs HS27a none, P = .0002; and no HS27a+AraC vs HS27a+AraC, P = .0001. (ii) Percentage apoptosis (annexin V+, DAPI−, y-axis) of SEM cells in monoculture, baseline set at 1.0, or after coculture with HS27a cells, with or without AraC (x-axis). All statistically significant comparisons (by unpaired Student t test) are as depicted: no HS27a none vs AraC, P = .0009, and no HS27a+AraC vs HS27a+AraC, P = .0189. (iii) Cell death (DAPI+, y-axis) of SEM cells in monoculture, baseline set at 1.0 or after coculture with HS27a cells, with or without AraC. All statistically significant comparisons (by unpaired Student t test) are as depicted: no HS27a none vs AraC, P = .0102, and no HS27a+AraC vs HS27a+AraC, P = .0001. (D) Cell death (DAPI+, y-axis) of SEM cells in monoculture, with or without AraC, compared with SEM cocultured in contact with HS27a cells or in a Transwell, both with AraC (x-axis). All statistically significant comparisons (by unpaired Student t test) are as depicted: HS27a AraC vs HS27a Transwell+AraC, P = .0002. (E) ROS levels (i), apoptosis (ii), and cell death (iii) (y-axis), with no treatment, AraC treatment, or AraC treatment+NAC (x-axis). Bars show the mean ± SE of 3 independent experiments. Significant reductions in ROS (P = .002) and apoptosis (P = .0479) and a nonsignificant reduction in cell death (P = .08) by unpaired Student t test are shown. *.01 < P ≤ .05; **.001 < P ≤ .01; ***.0001 < P ≤ .001.
Next, we investigated the mechanism for the ROS-induced, MSC-mediated chemoprotection of ALL cells. Images of healthy donor and SEM cocultures taken after therapy with AraC show close contact (Figure 4A). By contrast, after treatment with VCR, contact between the cocultured cells was minimal. Based on published evidence of mitochondrial transfer between MSCs and ALL cells,12 we hypothesized that mitochondrial transfer between activated MSCs and B-ALL cells, via TNTs, could explain the CAF-mediated protection of ALL cells from ROS-inducing chemotherapy. First, we used a MitoTracker assay in which a fluorescent dye irreversibly labels mitochondria, to quantitate mitochondrial transfer. Figure 4Bi shows that mitochondrial transfer to B-ALL cells occurred after HS27a cells, stained earlier with MitoTracker, were cocultured with 3 different B-ALL cell lines (SD1, TOM-1, and SEM). This was in proportion to baseline ROS (data not shown). Cell–cell contact was obligatory; mitochondrial transfer was abolished by use of Transwells. Similarly, Figure 4Bii shows that spontaneous mitochondrial transfer to 3 primary ALL specimens, but not primary B cells, occurred after coculture with MitoTracker-stained, healthy donor MSCs. Figure 4Ci shows that AraC, but not VCR or DEX, stimulated the mitochondrial transfer to SEM ALL cells. We confirmed that NAC significantly abrogated both AraC- and DNR-stimulated mitochondrial transfer to SEM and REH ALL cells (Figure 4D). Next, we directly visualized the transfer of mitochondria along TNTs by time-lapse confocal imaging. The arrows in Figure 4E indicate the progress of 2 individual mitochondria over ∼20 minutes. Finally, to exclude any possibility of passive transfer of mitochondria, we used the murine stromal cell line MS5 as an alternative mitochondria donor. Murine mitochondrial, but not nuclear, DNA was clearly seen in flow cytometry–sorted SEM cells after coculture, both at baseline and at higher levels after AraC treatment (Figure 4F). Taken together, our data clearly suggest a role for mitochondrial transfer from activated MSCs to ALL cells, protecting the cells against ROS.
![AraC and DNR stimulate mitochondrial transfer from healthy donor or HS27a MSCs to ALL cells via TNTs. (A) Phalloidin and DAPI staining of SEM+HD MSC coculture incubated with AraC or VCR at original magnifications ×10 and ×40. Red arrows indicate SEM cells (round with prominent nuclei) in physical contact with MSCs. (Bi) Mitochondrial transfer by MitoTracker assay (mean fluorescence intensity [MFI], y-axis), from HS27a to SEM, TOM1, and SD1 ALL cells in contact or in a Transwell (x-axis). All data are the mean ± SE of 3 independent experiments. All statistically significant comparisons (by unpaired Student t test) are as depicted: SEM HS27a vs HS27a Transwell, P < .0001; TOM1 HS27a vs Transwell, P < .0001; and SD1 HS27a vs Transwell, P < .0001. (ii) Mitochondrial transfer by MitoTracker assay (MFI, y-axis), from healthy donor MSC to healthy donor B-cells (3 independent experiments) or patient ALL cells identified by UKALL14 trial number (UPN; x-axis). (C) Mitochondrial transfer by MitoTracker assay (MFI, y-axis) from HS27a to SEM after coculture and either no treatment or treatment with AraC, VCR, or DEX. All statistically significant comparisons (by unpaired Student t test) are as depicted: no treatment vs AraC, P < .0001; AraC vs DEX, P < .0001; and AraC vs VCR, P = .0003. (Di) Mitochondrial transfer by MitoTracker assay (MFI, y-axis) of SEM cells in coculture with HS27a MSCs after no treatment, AraC, or 5 mM AraC+NAC. All statistically significant comparisons (by unpaired Student t test) are as depicted: no treatment vs AraC, P < .0001, and AraC vs AraC+NAC, P < .0001. (ii) Mitochondrial mass by MitoTracker assay (MFI, y-axis) of SEM cells in coculture with HS27a MSCs after no treatment, DNR or 5 mM DNR+NAC. All statistically significant comparisons (by unpaired Student t test) are as depicted: no treatment vs DNR, P = .0002, and DNR vs DNR+NAC, P = .0002. (iii) Mitochondrial mass by MitoTracker assay of REH cells in coculture with HS27a MSCs after no treatment, AraC, or 5 mM AraC+NAC. All statistically significant comparisons (by unpaired Student t test) are as depicted: no treatment vs AraC, P < .0001, and AraC vs AraC+NAC, P < .0001. (E) Live-cell confocal imaging of HS27a cells, stained deep red with MitoTracker in coculture with SEM ALL cells stained with DiO. Images were taken at the time points indicated (3 minutes apart). The blue and green arrows each indicate the progression of 2 individual mitochondria along a TNT. (F) Agarose gel images showing PCR products from human nuclear and mitochondrial DNA and murine nuclear and mitochondrial DNA, as indicated in each quadrant. Lane 1, MS-5 murine MSCs; lane 2, SEM cells; lanes 3 to 5, SEM cells sorted after coculture with MS-5; lanes 6 to 8, SEM cells sorted after AraC-treated coculture with MS-5. Human nuclear DNA PCR in lane 5 failed. ***.0001 < P ≤ .001; ****P ≤ .0001.](https://ash.silverchair-cdn.com/ash/content_public/journal/blood/134/17/10.1182_blood.2019001398/2/m_bloodbld2019001398f4.png?Expires=1768807294&Signature=HcWQz6huZZiZYY3tNaKZUC6NIoqeVgQhszKmbUUEpydRYKYLFAtMcjP3chJqGEk5cPYqa4TsYerLeghidON-ewaxPQPf9qeGU0ZRmHG1cz~-JqPE-floWVhK5OoKW-f~STQQ4n28sNEYFsIuuSWnTHKpwfrP5PKnsyDIarH4qLWDHXfoS9bgxI3TYyrZi8vmFH3SC1n0Co0YQ-nwBE7-KJGX7cF5PUrbTdJhIirjMczJMHFg8BebVuFRUYhBnSwGcFTEf6EKWKtjvYxUIm95VdEiNk~gMCGTodTlJVh9v2CueitfH~ARnFSXT4zM6MaA0QHMH2G5stguGnt~NZPUnA__&Key-Pair-Id=APKAIE5G5CRDK6RD3PGA)
AraC and DNR stimulate mitochondrial transfer from healthy donor or HS27a MSCs to ALL cells via TNTs. (A) Phalloidin and DAPI staining of SEM+HD MSC coculture incubated with AraC or VCR at original magnifications ×10 and ×40. Red arrows indicate SEM cells (round with prominent nuclei) in physical contact with MSCs. (Bi) Mitochondrial transfer by MitoTracker assay (mean fluorescence intensity [MFI], y-axis), from HS27a to SEM, TOM1, and SD1 ALL cells in contact or in a Transwell (x-axis). All data are the mean ± SE of 3 independent experiments. All statistically significant comparisons (by unpaired Student t test) are as depicted: SEM HS27a vs HS27a Transwell, P < .0001; TOM1 HS27a vs Transwell, P < .0001; and SD1 HS27a vs Transwell, P < .0001. (ii) Mitochondrial transfer by MitoTracker assay (MFI, y-axis), from healthy donor MSC to healthy donor B-cells (3 independent experiments) or patient ALL cells identified by UKALL14 trial number (UPN; x-axis). (C) Mitochondrial transfer by MitoTracker assay (MFI, y-axis) from HS27a to SEM after coculture and either no treatment or treatment with AraC, VCR, or DEX. All statistically significant comparisons (by unpaired Student t test) are as depicted: no treatment vs AraC, P < .0001; AraC vs DEX, P < .0001; and AraC vs VCR, P = .0003. (Di) Mitochondrial transfer by MitoTracker assay (MFI, y-axis) of SEM cells in coculture with HS27a MSCs after no treatment, AraC, or 5 mM AraC+NAC. All statistically significant comparisons (by unpaired Student t test) are as depicted: no treatment vs AraC, P < .0001, and AraC vs AraC+NAC, P < .0001. (ii) Mitochondrial mass by MitoTracker assay (MFI, y-axis) of SEM cells in coculture with HS27a MSCs after no treatment, DNR or 5 mM DNR+NAC. All statistically significant comparisons (by unpaired Student t test) are as depicted: no treatment vs DNR, P = .0002, and DNR vs DNR+NAC, P = .0002. (iii) Mitochondrial mass by MitoTracker assay of REH cells in coculture with HS27a MSCs after no treatment, AraC, or 5 mM AraC+NAC. All statistically significant comparisons (by unpaired Student t test) are as depicted: no treatment vs AraC, P < .0001, and AraC vs AraC+NAC, P < .0001. (E) Live-cell confocal imaging of HS27a cells, stained deep red with MitoTracker in coculture with SEM ALL cells stained with DiO. Images were taken at the time points indicated (3 minutes apart). The blue and green arrows each indicate the progression of 2 individual mitochondria along a TNT. (F) Agarose gel images showing PCR products from human nuclear and mitochondrial DNA and murine nuclear and mitochondrial DNA, as indicated in each quadrant. Lane 1, MS-5 murine MSCs; lane 2, SEM cells; lanes 3 to 5, SEM cells sorted after coculture with MS-5; lanes 6 to 8, SEM cells sorted after AraC-treated coculture with MS-5. Human nuclear DNA PCR in lane 5 failed. ***.0001 < P ≤ .001; ****P ≤ .0001.
AraC and DNR stimulate mitochondrial transfer from healthy donor or HS27a MSCs to ALL cells via TNTs. (A) Phalloidin and DAPI staining of SEM+HD MSC coculture incubated with AraC or VCR at original magnifications ×10 and ×40. Red arrows indicate SEM cells (round with prominent nuclei) in physical contact with MSCs. (Bi) Mitochondrial transfer by MitoTracker assay (mean fluorescence intensity [MFI], y-axis), from HS27a to SEM, TOM1, and SD1 ALL cells in contact or in a Transwell (x-axis). All data are the mean ± SE of 3 independent experiments. All statistically significant comparisons (by unpaired Student t test) are as depicted: SEM HS27a vs HS27a Transwell, P < .0001; TOM1 HS27a vs Transwell, P < .0001; and SD1 HS27a vs Transwell, P < .0001. (ii) Mitochondrial transfer by MitoTracker assay (MFI, y-axis), from healthy donor MSC to healthy donor B-cells (3 independent experiments) or patient ALL cells identified by UKALL14 trial number (UPN; x-axis). (C) Mitochondrial transfer by MitoTracker assay (MFI, y-axis) from HS27a to SEM after coculture and either no treatment or treatment with AraC, VCR, or DEX. All statistically significant comparisons (by unpaired Student t test) are as depicted: no treatment vs AraC, P < .0001; AraC vs DEX, P < .0001; and AraC vs VCR, P = .0003. (Di) Mitochondrial transfer by MitoTracker assay (MFI, y-axis) of SEM cells in coculture with HS27a MSCs after no treatment, AraC, or 5 mM AraC+NAC. All statistically significant comparisons (by unpaired Student t test) are as depicted: no treatment vs AraC, P < .0001, and AraC vs AraC+NAC, P < .0001. (ii) Mitochondrial mass by MitoTracker assay (MFI, y-axis) of SEM cells in coculture with HS27a MSCs after no treatment, DNR or 5 mM DNR+NAC. All statistically significant comparisons (by unpaired Student t test) are as depicted: no treatment vs DNR, P = .0002, and DNR vs DNR+NAC, P = .0002. (iii) Mitochondrial mass by MitoTracker assay of REH cells in coculture with HS27a MSCs after no treatment, AraC, or 5 mM AraC+NAC. All statistically significant comparisons (by unpaired Student t test) are as depicted: no treatment vs AraC, P < .0001, and AraC vs AraC+NAC, P < .0001. (E) Live-cell confocal imaging of HS27a cells, stained deep red with MitoTracker in coculture with SEM ALL cells stained with DiO. Images were taken at the time points indicated (3 minutes apart). The blue and green arrows each indicate the progression of 2 individual mitochondria along a TNT. (F) Agarose gel images showing PCR products from human nuclear and mitochondrial DNA and murine nuclear and mitochondrial DNA, as indicated in each quadrant. Lane 1, MS-5 murine MSCs; lane 2, SEM cells; lanes 3 to 5, SEM cells sorted after coculture with MS-5; lanes 6 to 8, SEM cells sorted after AraC-treated coculture with MS-5. Human nuclear DNA PCR in lane 5 failed. ***.0001 < P ≤ .001; ****P ≤ .0001.
To further confirm the functional relevance of mitochondrial transfer, we studied the extent to which inhibition of mitochondrial transfer affected the ability of MSC-CAFs to protect ALL cells. First, we generated HS27a cells deficient in mitochondria after prolonged culture with low-dose ethidium bromide and uridine, which selectively depletes mitochondrial DNA.13,14 Depletion was confirmed by PCR for mitochondrial DNA and MitoTracker imaging in depleted cells and nondepleted controls (Figure 5Ai-ii). The mitochondria-depleted HS27a cells retained viability, became activated, and retained capability to interact with SEM cells, as imaged in Figure 5Aiii. However, the mitochondria-depleted HS27a cells were clearly defective in their ability to rescue SEM ALL cells from AraC-induced apoptosis (Figure 5Aiv) and cell death (Figure 5Av). Next, we used various microtubule inhibitors to block mitochondrial transfer. Figure 5B shows that both the actin polymerization inhibitor latrunculin-B and the microtubule inhibitor nocodazole significantly blocked AraC-stimulated mitochondrial transfer from HS27a to ALL cells. Then, we quantified the impact of blocking mitochondrial transfer on AraC-mediated SEM cell death using the HS27a/SEM coculture system. First, we confirmed that none of the agents used was directly toxic to HS27a or SEM cells in monoculture with the exception of VCR and SEM (Figure 5Ci-ii). In the HS27a/SEM coculture, latrunculin-B, nocodazole, and colchicine all partially, but significantly, ablated HS27a MSC-mediated protection from AraC (Figure 5Bii). VCR entirely ablated the protection, completely restoring AraC toxicity with superadded SEM cell killing, caused by its own cytotoxic properties. The morphological changes seen in activated HS27a cells are altered by nocodazole and colchicine by a clear diminution of visible connections between cells, despite the lack of impact on HS27a viability (Figure 5Ciii).
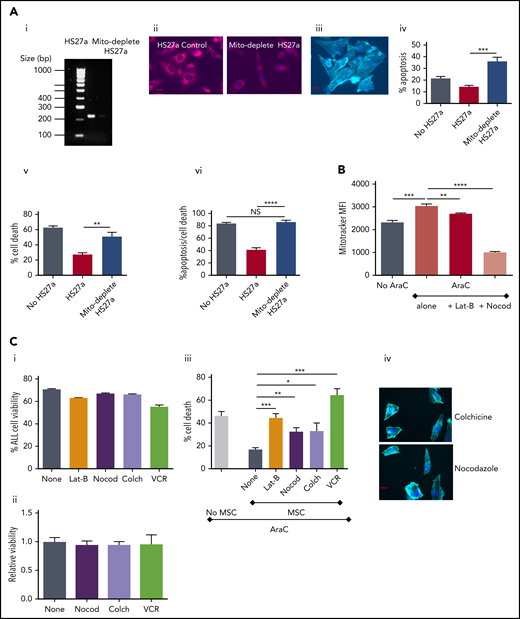
Microtubule inhibition blocks mitochondrial transfer and releases ALL cells from ROS-induced, MSC-mediated protection. (Ai) Agarose gel with PCR products from amplification of HS27a mitochondrial DNA, with or without mitochondrial depletion. (ii) Fluorescence microscopy imaging of MitoTracker dye in HS27a cells, with or without mitochondrial depletion. (iii) Imaging (original magnification ×40) of mitochondrially depleted (mito-depleted) HS27a cells in culture with SEM cells after phalloidin and DAPI staining. (iv) Percentage of apoptosis (annexin V+, DAPI−, y-axis) of SEM cells treated with AraC, SEM cells cocultured with HS27a treated with AraC, or SEM cocultured with HS27a mito-depleted cells treated with AraC (x-axis). All statistically significant comparisons (by unpaired Student t test) are as depicted: HS27a vs mito-depleted HS27a cells, P = .0008. (v) Percentage cell death (DAPI+, y-axis) of SEM cells treated with AraC, cocultured with HS27a treated with AraC, or cocultured with HS27a mito-depleted cells treated with AraC (x-axis). All statistically significant comparisons (by unpaired Student t test) are as depicted: MH27a vs mito-depleted HS27a, P = .0043. (vi) Percentage cell death or apoptosis (DAPI+ or annexin V+/DAPI−, y-axis) of SEM cells+AraC, SEM cells cocultured with HS27a cells+AraC, or SEM cells cocultured with mito-depleted HS27a+AraC (x-axis). All data are the mean ± SE of results in 3 independent experiments. All statistically significant comparisons (by unpaired Student t test) are as depicted: MH27a vs mito-depleted HS27a cells, P < .0001. (B) Mitochondrial transfer from HS27a to SEM cells after microtubule-damaging blockade. (MitoTracker MFI, y-axis). The baseline condition is coculture with no added agents; all other conditions are AraC treated, either alone or with latrunculin-B (lat-B) and nocodazole (nocod) (x-axis). All statistically significant comparisons (by unpaired Student t test) are as depicted: none vs AraC, P = .0005; AraC vs AraC+lat-B, P = .0028; and AraC vs AraC+nocod, P < .0001. (Ci) Percentage viability (y-axis) after treatment of SEM ALL cells with the agents indicated (x-axis). (ii) Relative viability (y-axis) after treatment of HS27a cells with the agents indicated (x-axis). (iii) Percentage cell death (y-axis) after AraC-treatment of SEM, either in monoculture or coculture with HS27a cells, alone or with lat-B+nocod, colchicine, or VCR added (x-axis). All data are the mean ± SE of 3 independent experiments. All statistically significant comparisons (by unpaired Student t test) are as depicted: MSC none vs lat-B, P = .0004; MSC none vs nocod, P = .0018; MSC none vs colchicine, P = .0167; and MSC none vs VCR, P = .0002. (iv) Phalloidin and DAPI staining of HS27a (original magnification ×40) after exposure to nocodazole or colchicine. *.01 < P ≤ .05; **.001 < P ≤ .01; ***.0001 < P ≤ .001; ****P ≤ .0001.
Microtubule inhibition blocks mitochondrial transfer and releases ALL cells from ROS-induced, MSC-mediated protection. (Ai) Agarose gel with PCR products from amplification of HS27a mitochondrial DNA, with or without mitochondrial depletion. (ii) Fluorescence microscopy imaging of MitoTracker dye in HS27a cells, with or without mitochondrial depletion. (iii) Imaging (original magnification ×40) of mitochondrially depleted (mito-depleted) HS27a cells in culture with SEM cells after phalloidin and DAPI staining. (iv) Percentage of apoptosis (annexin V+, DAPI−, y-axis) of SEM cells treated with AraC, SEM cells cocultured with HS27a treated with AraC, or SEM cocultured with HS27a mito-depleted cells treated with AraC (x-axis). All statistically significant comparisons (by unpaired Student t test) are as depicted: HS27a vs mito-depleted HS27a cells, P = .0008. (v) Percentage cell death (DAPI+, y-axis) of SEM cells treated with AraC, cocultured with HS27a treated with AraC, or cocultured with HS27a mito-depleted cells treated with AraC (x-axis). All statistically significant comparisons (by unpaired Student t test) are as depicted: MH27a vs mito-depleted HS27a, P = .0043. (vi) Percentage cell death or apoptosis (DAPI+ or annexin V+/DAPI−, y-axis) of SEM cells+AraC, SEM cells cocultured with HS27a cells+AraC, or SEM cells cocultured with mito-depleted HS27a+AraC (x-axis). All data are the mean ± SE of results in 3 independent experiments. All statistically significant comparisons (by unpaired Student t test) are as depicted: MH27a vs mito-depleted HS27a cells, P < .0001. (B) Mitochondrial transfer from HS27a to SEM cells after microtubule-damaging blockade. (MitoTracker MFI, y-axis). The baseline condition is coculture with no added agents; all other conditions are AraC treated, either alone or with latrunculin-B (lat-B) and nocodazole (nocod) (x-axis). All statistically significant comparisons (by unpaired Student t test) are as depicted: none vs AraC, P = .0005; AraC vs AraC+lat-B, P = .0028; and AraC vs AraC+nocod, P < .0001. (Ci) Percentage viability (y-axis) after treatment of SEM ALL cells with the agents indicated (x-axis). (ii) Relative viability (y-axis) after treatment of HS27a cells with the agents indicated (x-axis). (iii) Percentage cell death (y-axis) after AraC-treatment of SEM, either in monoculture or coculture with HS27a cells, alone or with lat-B+nocod, colchicine, or VCR added (x-axis). All data are the mean ± SE of 3 independent experiments. All statistically significant comparisons (by unpaired Student t test) are as depicted: MSC none vs lat-B, P = .0004; MSC none vs nocod, P = .0018; MSC none vs colchicine, P = .0167; and MSC none vs VCR, P = .0002. (iv) Phalloidin and DAPI staining of HS27a (original magnification ×40) after exposure to nocodazole or colchicine. *.01 < P ≤ .05; **.001 < P ≤ .01; ***.0001 < P ≤ .001; ****P ≤ .0001.
Because of the clinical importance of combination therapy in the treatment of ALL, we confirmed that combining AraC or DNR with VCR or DEX could block key aspects of MSC activation. Both AraC and DNR activate HS27a MSCs (Figure 6A), but when either drug is used together with VCR or DEX, the morphological hallmarks of activation do not occur, nor does the typical CAF cytokine secretion profile (Figure 6B).
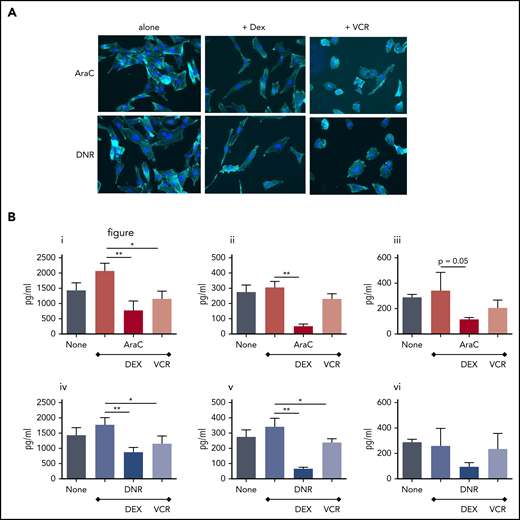
Combining VCR or Dex with AraC or DNR prevents HS27a MSCs from developing the characteristic pathology and cytokine secretion patterns of CAF. (A) Phalloidin/DAPI staining of AraC or DNR-treated HS27a cells, either alone or with VCR or DEX (original magnification ×20). (B) Cytokines and chemokines IL8 (i,iv), IL6 (ii,v), and CCL2 (iii,vi) secreted by HS27a after AraC (i-iii) or DNR (iv-vi) treatment, alone or with DEX or VCR. All statistically significant comparisons (by unpaired Student t test) are as depicted: IL8 AraC vs AraC+DEX, P = .0049; AraC vs AraC+VCR, P = .0112; IL6 AraC vs AraC+DEX, P = .0005; CCL2 AraC vs AraC+DEX, P = .05; IL8 DNR vs DNR+DEX, P = .0053; DNR vs DNR+VCR, P = .0364; IL6 DNR vs DNR+DEX, P = .0011; and DNR vs DNR+VCR, P = .04. *.01 < P ≤ .05; **.001 < P ≤ .01.
Combining VCR or Dex with AraC or DNR prevents HS27a MSCs from developing the characteristic pathology and cytokine secretion patterns of CAF. (A) Phalloidin/DAPI staining of AraC or DNR-treated HS27a cells, either alone or with VCR or DEX (original magnification ×20). (B) Cytokines and chemokines IL8 (i,iv), IL6 (ii,v), and CCL2 (iii,vi) secreted by HS27a after AraC (i-iii) or DNR (iv-vi) treatment, alone or with DEX or VCR. All statistically significant comparisons (by unpaired Student t test) are as depicted: IL8 AraC vs AraC+DEX, P = .0049; AraC vs AraC+VCR, P = .0112; IL6 AraC vs AraC+DEX, P = .0005; CCL2 AraC vs AraC+DEX, P = .05; IL8 DNR vs DNR+DEX, P = .0053; DNR vs DNR+VCR, P = .0364; IL6 DNR vs DNR+DEX, P = .0011; and DNR vs DNR+VCR, P = .04. *.01 < P ≤ .05; **.001 < P ≤ .01.
To demonstrate in vivo relevance, we generated a disseminated model of ALL by tail vein injection of 2 × 10⁶ blue fluorescent protein/luciferase–labeled SEM cells. The experimental schema is shown in supplemental Figure 1. Three days after confirmed engraftment, mice were treated with PBS control, AraC, VCR, or nocodazole and euthanized 3 days later. All agents except PBS control rapidly reduced the leukemia burden (Figure 7Ai-ii). MSCs, isolated and cultured from the murine bone marrow after AraC, showed the typical appearance of CAF by phalloidin, DAPI, and αSMA expression, which was not evident in control-treated mice (Figure 7Bi-ii). As shown in Figure 7C, both ROS levels (Figure 7Ci) and mitochondrial mass (Figure 7Cii) were significantly elevated in SEM cells after AraC (but not control), VCR, or nocodazole treatment of the mice. The presence of murine mitochondrial, but not nuclear, DNA in AraC-treated and sorted SEM cells is shown in supplemental Figure 2. Figure 7D shows CD19 (brown) and nestin (pink) staining of sections of femur. Red boxes highlight CD19 ALL cells closely associated with the nestin-stained niche in the AraC, but not in the VCR condition. The complete histopathology set is shown in supplemental Figure 3. In a therapeutic experiment, 5 mice per group were treated to a humane end point with PBS, AraC, VCR, or AraC+VCR. Figure 7Eii shows that only the AraC+VCR combination improved survival compared with the PBS control. In a separate cohort, where mice were euthanized 3 days after treatment, mitochondrial mass had increased in the SEM cells in response to AraC, but not to VCR, and was at an intermediate level after AraC+VCR combination (Figure 7Eii).
![AraC, but not vincristine or nocodazole, increases ROS and mitochondrial transfer from MSCs to ALL cells in a murine xenograft model of ALL and stimulates formation of a nestin+niche. (A) Live imaging of tumor burden at days −3 and +3, with respect to the treatments given. (i) Images with color scale bar and control mice are shown. (ii) Quantification of the luciferase expression with region of intensity units on the y-axis and experimental conditions on the x-axis. PBS vs AraC, P = .0026; PBS vs VCR, P = .0023 and for PBS vs nocodazole, P = .0098. (Bi) αSMA staining of MSCs isolated and expanded from 1 control and 1 AraC-treated mouse (original magnification ×40). (ii) Phalloidin/DAPI staining of MSCs isolated and expanded from 3 control, AraC, VCR, and nocodazole-treated mice (original magnification ×20). ROS (mean fluorescence intensity [MFI], y-axis) (Ci) and mitochondrial mass (green MitoTracker MFI, y-axis) (ii) after treatment of mice bearing SEM xenografts with the agents indicated (x-axis). Cells were harvested from mice at day +3 after treatment with control, AraC, VCR, or nocodazole. All statistically significant comparisons (by unpaired Student t test) are as depicted. (i) ROS: PBS vs Ara-C, P = .0053, and (ii) MitoTacker mass: PBS vs AraC, P = .0014. (D) Immunohistochemistry of sections of representative whole femora from AraC- and VCR-treated mice. Femora are dual stained with human CD19 (brown) and murine nestin (pink). (i) In the AraC example, CD19+ cells are seen closely associating with a nestin+ niche, as indicated by the red boxes. (ii) In the VCR example, CD19+ cells (brown boxes) are not associated with nestin+ cells (pink boxes). (Ei) Mitochondrial mass (green MitoTracker MFI, y-axis) after treatment of mice bearing SEM xenografts with the agents indicated. SEM cells were harvested from mice treated with PBS, AraC, VCR, or AraC+VCR at day +3 after treatment with control, AraC, VCR, or AraC+VCR. (ii) Kaplan-Meier survival curves (n = 5 mice per group) for mice treated with PBS (blue), AraC (red), VCR (green), and AraC+VCR (purple). All statistically significant comparisons (by unpaired Student t test) are as depicted: PBS vs AraC, P < .0001, and AraC vs VCR, P < .0001. Survival of AraC+VCR-treated mice was significantly greater than that of each of the other 3 groups, by Mantel-Cox test: PBS vs AraC+VCR, P = .0253; AraC vs AraC+VCR, P = .0080; and VCR vs AraC+VCR .0305. **.001 < P ≤ .01; ****P ≤ .0001.](https://ash.silverchair-cdn.com/ash/content_public/journal/blood/134/17/10.1182_blood.2019001398/2/m_bloodbld2019001398f7.png?Expires=1768807294&Signature=rzXR3aoZLXgS7tgha~XnKa9gQdbGhlKDsUxozss9WUWgOzDzpO8Ey1DqK~K7P89f9k03sn0Ky8bjufFHFQd4PJZgzczsFnP4qioELwM~9lAWhgtaKGX7MZTA3JlYSiL68yox6sBERsDNiur9kp6IYX9WBECyEW7c0SONN~tBcab2odh5wgUidEmeDMKqB70TAdFffRKKORA3nbf~80gy2jaw6yEt8ODzQXkj-jzaq1XsAayzj4gilr140b0eZY38h-bBPl77qvrm4FwYF~hEzMk~Eyp2rwCWCrM31bRHrtl~aLuTdESNxTTVZ01evna4oDT0IHYavyMTb3xPlDn2kg__&Key-Pair-Id=APKAIE5G5CRDK6RD3PGA)
AraC, but not vincristine or nocodazole, increases ROS and mitochondrial transfer from MSCs to ALL cells in a murine xenograft model of ALL and stimulates formation of a nestin+niche. (A) Live imaging of tumor burden at days −3 and +3, with respect to the treatments given. (i) Images with color scale bar and control mice are shown. (ii) Quantification of the luciferase expression with region of intensity units on the y-axis and experimental conditions on the x-axis. PBS vs AraC, P = .0026; PBS vs VCR, P = .0023 and for PBS vs nocodazole, P = .0098. (Bi) αSMA staining of MSCs isolated and expanded from 1 control and 1 AraC-treated mouse (original magnification ×40). (ii) Phalloidin/DAPI staining of MSCs isolated and expanded from 3 control, AraC, VCR, and nocodazole-treated mice (original magnification ×20). ROS (mean fluorescence intensity [MFI], y-axis) (Ci) and mitochondrial mass (green MitoTracker MFI, y-axis) (ii) after treatment of mice bearing SEM xenografts with the agents indicated (x-axis). Cells were harvested from mice at day +3 after treatment with control, AraC, VCR, or nocodazole. All statistically significant comparisons (by unpaired Student t test) are as depicted. (i) ROS: PBS vs Ara-C, P = .0053, and (ii) MitoTacker mass: PBS vs AraC, P = .0014. (D) Immunohistochemistry of sections of representative whole femora from AraC- and VCR-treated mice. Femora are dual stained with human CD19 (brown) and murine nestin (pink). (i) In the AraC example, CD19+ cells are seen closely associating with a nestin+ niche, as indicated by the red boxes. (ii) In the VCR example, CD19+ cells (brown boxes) are not associated with nestin+ cells (pink boxes). (Ei) Mitochondrial mass (green MitoTracker MFI, y-axis) after treatment of mice bearing SEM xenografts with the agents indicated. SEM cells were harvested from mice treated with PBS, AraC, VCR, or AraC+VCR at day +3 after treatment with control, AraC, VCR, or AraC+VCR. (ii) Kaplan-Meier survival curves (n = 5 mice per group) for mice treated with PBS (blue), AraC (red), VCR (green), and AraC+VCR (purple). All statistically significant comparisons (by unpaired Student t test) are as depicted: PBS vs AraC, P < .0001, and AraC vs VCR, P < .0001. Survival of AraC+VCR-treated mice was significantly greater than that of each of the other 3 groups, by Mantel-Cox test: PBS vs AraC+VCR, P = .0253; AraC vs AraC+VCR, P = .0080; and VCR vs AraC+VCR .0305. **.001 < P ≤ .01; ****P ≤ .0001.
AraC, but not vincristine or nocodazole, increases ROS and mitochondrial transfer from MSCs to ALL cells in a murine xenograft model of ALL and stimulates formation of a nestin+niche. (A) Live imaging of tumor burden at days −3 and +3, with respect to the treatments given. (i) Images with color scale bar and control mice are shown. (ii) Quantification of the luciferase expression with region of intensity units on the y-axis and experimental conditions on the x-axis. PBS vs AraC, P = .0026; PBS vs VCR, P = .0023 and for PBS vs nocodazole, P = .0098. (Bi) αSMA staining of MSCs isolated and expanded from 1 control and 1 AraC-treated mouse (original magnification ×40). (ii) Phalloidin/DAPI staining of MSCs isolated and expanded from 3 control, AraC, VCR, and nocodazole-treated mice (original magnification ×20). ROS (mean fluorescence intensity [MFI], y-axis) (Ci) and mitochondrial mass (green MitoTracker MFI, y-axis) (ii) after treatment of mice bearing SEM xenografts with the agents indicated (x-axis). Cells were harvested from mice at day +3 after treatment with control, AraC, VCR, or nocodazole. All statistically significant comparisons (by unpaired Student t test) are as depicted. (i) ROS: PBS vs Ara-C, P = .0053, and (ii) MitoTacker mass: PBS vs AraC, P = .0014. (D) Immunohistochemistry of sections of representative whole femora from AraC- and VCR-treated mice. Femora are dual stained with human CD19 (brown) and murine nestin (pink). (i) In the AraC example, CD19+ cells are seen closely associating with a nestin+ niche, as indicated by the red boxes. (ii) In the VCR example, CD19+ cells (brown boxes) are not associated with nestin+ cells (pink boxes). (Ei) Mitochondrial mass (green MitoTracker MFI, y-axis) after treatment of mice bearing SEM xenografts with the agents indicated. SEM cells were harvested from mice treated with PBS, AraC, VCR, or AraC+VCR at day +3 after treatment with control, AraC, VCR, or AraC+VCR. (ii) Kaplan-Meier survival curves (n = 5 mice per group) for mice treated with PBS (blue), AraC (red), VCR (green), and AraC+VCR (purple). All statistically significant comparisons (by unpaired Student t test) are as depicted: PBS vs AraC, P < .0001, and AraC vs VCR, P < .0001. Survival of AraC+VCR-treated mice was significantly greater than that of each of the other 3 groups, by Mantel-Cox test: PBS vs AraC+VCR, P = .0253; AraC vs AraC+VCR, P = .0080; and VCR vs AraC+VCR .0305. **.001 < P ≤ .01; ****P ≤ .0001.
In summary, we identified and cultured CAFs directly from the bone marrow of patients with ALL who were undergoing chemotherapy. We modeled the activation process, which could be blocked by antioxidants, in vitro and in vivo by administration of ROS-inducing chemotherapy drugs. Transfer of mitochondria from CAFs, along TNTs, prevented cell death from ROS-inducing chemotherapy in ALL cells. This cytoprotective process was interrupted, in vitro and in vivo, by agents that disrupt microtubule formation.
Discussion
We showed that MSCs isolated from the primary bone marrow of patients in treatment for ALL commonly adopt an activated, cancer-associated fibroblast-like phenotype with cytoskeletal and gene expression changes and high-level proinflammatory cytokine secretion. The primary patient data are intriguing but predominantly hypothesis generating, being limited by lack of access to longitudinal specimens. However, this does not detract from our frequent identification of CAFs, the most abundant mesenchymal cell type present within most human carcinomas,15 but not previously shown in ALL. Among the key characteristics of the primary patient CAFs were a 16- to 64-fold increase in transcription of MMP1, a two- to eightfold increase in transcription of Nbla00170 (nestin), and proinflammatory cytokine secretion, all consistent with descriptions of CAFs in solid tumors.16
To assess the mechanism of CAF generation of activated MSCs and to understand their functional properties in supporting ALL targets,17 we used in vitro and in vivo niche models. We easily modeled CAF formation from healthy donor or HS27a MSCs in vitro, using AraC and DNR at clinically relevant concentrations. The in vitro, chemoactivated MSCs appeared morphologically identical with the primary patient CAFs, with a very similar GEP and cytokine secretion pattern in our targeted panels. Activation clearly related to an AraC- or DNR-mediated rise in intracellular ROS and was readily blocked by the antioxidant NAC. AraC-mediated increases in SEM target cell ROS levels were closely coupled to apoptosis and cell death in monoculture, but when cocultured with MSCs, target cell ROS levels, apoptosis, and cell death were highly significantly abrogated. Cell–cell contact was clearly required for the process of rescue from oxidative stress; rescue was absent when a Transwell was used. A further dissection of the species ROS is important and ongoing.
We identified mitochondrial transfer through actin-containing TNTs as the mechanism by which this MSC-mediated protection occurred. Although it is known that ALL cells can use TNTs to communicate with MSCs12 and transfer of mitochondria between cell types is a well-described phenomenon,18-22 the transfer of mitochondria in direct relationship to chemoprotection from ROS-inducing therapy, has not been described and is of particular and immediate relevance to the therapy of ALL. The 4 drugs we used in our model are the mainstays of ALL treatment. Hyper-CVAD,17 one of the most common therapeutic protocols used internationally for the treatment of ALL includes repeating blocks of relatively dose-intensive AraC given without VCR or DEX. Our work demonstrates that when VCR or DEX are combined with AraC or DNR, HS27a MSCs do not develop the cytopathological hallmarks of activated MSCs. All these findings, from the activation of MSCs through to demonstration of mitochondrial transfer, were recapitulated in a murine model.
Our data shed light on a prior study that showed that preleukemic stem cells cultured in a nichelike environment with MSCs are uniformly sensitive to all microtubule-damaging drugs or corticosteroids tested, in contrast to their resistance to the large majority of the other 1904 compounds tested.23 The reason for those findings was not clear at the time, but our data suggest that support from the niche provides an explanation. Our work is also consistent with evidence from solid organ malignancies,24,25 in which activation of stromal cells with cytotoxic chemotherapy induces a stromal cell state, characterized by enhanced ELR-motif cytokine secretion which aids cancer cell survival. Our data give strong support to the use of stromal systems for drug discovery in ALL, as described by Frismantas et al,26 and are also consistent with the findings of Ede et al27 in which MSCs protected T-ALL from ROS-inducing parthenolide, although release of thiols was described as the mechanism. Clearly, there are multiple mechanisms at play in these complex niches. Of particular note is the association of human CD19+ cells with a nestin+ niche in the murine femora from AraC-treated mice. Mendez-Ferrer at al28 have previously shown that nestin+ MSCs represent a bona fide bone marrow niche with a close physical interaction with hematopoietic stem cells, and furthermore, that they can transfer mitochondria to AML cells.29
In summary, the results of our work couples with previously disparate strands of evidence from the solid tumors with decades-old clinical observations in ALL, to develop a new, clinically testable hypothesis on prevention of chemoresistance in ALL. We plan to directly test our observations in a proposed randomized clinical trial (UKALL15) comparing our current, standard-of-care regimen with one wherein VCR and DEX are always given together with ROS-inducing agents such as AraC and DNR, and appropriate longitudinal specimens are collected to assess the relationship between MSC activation and outcome in clinical specimens.
Data may be obtained by e-mail to the corresponding author.
The online version of this article contains a data supplement.
The publication costs of this article were defrayed in part by page charge payment. Therefore, and solely to indicate this fact, this article is hereby marked “advertisement” in accordance with 18 USC section 1734.
Acknowledgments
The authors thank Bingli Liu for her contribution to this project. A.K.F. thanks the 2018 European Haematology Association/American Society of Hematology Translational Research Training in Hematology Program faculty and students for helpful discussions.
R.B. was supported by the CRUK-UCL Centre Award/Clinical Training Award Cycle 2 (A20937) and a Lady Tata Memorial Trust International Award. The UKALL14 trial was funded by CRUK grant CRUK/09/006 (A.K.F.). The UKALL14 biobank was funded by grant C27995/A21019 (A.K.F.) and Anthony V. Moorman from CRUK.
Authorship
Contribution: R.B. designed and performed the experiments and wrote the paper. A.D. designed and performed the experiments; S.A., A.A., K.B., M.A., S.H., S.-W.L., T.M., R.J.M., R.C.M., K.C.Y.N., I.P., C.P., and K.Z.-A. performed the experiments; W.D. advised and assisted with the flow cytometry; A.K. supplied and analyzed the clinical data; K.K. advised on experimental design; C.L.C. designed and critically evaluated the experiments; J.M. advised and assisted with the imaging; M.R.M. critically evaluated the experiments and provided supervision; E.S. designed and critically evaluated the experiments and provided reagents; A.K.F. conceived the project, obtained funding, designed and critically evaluated the experiments, provided supervision, and wrote the paper; and all authors read and commented on the paper and approved the final version.
Conflict-of-interest disclosure: The authors declare no competing financial interests.
Correspondence: Adele K. Fielding, UCL Cancer Institute, 72 Huntley St, London WC1E 6DD, United Kingdom; e-mail: a.fielding@ucl.ac.uk.
