

Key Points
Combined knockout of Kdm4a, Kdm4b, and Kdm4c results in HSC defects.
KDM4 demethylases are required for sustained expression of genes important for survival of HSCs.

Abstract
KDM4/JMJD2 are H3K9- and H3K36-specific demethylases, which are considered promising therapeutic targets for the treatment of acute myeloid leukemia (AML) harboring MLL translocations. Here, we investigate the long-term effects of depleting KDM4 activity on normal hematopoiesis to probe potential side effects of continuous inhibition of these enzymes. Utilizing conditional Kdm4a/Kdm4b/Kdm4c triple-knockout mice, we show that KDM4 activity is required for hematopoietic stem cell (HSC) maintenance in vivo. The knockout of the KDM4 demethylases leads to accumulation of H3K9me3 on transcription start sites and the corresponding downregulation of expression of several genes in HSCs. We show that 2 of these genes, Taf1b and Nom1, are essential for the maintenance of hematopoietic cells. Taken together, our results show that the KDM4 demethylases are required for the expression of genes essential for the long-term maintenance of normal hematopoiesis.
Introduction
Chromatin-modifying enzymes are important during development of leukemia where they sustain the erroneous expression pattern of oncogenes and tumor-suppressor genes. Importantly, their catalytic activities are often required for growth of leukemic cells, making them potential therapeutic targets.1,2 The H3K9me3/me2- and H3K36me3/me2-specific histone lysine demethylase family KDM4/JMJD2 has 4 members: KDM4A-D.3,,-6 Although KDM4A-C are expressed in many tissues, expression of KDM4D is confined to testis.7 Mice single knockout for Kdm4a-c are viable, whereas the combined deletion of Kdm4a and Kdm4c or Kdm4a, Kdm4b, and Kdm4c is embryonic lethal.8,9 KDM4 enzymes localize to H3K4me3+ promoters, preventing accumulation of H3K9me3 and H3K36me3.9 KDM4 enzymes are required for the growth of MLL-AF9–translocated acute myeloid leukemia (AML) cells, and these enzymes are considered promising therapeutic targets.10,11 Here, we addressed the role of the KDM4 enzymes in normal hematopoiesis.
Study design
Animal studies
RNA sequencing
RNA from 10 000 cells was converted to complementary DNA using Nugen Ovation RNA sequencing (RNA-seq) System V2 and sequenced on a Nextseq500 (Illumina). Reads where mapped using RNA STAR13 (Galaxy version 2.4.0d-2) and counted using htseq count14 (Galaxy version 0.6.1galaxy1). Differentially expressed genes were identified using DESeq215 (Galaxy version 2.1.8.3).
Chromatin immunoprecipitation sequencing
Results and discussion
To investigate the role of the KDM4 enzymes in normal hematopoiesis, we performed a series of competitive BM transplantations. We used BM from mice expressing tamoxifen-inducible Cre from the Rosa26 locus (CreER) in combination with conditional alleles of Kdm4 (CreER:Kdm4cfl/f, CreER:Kdm4acf/fl, and CreER:Kdm4abcfl/fl) (Figure 1A). Four weeks after transplantation, we measured the percentage of CD45.2+ donor-derived cells in PB and induced knockout through intraperitoneal injection of tamoxifen (supplemental Figure 1A-B, available on the Blood Web site). We followed the percentage of CD45.2+ cells in myeloid, B-cell, and T-cell populations in PB 1, 3, and 5 months after tamoxifen injection (Figure 1B). Deletion of Kdm4c alone did not affect the production of either myeloid, T, or B cells (Figure 1B), whereas Kdm4ac or Kdm4abc deletion resulted in a significant reduction of all 3 lineages 6 months after transplantation (Figure 1B). Single knockout or the combined deletion of Kdm4b and Kdm4c did not have any gross effect on hematopoiesis (supplemental Figure 2A-F). These data indicate that KDM4A, KDM4C, and, to a lesser extent, KDM4B play functionally redundant roles in hematopoiesis.
![The combined knockout of Kdm4a, Kdm4b, and Kdm4c leads to reduction of myeloid and lymphoid cells. (A) Schematic drawing of the experimental setup. Lethally irradiated mice were transplanted with BM from mice with the indicated genotypes (CD45.2) mixed 1:1 with BM from B6-SJL mice. (B) CD45.2 chimerism in PB at the indicated times after injection of tamoxifen (TAM). Data represented as mean ± standard deviation (SD) (n = 6 in each group). (C) Histogram depicting the CD45.2 percentage in the indicated cell populations within the BM 4 months after tamoxifen injection. Data represented as mean ± SD (n = 6 in each group). Hematopoietic stem cell (HSC; Lin−Sca−c-Kit+CD34−), LSK (Lin−Sca−c-Kit+), and granulocyte-monocyte (GM) progenitor (GMP) population. (D) Cell-cycle profile of LSK cells sorted from the BM of mice that were treated 10 days with tamoxifen and an additional 72 hours with 5-bromo-2′-deoxyuridine (BrdU). The percentage of BrdU+ cells in the different populations is indicated. Data are represented as mean ± SD (n = 4 in control group and n = 3 in the Kdm4abc knockout [KO] group). (E) In vitro growth curve of HSCs sorted from BM of mice with indicated genotypes 2 weeks after injection of tamoxifen. Data are represented as mean ± SD (n = 4 in each group). (F) Methocult replating assay using LSK cells sorted from the BM of mice with the indicated genotypes 2 weeks after injection of tamoxifen. One thousand cells per plate were plated in the first round and 5000 in the subsequent rounds of replating. Data are represented as mean ± SD (n = 3 in each group). Rel., relative.](https://ash.silverchair-cdn.com/ash/content_public/journal/blood/134/14/10.1182_blood.2019000855/3/m_bloodbld2019000855f1.png?Expires=1769098392&Signature=5DeoPSl~8c3YBuUShIicE7N-Wu-xqEzbY7wqS7WQrkeScHMuFGyjlzYRbwA4W7cf3UIYrcOr3i5oWubpxO6uNXaB-v6VYP-oBJuwdIv~ov2V4dZc9y8ZdGrItK00SmRcc3Qapo3hELhQKyb4VKyj6u0dqivfFhUy-OtWwwDfymVokg5oFkIgnTQfE73R-5avqqnr88mzHhBIsGmBzFHpHmeM7I341FNv5-AHucpulZL1aXxpJcacJDGFSoaUmcnIggZ5X-3WWiDaFlAnHwAi45Nn12T-fGQl~MvrtGIhZewN3CQPaEFBsulafKm1NxWLofulwyLAwuTJG7GwkvfnGA__&Key-Pair-Id=APKAIE5G5CRDK6RD3PGA)
The combined knockout of Kdm4a, Kdm4b, and Kdm4c leads to reduction of myeloid and lymphoid cells. (A) Schematic drawing of the experimental setup. Lethally irradiated mice were transplanted with BM from mice with the indicated genotypes (CD45.2) mixed 1:1 with BM from B6-SJL mice. (B) CD45.2 chimerism in PB at the indicated times after injection of tamoxifen (TAM). Data represented as mean ± standard deviation (SD) (n = 6 in each group). (C) Histogram depicting the CD45.2 percentage in the indicated cell populations within the BM 4 months after tamoxifen injection. Data represented as mean ± SD (n = 6 in each group). Hematopoietic stem cell (HSC; Lin−Sca−c-Kit+CD34−), LSK (Lin−Sca−c-Kit+), and granulocyte-monocyte (GM) progenitor (GMP) population. (D) Cell-cycle profile of LSK cells sorted from the BM of mice that were treated 10 days with tamoxifen and an additional 72 hours with 5-bromo-2′-deoxyuridine (BrdU). The percentage of BrdU+ cells in the different populations is indicated. Data are represented as mean ± SD (n = 4 in control group and n = 3 in the Kdm4abc knockout [KO] group). (E) In vitro growth curve of HSCs sorted from BM of mice with indicated genotypes 2 weeks after injection of tamoxifen. Data are represented as mean ± SD (n = 4 in each group). (F) Methocult replating assay using LSK cells sorted from the BM of mice with the indicated genotypes 2 weeks after injection of tamoxifen. One thousand cells per plate were plated in the first round and 5000 in the subsequent rounds of replating. Data are represented as mean ± SD (n = 3 in each group). Rel., relative.
The combined knockout of Kdm4a, Kdm4b, and Kdm4c leads to reduction of myeloid and lymphoid cells. (A) Schematic drawing of the experimental setup. Lethally irradiated mice were transplanted with BM from mice with the indicated genotypes (CD45.2) mixed 1:1 with BM from B6-SJL mice. (B) CD45.2 chimerism in PB at the indicated times after injection of tamoxifen (TAM). Data represented as mean ± standard deviation (SD) (n = 6 in each group). (C) Histogram depicting the CD45.2 percentage in the indicated cell populations within the BM 4 months after tamoxifen injection. Data represented as mean ± SD (n = 6 in each group). Hematopoietic stem cell (HSC; Lin−Sca−c-Kit+CD34−), LSK (Lin−Sca−c-Kit+), and granulocyte-monocyte (GM) progenitor (GMP) population. (D) Cell-cycle profile of LSK cells sorted from the BM of mice that were treated 10 days with tamoxifen and an additional 72 hours with 5-bromo-2′-deoxyuridine (BrdU). The percentage of BrdU+ cells in the different populations is indicated. Data are represented as mean ± SD (n = 4 in control group and n = 3 in the Kdm4abc knockout [KO] group). (E) In vitro growth curve of HSCs sorted from BM of mice with indicated genotypes 2 weeks after injection of tamoxifen. Data are represented as mean ± SD (n = 4 in each group). (F) Methocult replating assay using LSK cells sorted from the BM of mice with the indicated genotypes 2 weeks after injection of tamoxifen. One thousand cells per plate were plated in the first round and 5000 in the subsequent rounds of replating. Data are represented as mean ± SD (n = 3 in each group). Rel., relative.
Because Kdm4abc triple-knockout mice have reduced numbers of myeloid, B, and T cells, we hypothesized that the loss of KDM4 activity resulted in defects in a common progenitor. We quantified CD45.2+ cells in CD34−Lin−Sca-1+c-Kit+ (CD34−LSK) HSC, multipotent progenitor (CD34+LSK), and granulocyte/macrophage progenitor (GMP) compartments of the BM 6 months after transplantation. We found that Kdm4abc deletion resulted in a significant reduction in cell numbers for all 3 cell types (Figure 1C). To understand why the cells were lost, mice treated with tamoxifen for 10 days were subsequently injected with 5-bromo-2′-deoxyuridine (BrdU), and cells were harvested 72 hours after. As shown in Figure 1D, LSK cells showed an increase in apoptosis/S-phase and a reduction of cells in G0/G1, supporting the notion that KDM4A-C exert important functions in HSCs and early progenitors. To investigate this possibility, we generated in vitro cultures of CD34−LSK cells isolated from CreER:Kdm4cfl/fl and CreER:Kdm4abcfl/fl mice 2 weeks after tamoxifen injections, using fluorescence-activated cell sorting (FACS). These experiments showed that KDM4A-C are required for the proliferation of CD34−LSK cells (Figure 1E), an effect confirmed in methocult replating experiments (Figure 1F). Taken together, we conclude that the KDM4 histone demethylases play functionally redundant, but essential, roles in maintaining HSCs and multipotent progenitors and for the long-term maintenance of B, T, and myeloid cells in PB.
We speculated that KDM4 enzymes are required for proper expression of genes essential for HSCs. To identify such genes, we performed chromatin immunoprecipitation (ChIP) sequencing (ChIP-seq). We were unable to perform KDM4A and KDM4C ChIPs in LSK cells; however, previous results have shown that the KDM4 proteins associate with H3K4me3+ transcription start sites (TSSs).8,9,11 We expected that direct target genes of KDM4 would accumulate H3K9me3 at TSSs after KDM4 depletion. Thus, we performed H3K9me3 ChIP-seq on chromatin prepared from LSK cells of CreER:Kdm4abcfl/fl and CreER mice 2 weeks after injection of tamoxifen. We quantified the H3K9me3 reads in knockout and control cells in a region of ±1000 bp around the 9072 H3K4me3+ TSSs present in LSK cells12 (Figure 2A-D). We filtered the data to identify TSS regions in which H3K9me3 levels changed at least twofold in response to tamoxifen treatment. This led to the identification of 1381 TSSs (Figure 2A,D).
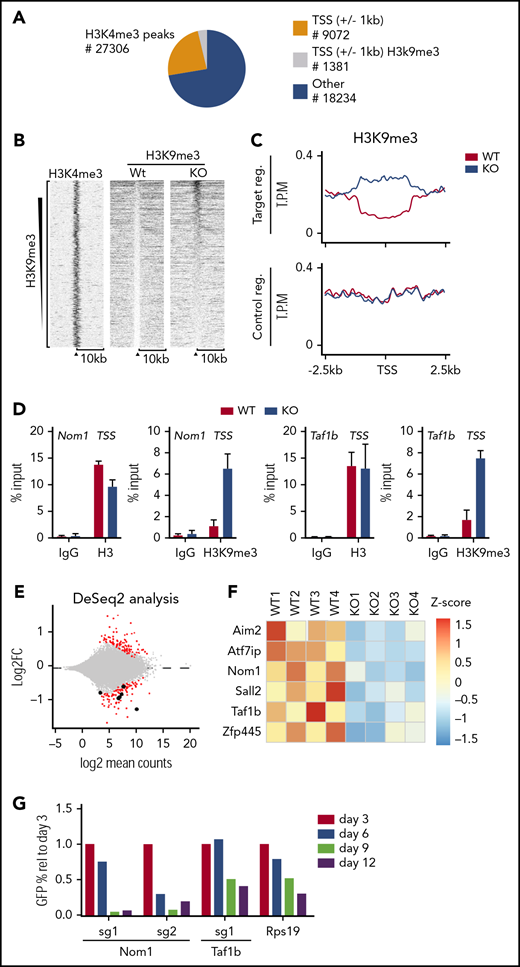
Loss of KDM4A-C leads to accumulation of H3K9me3 at TSS on a subset of genes in LSK cells. (A) Pie chart indicating the position of H3K4me3 peaks in LSK (Lin−Sca−c-Kit+) cells from C57BL6 mice.12 Orange and gray represent peaks localized ±1 kb of TSS, peaks falling outside of these regions are represented with blue. H3K4me3+ regions ±1 kb of TSS that experience a significant change in H3K9me3 levels are indicated with gray. (B) Heat map of H3K9me3 ChIP-seq read counts ±10 kb of TSS. Data have been filtered to only include regions in which a significant change in H3K9me3 occurs. (C) Summary of the data in panel A zoomed in to ±2.5 kb of TSS. (D) Direct ChIP-qPCR validation on selected target genes using cells sorted in an independent experiment. (E) RNA-seq analysis of HSCs sorted from CreER:Kdm4abcfl/flor CreER mice 2 weeks after tamoxifen injection (n = 4 in each group). (F) Heat map showing the distribution of normalized counts for the listed genes in the RNA-seq data set. (G) LSK cells were sorted from C57BL6 mice and transduced with lentiviruses expressing GFP, Cas9, and single guide RNA (sgRNA) against Taf1b and Nom1 as well as positive (Rps19) and negative controls (nontargeting sgRNA). The percentage of GFP+ cells was followed over time by FACS. The percentages have been normalized to the negative control and plotted relative to the value at day 3. FC, fold change; IgG, immunoglobulin G; reg., region; rel, relative; sg, sgRNA; T.P.M., tags per million; Wt/WT, wild type.
Loss of KDM4A-C leads to accumulation of H3K9me3 at TSS on a subset of genes in LSK cells. (A) Pie chart indicating the position of H3K4me3 peaks in LSK (Lin−Sca−c-Kit+) cells from C57BL6 mice.12 Orange and gray represent peaks localized ±1 kb of TSS, peaks falling outside of these regions are represented with blue. H3K4me3+ regions ±1 kb of TSS that experience a significant change in H3K9me3 levels are indicated with gray. (B) Heat map of H3K9me3 ChIP-seq read counts ±10 kb of TSS. Data have been filtered to only include regions in which a significant change in H3K9me3 occurs. (C) Summary of the data in panel A zoomed in to ±2.5 kb of TSS. (D) Direct ChIP-qPCR validation on selected target genes using cells sorted in an independent experiment. (E) RNA-seq analysis of HSCs sorted from CreER:Kdm4abcfl/flor CreER mice 2 weeks after tamoxifen injection (n = 4 in each group). (F) Heat map showing the distribution of normalized counts for the listed genes in the RNA-seq data set. (G) LSK cells were sorted from C57BL6 mice and transduced with lentiviruses expressing GFP, Cas9, and single guide RNA (sgRNA) against Taf1b and Nom1 as well as positive (Rps19) and negative controls (nontargeting sgRNA). The percentage of GFP+ cells was followed over time by FACS. The percentages have been normalized to the negative control and plotted relative to the value at day 3. FC, fold change; IgG, immunoglobulin G; reg., region; rel, relative; sg, sgRNA; T.P.M., tags per million; Wt/WT, wild type.
To identify genes for which an increase in H3K9me3 resulted in a transcriptional change, we FACS sorted long-term HSCs (Lin−Sca-1+, c-Kit+, CD48−, CD150+) from CreER:Kdm4abcfl/fl and CreER mice 2 weeks after tamoxifen injection and performed RNA-seq. This led to the identification of 164 downregulated genes and 157 upregulated genes in knockout long-term HSCs (Figure 2E). Comparing ChIP-seq and RNA-seq analyses, we identified 6 genes that are both repressed and have increased H3K9me3 levels (Figure 2E-F).
To identify genes that could explain the phenotype of the KDM4 knockout mice, we analyzed the 6 genes using the DepMap data set.17,18 Here, we found that Nom1 and Taf1b are classified as common essential genes. Both genes are expressed at similar levels in both HSCs and AML cells,19 and the H3K9me3 levels on the TSS of none of them changed significantly in KDM4A or KDM4C single knockouts (supplemental Figure 1B-C). We speculated that the decreased expression of Nom1 and Taf1b in HSCs could explain the requirement of the KDM4 histone demethylases for the maintenance of HSCs. To test this more directly, we depleted Nom1 or Taf1b using clustered regularly interspaced short palindromic repeats (CRISPR)/CRISPR-associated protein 9 (Cas9) in LSK cells. We cloned and validated lentiviral constructs expressing green fluorescent protein (GFP)–tagged guide RNAs against Nom1 and Taf1b in conjunction with Cas9 (supplemental Figure 1E-F). Wild-type LSK cells were transduced with these constructs and the percentage of GFP+ cells was followed over a period of 12 days of in vitro growth. We conclude that CRISPR/Cas9-mediated depletion of NOM1 and TAF1B attenuates the growth of LSK cells (Figure 2G; supplemental Figure 1G). This supports the hypothesis that loss of KDM4 activity results in transcriptional repression of Nom1 and Taf1b, which in turn causes a growth defect in LSK cells.
Previously, we and others have demonstrated that deletion of Kdm4a-c had a strong effect on proliferation of MLL-AF9–translocated AML cells whereas the effect on untransformed progenitors was less severe.10,11 Specifically, we found that KDM4A-C activity is required for the expression of Il3ra, a gene essential for the survival of AML cells, but dispensable for normal hematopoiesis.20 Using noncompetitive BM transplantation, we also showed that the hematopoietic output of KDM4A-C knockout stem cells was sufficient to confer survival of recipient mice for up to 3 months.11 This differential requirement for KDM4 for the proliferation of AML and maintenance of HSCs provides a potential therapeutic window of opportunity. However, the results from this study show that KDM4 is required for normal long-term hematopoiesis, which is critical to take into consideration when KDM4 inhibitors move into a clinical setting.
The RNA-seq and ChIP-seq data reported in this article have been deposited in the Gene Expression Omnibus database (accession numbers GSE129137, GSE129156, and GSE129157).
The online version of this article contains a data supplement.
The publication costs of this article were defrayed in part by page charge payment. Therefore, and solely to indicate this fact, this article is hereby marked “advertisement” in accordance with 18 USC section 1734.
Acknowledgments
The authors thank members of the Helin laboratory for discussions.
K.N. was supported by the Program for Advancing Strategic International Networks to Accelerate the Circulation of Talented Researchers, Japan Society for the Promotion of Science (S2704). K.D.R. was supported by a postdoctoral fellowship from the Danish Medical Research Council (FSS 1333-00120B). J.-E.M. was supported by the Novo Nordisk Foundation (NNF) Copenhagen Bioscience Program (NNF18CC0033666). The work in the Helin laboratory was supported by the Danish Cancer Society (R167-A10877); the Danish National Research Foundation (DNRF82); the Independent Research Fund Denmark (8020-00044); and the NNF (NNF16OC0023234), through a center grant from the NNF to the NNF Center for Stem Cell Biology (NNF17CC0027852) and through a Memorial Sloan Kettering Cancer Center support grant (National Institutes of Health, National Cancer Institute P30 CA008748).
Authorship
Contribution: K.A., K.N., S.M., J.-E.M., K.D.R., and K.H. designed the experiments and analyzed the data; K.A., K.N., S.M., J.-E.M., and K.D.R. performed the experiments; K.A. and K.H. wrote the manuscript; and K.D.R., K.N., S.M. and J.-E.M. provided comments on the manuscript.
Conflict-of-interest disclosure: The authors declare no competing financial interests.
The current affiliation for S.M. is Department of Life Science, Faculty of Medicine, Shimane University, Izumo, Japan.
The current affiliation for K.D.R. is Centre for Gene Regulation and Expression, School of Life Sciences, University of Dundee, Dundee, United Kingdom.
Correspondence: Karl Agger, Biotech Research and Innovation Centre, University of Copenhagen, Copenhagen, Denmark; e-mail: karl.agger@bric.ku.dk; and Kristian Helin, Memorial Sloan Kettering Cancer Center, 1275 York Ave, New York, NY 10065; e-mail: helink@mskcc.org.

This feature is available to Subscribers Only
Sign In or Create an Account Close Modal