

Key Points
Antibiotic treatment of CTCL inhibits disease activity and lymphocyte proliferation in lesional skin.
We provide a novel rationale for aggressive antibiotic treatment as an important adjuvant therapy in patients with advanced stage CTCL.

Abstract
It has been proposed that CD4 T-cell responses to Staphylococcus aureus (SA) can inadvertently enhance neoplastic progression in models of skin cancer and cutaneous T-cell lymphoma (CTCL). In this prospective study, we explored the effect of transient antibiotic treatment on tumor cells and disease activity in 8 patients with advanced-stage CTCL. All patients experienced significant decrease in clinical symptoms in response to aggressive, transient antibiotic treatment. In some patients, clinical improvements lasted for more than 8 months. In 6 of 8 patients, a malignant T-cell clone could be identified in lesional skin, and a significant decrease in the fraction of malignant T cells was observed following antibiotics but an otherwise unchanged treatment regimen. Immunohistochemistry, global messenger RNA expression, and cell-signaling pathway analysis indicated that transient aggressive antibiotic therapy was associated with decreased expression of interleukin-2 high-affinity receptors (CD25), STAT3 signaling, and cell proliferation in lesional skin. In conclusion, this study provides novel evidence suggesting that aggressive antibiotic treatment inhibits malignant T cells in lesional skin. Thus, we provide a novel rationale for treatment of SA in advanced CTCL.
Introduction
Cutaneous T-cell lymphomas (CTCL) are a heterogeneous group of non-Hodgkin lymphomas with mycosis fungoides (MF) and Sézary syndrome (SS) being most prevalent.1 CTCL displays a unique interaction between malignant cells and the immune system. Thus, malignant T cells proliferate in a chronic inflammatory environment, which may gradually turn pro-tumorigenic.2 Interestingly, a novel study suggests that visible inflammation in CTCL results from the recruitment and activation of benign T cells by c-Kit+OX40L+CD40L+ dendritic cells and that this activation in turn may provide tumorigenic signals.3 Disease progression is associated with deregulation of JAK/STAT signaling. Consequently, advanced disease is associated with enhanced STAT3 activation in situ4,5 and loss of negative regulators of the JAK/STAT pathway such as suppressors of cytokine signaling-1 (SOCS-1) and SOCS3, and possibly the tyrosine phosphatase SHP.-11 The immune defense becomes impaired in patients with advanced disease, who often die of infection rather than from the lymphoma per se.12,13 Interestingly, severe bacterial infections are almost exclusively seen after the diagnosis has been established.14 Because malignant T cells induce severe changes in the skin architecture and impair the skin barrier in vitro,15 it is likely that cancer-induced skin barrier defects also play an important role in the increased susceptibility to bacterial infections in these patients. In particular, Staphylococcus aureus (SA) infection constitutes a major source of morbidity and mortality.12,13,16,-18 Early on, SA-derived enterotoxins attracted special attention because they belong to the class of “superantigens” that are extremely potent activators of T cells (reviewed in Fraser et al.19 ). Whereas conventional antigens are processed to antigenic peptides by antigen-presenting cells before major histocompatibility complex restricted presentation to antigen-specific T cells, superantigens such as SA enterotoxins bind directly as whole proteins to major histocompatibility complex class II molecules outside the antigen-peptide binding groove and to certain families of T-cell receptor (TCR) Vbeta chains crosslinking TCR complexes and inducing T-cell activation at extremely low concentrations (reviewed in Fraser et al.19 ). Malignant T cells may carry functional TCRs expressing SA enterotoxin-binding Vbeta chains, and a hypothetical link between SA and disease activity was proposed from early studies showing that SA enterotoxins may stimulate malignant T cells in vitro.20,,,-24 SA has also been suspected to play a tumor-promoting role in the pathogenesis, because antibiotic treatment had an inhibitory effect on the tumor burden in some patients.21,25,26 Because these patients displayed skin colonization by SA, it was hypothesized, but never proven, that SA could generate a pro-oncogenic milieu in lesional skin in vivo. In support, CD4 T-cell responses to SA can inadvertently enhance neoplastic progression in models of CTCL22 and skin cancer.27
Accordingly, the present investigation was undertaken to unravel the effect of short-term, aggressive antibiotic therapy on tumor cells and disease activity in lesional skin colonized by SA in advanced-stage CTCL patients. Here, we suggest a potential link in patients between antibiotics, skin inflammation, STAT3 activation, interleukin-2 (IL-2) high-affinity receptor expression, proliferation index, clinical disease activity, and tumor burden providing a novel rationale for antibiotic treatment of SA in advanced CTCL.
Materials and methods
Patients
The patient presented in Figure 1 was diagnosed and treated at Department of Dermatology, Aarhus University Hospital, Denmark. The patient was diagnosed with MF in 2003, progressed gradually despite of intensive anticancer therapy, and presented a massive tumor burden in the skin in 2012. Spontaneous ulcerations appeared in the tumor lesions; consequently, the patient developed severe sepsis with SA being the suspected agent. Because bacterial culture response was not completed, the patient was treated with intravenous (IV) broad-spectrum antibiotics (carbapenem), according to local treatment guidelines for critically ill patients with infections, and anticancer therapy was discontinued. Surprisingly, an almost complete clearance of the tumor burden was observed after IV antibiotics. This dramatic clinical effect of antibiotics in a patient with advanced treatment-refractory CTCL prompted us to include broad-spectrum IV antibiotics as off-label treatment in the routine clinical setting for additional 8 patients with advanced-stage CTCL (stage ≥IIB), who did not respond to previous used systemic and topical treatments. These patients were further investigated to identify the underlying mechanisms of the clinical response to antibiotic therapy.
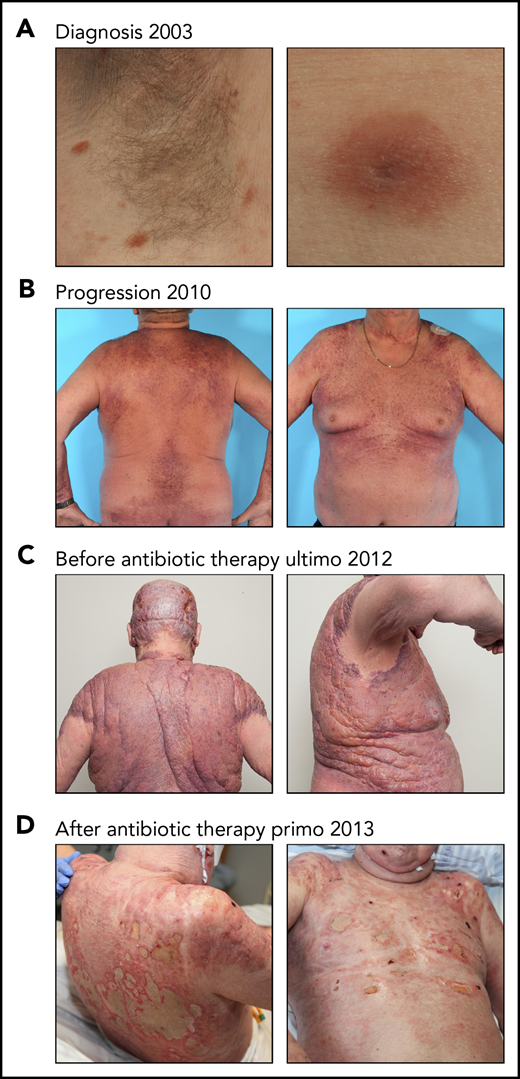
Effect of antibiotic therapy on visual tumors in a patient with CTCL. (A) The patient was diagnosed with MF in 2003 presenting patch/plaque lesions localized in the axillary skin area. (B-C) Despite intensive systemic and topical antitumor therapy, the disease progressed. (C) The patient developed severe sepsis and was treated with IV antibiotics (carbapenem). At this timepoint, the patient was in a critical condition and was not treated with CTCL-directed anticancer therapy. (D) An almost complete clearance of the tumor burden was observed after IV antibiotic therapy.
Effect of antibiotic therapy on visual tumors in a patient with CTCL. (A) The patient was diagnosed with MF in 2003 presenting patch/plaque lesions localized in the axillary skin area. (B-C) Despite intensive systemic and topical antitumor therapy, the disease progressed. (C) The patient developed severe sepsis and was treated with IV antibiotics (carbapenem). At this timepoint, the patient was in a critical condition and was not treated with CTCL-directed anticancer therapy. (D) An almost complete clearance of the tumor burden was observed after IV antibiotic therapy.
Patient characteristics, therapy, and response assessment are described in the supplemental Materials and methods, available on the Blood Web site.
Skin biopsies
At all 4 clinical control time points, 4-mm punch biopsies were obtained from the same target skin lesion in 7 patients and from 1 patient having smaller lesions, the biopsies were obtained from closely located skin lesions in the same body region. The biopsies were immediately snap-frozen in liquid nitrogen. For immunohistochemical analysis, biopsies were formalin-fixed and embedded in paraffin. The study was approved by the Regional Ethical Committee of Region Midtjylland, Denmark (1-10-72-151-16 and M-20090102) and was conducted in compliance with the Declaration of Helsinki. Signed informed consent was obtained from each patient.
Bacterial skin swabs, isolation, identification, and analyses of SA
Bacterial swabs were collected at time of inclusion (day 0), and after 10 days, and 1 and 2 months. Sample collection and analysis are described in the supplemental Materials and methods.
RNA purification
RNA was extracted from the snap-frozen skin biopsies using RNeasy Mini Kit according to manufacturer’s recommendations (Qiagen). Total RNA quantity and quality were monitored using a NanoQuant Infinite M200 spectrophotometer (Tecan) and a 2100 Bioanalyzer (Agilent Technologies). All samples had good integrity (ie, RNA Integrity Number ≥6).
Global gene expression by microarray analysis
The global gene expression analysis is described in the supplemental Materials and methods.
Real-time quantitative polymerase chain reaction validation analysis
Expression of selected genes was validated using the Fluidigm BioMark System as described in the supplemental Materials and methods.
TCRβ CDR3 analysis by high-throughput sequencing
Genomic DNA (gDNA) was extracted from CTCL skin biopsies resulting in concentrations ranging from 30 to 130 ng/μL. Following the ImmunoSeq (Adaptive Biotechnologies, Seattle, WA) protocol, the CDR3 region of the TCRβ chain was amplified and sequenced. In a first polymerase chain reaction (PCR), highly optimized multiplex PCR primers were used to amplify the CDR3 region resulting from a V, D, and J gene rearrangement. After a second PCR, universal adaptor sequences and DNA barcodes allowed identification and high-throughput sequencing on an Illumina MiSeq using the MiSeq ReagentKit v3 150-cycle (Illumina, San Diego, CA). Subsequently, the ImmunoSeq Analyzer (Adaptive Biotechnologies, Seattle, WA) software was applied for quality checking and clustering to eliminate PCR and sequencing errors from downstream analysis.
Isolation of peripheral blood mononuclear cells and cell sorting
Peripheral blood mononuclear cells (PBMCs) were isolated from the blood of patients with SS by Lymphoprep (Axis-shield, Oslo, Norway) density gradient centrifugation and used directly for flow cytometric analysis or cultured in human serum media with Phosphate Buffered Saline, staphylococcal enterotoxin or SA isolate. Malignant SS T cells typically lack the expression of cell surface markers CD26 and/or CD7 and often display reduced expression of CD4 when compared with nonmalignant T cells.1,28,29 Accordingly, T cells were identified as malignant (CD4low/+CD7−, CD4low/+CD26−) and nonmalignant (CD4+CD7+, CD4+CD26+) and sorted by flow cytometry, as previously validated.30 Data acquisition and flow cytometric analysis were done on Fortessa flow cytometers (BD Biosciences) using FlowJo software (Tree Star, Ashland, OR).
SA isolation for cell stimulation
Bacteria were isolated as described in the supplemental Materials and methods. SA supernatants were produced by cultivating clinically isolated SA bacteria overnight in Tris-buffered saline media at 37°C. Cultures were spun down and supernatants were sterile-filtered before use. The SA isolates and supernatant originated from patient 8. In accordance with the Declaration of Helsinki, the samples were obtained with informed consent and after approval by the Committee on Health Research Ethics.
Cell lines, cell trace assay and antibodies, and reagents
The methods are described in the supplemental Materials and methods.
Immunohistochemical staining
The immunohistochemical studies were performed on formalin-fixed and embedded in paraffin sections as described in the supplemental Materials and methods.
Statistics
Statistical analyses were performed in GraphPad Prism v.7 (GraphPad Software, San Diego, CA). Significance of reverse transcription quantitative PCR (RT-qPCR) data were calculated using a 2-sided Student t test (P < .05). Significance of quantified immunohistochemical staining was calculated using a 2-tailed Wilcoxon matched-pairs signed-rank test (P < .05).
Data sharing statement
Microarray data are available at the Gene Expression Omnibus database under the accession number GSE122934. For other original data, please contact ndum@sund.ku.dk.
Results
Antibiotic therapy inhibits the tumor burden and disease activity in CTCL
Clinical infection with SA is a potentially dangerous complication in patients with advanced CTCL, which often requires aggressive systemic treatment with antibiotics. Figure 1 shows the effect of antibiotic therapy in a patient with severe treatment-refractory MF. Despite intensive anticancer therapy, the patient developed an enormous tumor burden within the skin (stage IIB) (Figure 1A-C), complicated by lesional ulcerations and severe sepsis with SA as the suspected agent. Surprisingly, the tumor almost disappeared after treatment with IV carbapenem (Figure 1D). Notably, CTCL-directed drugs were not administered during this period.
The dramatic effect of antibiotics on the tumor burden prompted us to investigate the underlying antitumor mechanisms of antibiotic therapy. Accordingly, we performed a prospective study in which 8 patients with CTCL refractory to previously used conventional anticancer therapy, and without signs of acute infection were treated with IV antibiotics. Patient characteristics and skin colonization with toxin-producing SA are listed in Tables 1 and 2. The antibiotic treatment regimen is depicted in Figure 2A. After 2 months, all patients responded to antibiotics with marked clinical improvement as determined by a significant decrease in modified Severity Weighted Assessment Tool (mSWAT) used to quantify the skin disease burden in CTCL (Figure 2B, left). Disease severity measured by patient self-reported evaluations of combined itch and skin pain severity, according to visual analog scale scores, also demonstrated a profound decrease in disease activity in 4 and a modest decrease in 3 of 8 patients (Figure 2B, right). Notably, subjective improvement was observed as early as 10 days after initiation of antibiotic treatment (ie, when SA was no longer detectable) (Table 2), whereas mSWAT scores dropped continuously over the 2-month period (Figure 2B, right). Two patients were followed for more than 8 months and although SA reemerged in 1 of the 2 patients (Table 2), both patients continued to improve clinically after termination of the 4 weeks of antibiotic treatment (Figure 3).
Patient characteristics
| Pt. ID | Sex | Age | Stage | Year of diagnosis | Treatment since diagnosis | Treatment at inclusion* |
|---|---|---|---|---|---|---|
| 1 | F | 61 | IIIA | 2006 | IFN-α, TSEBT, acitretin, bexarotene, MTX, ECP, vorinostat, prednisolone, NM, phototherapy, Calyx, topical corticosteroids | Topical corticosteroids (total of 4 times from day 0 to 2 mo) |
| 2 | M | 57 | SS | 2011 | IFN-α, acitretin, bexarotene, ECP, NM, topical corticosteroids | Bexarotene 75 mg, IFN-α, topical corticosteroids ×1-2 per week |
| 3 | M | 69 | IIIA | 2010 | IFN-α, MTX, phototherapy, TSEBT 10 Gy, NM, topical corticosteroids | Topical corticosteroids once a week |
| 4 | M | 65 | IIIA | 2015 | IFN-α, ECP, acitretin, NM, topical corticosteroids | Acitretin 20 mg, IFN-α 1.5 IE ×3 per week, NM ×2 per months, ECP, topical corticosteroids daily |
| 5 | M | 72 | IIB | 2012 | IFN-α, TSEBT, NM, localized radiotherapy, topical corticosteroids | NM ×2 per month, topical corticosteroids daily |
| 6 | M | 72 | IIB | 2006 | IFN-α, acitretin, MTX, TSEBT 30 Gy, NM, topical corticosteroids | Acitretin 25 mg, topical corticosteroids ×3-7 per week |
| 7 | M | 74 | IIB | 2007 | IFN-α, NM, topical corticosteroids | Topical corticosteroids × 2-3 per week |
| 8 | F | 61 | SS | 2011 | IFN-α, acitretin, MTX, ECP, NM, phototherapy, topical corticosteroids | IFN-α 3 mio IE ×3, methotrexate 10 mg, prednisolone 10 mg per day, ECP (not during AB treatment) |
ECP, extracorporal photopheresis; F, female; IFN-α, interferon alpha; M, male; mio IE, million international units; MTX, methotrexate; NM, nitrogen mustard; Pt., patient; TSEBT, total skin electron beam therapy.
CTCL-directed anticancer therapy and dosing were initiated at least 2 mo before inclusion and not changed during the study. No additional anticancer therapy was initiated throughout the study.
Presence of SA in CTCL lesional skin before, during, and after antibiotic therapy
| Pt. ID | Day 0 | Day 10 | 1 mo | 2 mo |
|---|---|---|---|---|
| 1 | SA MLST: 1 toxin*: SEA, α toxin | None | None | None |
| 2 | SA MLST: 188 toxins: SEA, SEJ, α toxin | None | None | None |
| 3 | SA MLST: 15 toxins: SEA, SEJ, α toxin | None | SA MLST: 15 toxins: SEA, SEJ, | SA MLST: 15 toxins: SEA, SEJ, α toxin |
| 4 | SA† | ND | ND | ND |
| 5 | SA† | ND | ND | ND |
| 6 | SA MLST: 6 toxins*: SEA, SEJ, α toxin | None | None | None |
| 7 | SA MLST: 30 toxins*: SEA, SEB, SEC, SEE, SEG, SEI, SEJ, SEK, SEL, α toxin | None | None | SA MLST: 30 toxins: SEA, SEB, SEC, SEE, SEG, SEI, SEJ, SEK, SEL, α toxin |
| 8 | SA MLST: 188 toxins*: SEA, SEE, SEH, SEI, SEJ, SEK, SEL, α toxin | None | None | SA MLST: 188 toxins: SEA, SEE, SEH, SEI, SEJ, SEK, SEL, α toxin |
ND, not determined; Pt., patient; SA MLST, Staphylococcus aureus multilocus sequence type; SE, staphylococcal enterotoxin.
SE detected by Staphylococcal Enterotoxin Reversed Passive Latex Agglutination Kit in supernatants from clinically isolated bacterial cultures.
SA detected by qPCR.
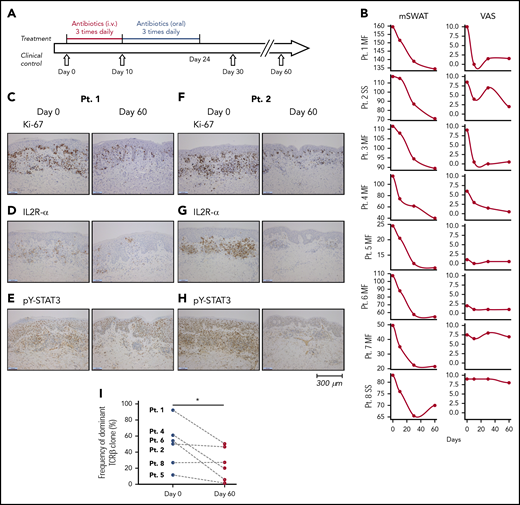
Treatment regimen, clinical response, proliferation index and expression of IL2R-α and pY-STAT3, and clonal T-cell populations in the skin lesions before and after antibiotic therapy. (A) Eight CTCL patients were treated for 10 days with IV antibiotics (cephalosporin and metronidazole) and subsequent oral treatment of 14 days with combined amoxicillin and clavulanate. (B) All patients had clinical improvement 2 months after antibiotic treatment. The mSWAT scores dropped after treatment (left). The mSWAT score before treatment differed among the included patients (left). (Right) The subjective patient self-reported evaluations of disease severity according to the VAS. (C-H) Immunohistochemistry of the proliferation index (Ki67 staining), and expression of IL2R-α and pY-STAT3 before and 2 months after initiation of antibiotic treatment in patients 1 and 2 (original magnification ×10). Stainings for patients 3 through 8 are presented in supplemental Figure 1. Images were obtained with a Leica DM2000 microscope equipped with a Leica DFC295 camera, magnification ×100 and LAS v4.6 acquisition software. (I) Sequencing the CDR3 of the TCR-β chain from gDNA from CTCL skin biopsies identified a dominant clonal T-cell population in 6 of 8 patients. The frequency of the most dominant TCR clonotype is depicted for each patient (numbered) before and 60 days after initiation of antibiotic treatment. The presence of a dominant T-cell population could not be demonstrated in patients 3 and 7 by TCR sequencing. mSWAT, modified Severity Weighted Assessment Tool; Pt., patient; VAS, visual analog scale.
Treatment regimen, clinical response, proliferation index and expression of IL2R-α and pY-STAT3, and clonal T-cell populations in the skin lesions before and after antibiotic therapy. (A) Eight CTCL patients were treated for 10 days with IV antibiotics (cephalosporin and metronidazole) and subsequent oral treatment of 14 days with combined amoxicillin and clavulanate. (B) All patients had clinical improvement 2 months after antibiotic treatment. The mSWAT scores dropped after treatment (left). The mSWAT score before treatment differed among the included patients (left). (Right) The subjective patient self-reported evaluations of disease severity according to the VAS. (C-H) Immunohistochemistry of the proliferation index (Ki67 staining), and expression of IL2R-α and pY-STAT3 before and 2 months after initiation of antibiotic treatment in patients 1 and 2 (original magnification ×10). Stainings for patients 3 through 8 are presented in supplemental Figure 1. Images were obtained with a Leica DM2000 microscope equipped with a Leica DFC295 camera, magnification ×100 and LAS v4.6 acquisition software. (I) Sequencing the CDR3 of the TCR-β chain from gDNA from CTCL skin biopsies identified a dominant clonal T-cell population in 6 of 8 patients. The frequency of the most dominant TCR clonotype is depicted for each patient (numbered) before and 60 days after initiation of antibiotic treatment. The presence of a dominant T-cell population could not be demonstrated in patients 3 and 7 by TCR sequencing. mSWAT, modified Severity Weighted Assessment Tool; Pt., patient; VAS, visual analog scale.
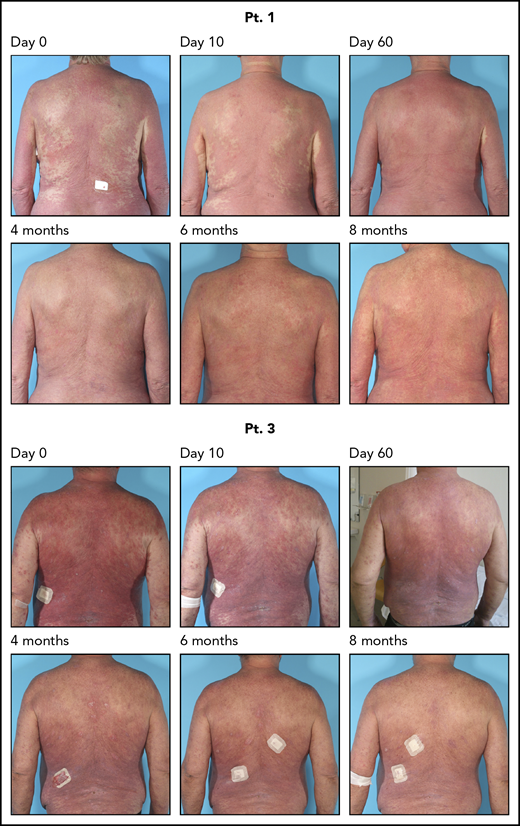
Continued clinical response for 8 months after 4 weeks of antibiotic therapy. Two patients were followed for 8 months; they continued to respond clinically after the antibiotic treatment. Pt., patient.
Continued clinical response for 8 months after 4 weeks of antibiotic therapy. Two patients were followed for 8 months; they continued to respond clinically after the antibiotic treatment. Pt., patient.
To determine whether the clinical improvement reflected a decrease in skin disease activity in situ, we used immunohistochemistry to compare the proliferation index (Ki67 staining), expression of IL2R-α, and tyrosine-phosphorylated STAT3 (pY-STAT3) before and 2 months after initiation of antibiotic therapy (Figure 2C-H; supplemental Figures 1 and 2). Baseline levels of Ki67, IL2R-α, and pY-STAT3 expression varied considerably between patients, but comparison of staining patterns and intensity in individual patients before and after antibiotic therapy revealed that cell proliferation, IL2R-α, and pY-STAT3 expression were clearly diminished after antibiotic treatment (Figure 2C-H; supplemental Figures 1 and 2). In support, digital, automated quantifications of Ki67, CD25, and pY-STAT3 expression in 5 selected hot spots of tumor areas in all patients using the well-characterized Digital Image Hub server software (SlidePath/Leica Microsystems), showed that the percentage of Ki67 and CD25+ cells decreased significantly in all patients after antibiotics (supplemental Figure 2, upper left) (P < .05, Wilcoxon paired samples test). Moreover, the intensity of positive cells decreased following antibiotics as judged by a decrease in H scores (supplemental Figure 2, lower left, P < .05). The total number positive cells per 5 fields decreased from an average of 556 to 308 (45% decrease) in case of Ki67 and from 1115 to 722 (35% decrease) in case of STAT3. These differences were not significant in the whole cohort but if focusing on MF patients, the drop in total numbers of positive T cells were statistically significant (P < .05 2-tailed Wilcoxon matched-pairs signed rank, data not shown). Although 6 of 6 patients with positive baseline staining for IL2R-α displayed a reduction in IL2R-α expression at 2 months (Figure 2C-H; supplemental Figures 1 and 2), IL2R-α expression was barely detectable in patient 6 before antibiotic therapy but appeared to increase slightly 2 months after initiation of antibiotic treatment whereas changes in IL2R-α expression could not be evaluated in patient 7, because the skin lesions repeatedly failed to stain positive (supplemental Figure 1), despite high expression of IL2RA messenger RNA (mRNA) in the same lesions (see the following section).
Taken together, our findings suggest that both the number of positive cells and staining intensity decreased following antibiotic therapy.
Antibiotic therapy inhibits the percentage of malignant T-cell clones in lesional skin
Sequencing the CDR3 of the TCRβ chain from gDNA from CTCL skin biopsies identified a dominant clonal T-cell population in 6 of 8 patients (Figure 2I), whereas a dominant clonal T-cell population could not be identified in patients 3 and 7 by TCR sequencing (data not shown). The frequency of the most dominant TCR clonotype decreased significantly (P < .05) in 5 of 6 patients 60 days after initiation of antibiotic treatment, whereas the percentage remained largely unchanged in 1 patient (patient 8) (Figure 2I). Immunohistochemistry showed that the total number of CD4+ cells dropped significantly from an average of 1974 positive cells (and a percentage of 81% positive cells) in a total of 5 fields before treatment to an average of 1571 positive CD4+ cells (and a percentage of 67% positive cells) at 2 months (P < .05 Wilcoxon, data not shown). Concomitant with a decrease in the dominant T-cell clone (presumably malignant T-cell clone), there was a relative increase in less frequent T-cell clones (presumably nonmalignant T-cell clones). The distribution of the dominant, malignant T-cell clone vs TCR-Vb families of nonmalignant T cells is shown in supplemental Figure 3 and illustrates that, whereas the fraction of nonmalignant T cells increased following antibiotic therapy, the relative distribution between the TCR-Vb families remained largely unchanged without the upcoming of new dominating T-cell clones (supplemental Figure 3). Notably, 4 MF patients (patients 1, 4, 5, and 6) displayed a profound decrease in malignant T cells following antibiotic therapy (Figure 2I; supplemental Figure 3), whereas the 2 SS patients showed little (patient 2) or no (patient 8) decrease in the fraction of malignant T cells in lesional skin (Figure 2I; supplemental Figure 3). Of note, the fraction of malignant T cells in peripheral blood of patient 8 did not change from day 0 until day 60 (data not shown), indicating that the malignant clone in peripheral blood and lesional skin was not inhibited in this patient following antibiotic therapy confirming the high level of disease heterogeneity in CTCL.30,-32 Yet, the overall staining for Ki67, CD25, and pY-STAT3 and the clinical score were inhibited following antibiotics.
Taken together, these data indicate that antibiotics not only inhibited disease activity clinically and histologically, but also resulted in a significant decrease in the malignant T-cell population per se in lesional skin in the majority of patients where a dominating malignant T-cell clone could be identified.
SEA boosts STAT3 activation, IL2R expression, and proliferation of primary malignant T cells
We next investigated the mechanism of SEA on primary malignant and nonmalignant T cells ex vivo. SEA induced an increase in pY-STAT3 in both primary malignant and nonmalignant T cells ex vivo (Figure 4A), expanding our recent findings that SEA activates nonmalignant inflammatory T cells to produce cytokines that drive STAT3 activation in malignant T cells.33,34 pY-STAT3 was increased in malignant T cells cultured with purified SEA and SEA-containing supernatants from SA isolated from CTCL skin lesions (supplemental Figure 4A). Importantly, SEA markedly increased the expression of the high-affinity IL-2 receptor α chain (IL2R-α, CD25) and, to lesser degree, IL2R-β (CD122) and IL2R-γ (CD132) in malignant and nonmalignant T cells (Figure 4B). IL2R-α expression became even more upregulated by SEA when malignant T cells were cocultured with nonmalignant T cells (supplemental Figure 4B), supporting the notion that crosstalk between malignant and nonmalignant T cells fuels the response of malignant T cells to SEA.33,34 Furthermore, proliferation of malignant T cells was strongly increased by SEA as compared with untreated controls (Figure 4C) supporting the hypothesis that SEA may also promote STAT3 activation, IL-2R expression and proliferation of primary malignant T cells in vivo in CTCL. Importantly, antibiotics at clinically relevant concentration had no significant effect on malignant T cells per se as judged from the effect on viability and apoptosis of malignant T cells in vitro (supplemental Figure 5).

STAT3 phosphorylation, IL-2R subunits expression, and proliferation of primary CTCL (SS) cells in the presence of SE. (A) STAT3 phosphorylation in malignant and nonmalignant T cells from cultured SS PBMC cultures in the presence of SE (ie, cultures of malignant T cells and bystander cells from 2 patients). Data from 5 additional patients are shown in supplemental Figure 4. (B) IL2R-α, IL2R-β, and IL2R-γ expression in primary malignant and nonmalignant T cells from cultured SS PBMCs in the presence of SE after 3, 6, and 12 days as described previously. (C) Proliferation of primary malignant T cells from cultured SS PBMCs in the presence or absence of SE after 3, 6, and 12 days. Data in panels B and C are representative of 2 patients. PBS, phosphate-buffered saline; SE, staphylococcal enterotoxin; US, unstimulated.
STAT3 phosphorylation, IL-2R subunits expression, and proliferation of primary CTCL (SS) cells in the presence of SE. (A) STAT3 phosphorylation in malignant and nonmalignant T cells from cultured SS PBMC cultures in the presence of SE (ie, cultures of malignant T cells and bystander cells from 2 patients). Data from 5 additional patients are shown in supplemental Figure 4. (B) IL2R-α, IL2R-β, and IL2R-γ expression in primary malignant and nonmalignant T cells from cultured SS PBMCs in the presence of SE after 3, 6, and 12 days as described previously. (C) Proliferation of primary malignant T cells from cultured SS PBMCs in the presence or absence of SE after 3, 6, and 12 days. Data in panels B and C are representative of 2 patients. PBS, phosphate-buffered saline; SE, staphylococcal enterotoxin; US, unstimulated.
Antibiotic therapy changes the tumor transcriptome in CTCL
The clinical and patient-experienced improvement described previously was reflected by changes in the global mRNA expression profiles in skin lesions. Supplemental Figure 6 shows a heat map of 1463 differentially expressed genes in all 8 patients before antibiotic treatment and at 10 days, 1 month, and 2 months, and in 6 healthy controls. mRNA expression patterns in untreated lesional skin (supplemental Figure 6, left, day 0) were distinctly different from skin from healthy donors, with the latter displaying a uniform expression pattern (supplemental Figure 6, right). Importantly, the mRNA expression patterns in patient skin changed following antibiotic therapy toward expression profiles seen in healthy skin. In fact, the mRNA expression pattern was partly normalized in patient 4 and almost completely normalized in patient 5 2 months after initiation of antibiotics (Figure 5A, patient 4-2m and patient 5-2m). The gene expression microarray data were validated for selected genes by RT-qPCR (supplemental Figure 7), which also confirmed decreased expression of STAT3 and IL2RA in all patients after treatment (Figure 5B) including the 2 patients (patients 6 and 7) who were IL2R-α negative in immunohistochemistry. Importantly, pathway analysis revealed a clear decrease in IL2 signaling and STAT3 activation after treatment (Figure 5C). Thus, the entire downstream signaling network of IL-2 and STAT3 was inhibited following treatment with antibiotics (supplemental Figures 8 and 9). Interestingly, the bio-function activation scores for neoplasia, proliferation, leukocyte migration and infiltration, and inflammatory responses also decreased following antibiotic therapy (Figure 5C; Table 3). Likewise, activation of CTCL-involved signaling was inhibited after antibiotic therapy (Figure 5D). Taken together, these findings show that aggressive antibiotic therapy triggers significant improvements in clinical symptoms in advanced stage CTCL patients with a concomitant decreased disease activity in situ.
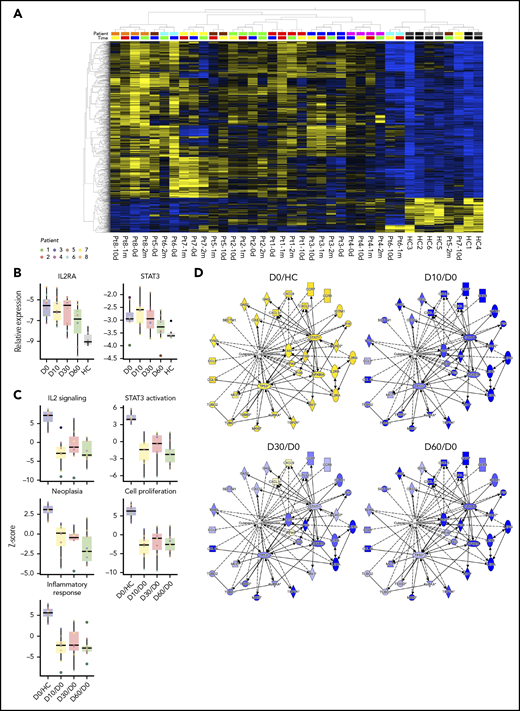
Global mRNA expression profiles, IL2RA and STAT3 expression, and changes of CTCL-related pathway, bio-function, and network activation after antibiotic therapy. (A) Heatmap and 2-way unsupervised hierarchical clustering based on the 1463 differentially expressed genes (1196 up- and 267 downregulated, more than twofold change, P < .05, q = 0.10) between lesional (patients 1-8) and skin from healthy controls (HC 1-6) before antibiotic treatment (day 0). Top row, the subject identification (8 patients and 6 HCs). The second from top row shows the time of sampling: before (0 d), 10 days (10 d), 1 month (1 m), and 2 months (2 m) after treatment. The healthy skin samples cluster to the right, and together with samples from patient 5-2m, patient 7-10d, patient 6-10d, and patient 6-1m, indicate partial normalization of the CTCL signature posttreatment. Gene expression values have been z scaled (mean = 0, var = 1) and are indicated in the heatmap as yellow (upregulated) or blue (downregulated). (B) RT-qPCR of the IL2RA and STAT3 expression in all patients before antibiotic treatment and at 10 days, 1 month, and 2 months, and in 6 HC. (C) Upstream analysis of IL-2 signaling and STAT3 activation, and bio-function activation z scores for neoplasia, proliferation, and inflammation before and 10 days, 1 month, and 2 months after treatment. (D) Activation of CTCL-involved signaling before and 10 days, 1 month, and 2 months after antibiotic treatment. The contrasts shown are CTCL vs HC at day 0 (CTCL/HC D0), and CTCL at 10 days, 1 month, and 2 months vs day 0 (paired analysis, CTCL D10-1m-2m/D0).
Global mRNA expression profiles, IL2RA and STAT3 expression, and changes of CTCL-related pathway, bio-function, and network activation after antibiotic therapy. (A) Heatmap and 2-way unsupervised hierarchical clustering based on the 1463 differentially expressed genes (1196 up- and 267 downregulated, more than twofold change, P < .05, q = 0.10) between lesional (patients 1-8) and skin from healthy controls (HC 1-6) before antibiotic treatment (day 0). Top row, the subject identification (8 patients and 6 HCs). The second from top row shows the time of sampling: before (0 d), 10 days (10 d), 1 month (1 m), and 2 months (2 m) after treatment. The healthy skin samples cluster to the right, and together with samples from patient 5-2m, patient 7-10d, patient 6-10d, and patient 6-1m, indicate partial normalization of the CTCL signature posttreatment. Gene expression values have been z scaled (mean = 0, var = 1) and are indicated in the heatmap as yellow (upregulated) or blue (downregulated). (B) RT-qPCR of the IL2RA and STAT3 expression in all patients before antibiotic treatment and at 10 days, 1 month, and 2 months, and in 6 HC. (C) Upstream analysis of IL-2 signaling and STAT3 activation, and bio-function activation z scores for neoplasia, proliferation, and inflammation before and 10 days, 1 month, and 2 months after treatment. (D) Activation of CTCL-involved signaling before and 10 days, 1 month, and 2 months after antibiotic treatment. The contrasts shown are CTCL vs HC at day 0 (CTCL/HC D0), and CTCL at 10 days, 1 month, and 2 months vs day 0 (paired analysis, CTCL D10-1m-2m/D0).
Activation scores of dermatological disease pathways, enriched bio-functions, and upstream regulators
| CTCL/HC D0 | D10/D0 | 1m/D0 | 2m/D0 | ||||||
|---|---|---|---|---|---|---|---|---|---|
| Category | Disease or bio-function/molecule | P | z score median (range) | P | z score median (range) | P | z score median (range) | P | z score median (range) |
| Diseases | |||||||||
| Dermatological diseases and conditions | Psoriasis | 1.7 × 10−63 | 9.6 × 10⁻³⁵ | 2.1 × 10⁻³⁵ | 1.9 × 10−40 | ||||
| Dermatitis | 3.3 × 10−44 | 3.3 × 10⁻²⁵ | 8.0 × 10⁻²⁰ | 2.1 × 10⁻²¹ | |||||
| Bio-functions | |||||||||
| Cancer | Neoplasia of cells | 9.8 × 10⁻²¹ | 3.1 (1.6-4.1) | 2.3 × 10⁻¹² | −0.4 (−4.4 to 1.4) | 2.6 × 10⁻⁶ | −0.8 (−4.7 to 0.1) | 3.7 × 10⁻¹⁴ | −2.2 (−4.0 to 2.0) |
| Cellular movement | Migration of cells | 6.7 × 10−61 | 7.0 (3.7-9.6) | 2.6 × 10⁻³¹ | −2.7 (−11.3 to 2.4) | 1.7 × 10⁻¹⁴ | −1.2 (−11.7 to 3.8) | 3.2 × 10⁻²⁸ | −2.9 (−7.3 to 4.0) |
| Leukocyte migration | 9.2 × 10−59 | 6.8 (3.1-8.8) | 8.1 × 10⁻²⁵ | −2.7 (−9.8 to 3.4) | 3.6 × 10⁻¹² | −1.7 (−9.3 to 4.6) | 2.2 × 10⁻²³ | −2.5 (−7.3 to 2.8) | |
| T-cell migration | 3.2 × 10⁻²⁷ | 6.2 (4.2-7.0) | 1.4 × 10⁻²³ | −3.1 (−6.4 to 1.5) | 1.8 × 10⁻¹⁵ | −2.0 (−6.5 to 3.4) | 1.4 × 10⁻¹⁵ | −2.3 (−4.9 to 1.8) | |
| Cellular growth | Proliferation of cells | 5.2 × 10−58 | 6.0 (2.3-8.7) | 1.9 × 10⁻³¹ | −2.7 (−9.2 to 1.2) | 3.5 × 10⁻¹⁷ | −1.9 (−9.6 to 2.2) | 7.4 × 10⁻²⁶ | −2.1 (−5.7 to 2.4) |
| Proliferation of immune cells | 2.5 × 10−55 | 3.4 (−0.2 to 4.2) | 3.4 × 10⁻²² | −1.2 (−4.2 to 1.4) | 2.8 × 10⁻³⁰ | −0.7 (−4.2 to 2.3) | 2.2 × 10⁻¹³ | −0.2 (−2.1 to 0.3) | |
| Proliferation of lymphocytes | 4.1 × 10−55 | 3.2 (−0.2 to 4.3) | 3.4 × 10⁻²⁴ | −1.1 (−3.5 to 1.5) | 1.2 × 10⁻¹⁵ | −0.4 (−3.6 to 2.5) | 3.1 × 10⁻¹³ | −0.5 (−1.9 to 0.2) | |
| Immune cell trafficking | Infiltration by lymphocytes | 5.0 × 10⁻²⁰ | 1.7 (0.3-3.9) | 2.3 × 10⁻¹¹ | −1.4 (−1.6 to 1.5) | 1.3 × 10⁻⁶ | −1.1 (−2.2 to 1.3) | 1.3 × 10⁻¹² | −1.6 (−3.1 to 0.6) |
| Infiltration by leukocytes | 1.8 × 10−40 | 2.7 (2.2-3.9) | 2.8 × 10⁻¹⁷ | −2.4 (−2.9 to 2.8) | 2.4 × 10⁻⁹ | −1.0 (−2.7 to 2.1) | 5.7 × 10⁻¹⁶ | −1.2 (−3.2 to 0.8) | |
| Inflammation | Inflammatory response | 3.5 × 10−36 | 5.6 (2.9-7.9) | 2.1 × 10⁻²² | −2.3 (−8.7 to 1.8) | 4.3 × 10⁻¹⁰ | −2.3 (−8.3 to 3.7) | 8.8 × 10⁻¹⁷ | −2.7 (−6.7 to 3.3) |
| Upstream regulators | |||||||||
| Transcription factor | STAT3 | 3.6 × 10−48 | 3.8 (2.9-5.8) | 9.8 × 10−189 | −0.9 (−3.8 to 1.7) | 5.6 × 10⁻¹⁶ | −1.1 (−3.0 to 1.7) | 2.0 × 10⁻²³ | −2.1 (−5.2 to 1.6) |
| Cytokine | IL-2 | 4.4 × 10⁻²⁹ | 7.2 (2.7-9.0) | 5.0 × 10⁻¹⁴ | −3.0 (−9.1 to 3.9) | 1.2 × 10⁻⁵ | −1.6 (−9.4 to 6.3) | 1.4 × 10⁻¹² | −2.8 (−7.1 to 1.3) |
Discussion
In the present study, we provide the first evidence that aggressive antibiotic treatment inhibited proliferation of malignant T cells and disease activity in advanced-stage CTCL patients. Notably, the fraction of malignant T cells in situ dropped significantly from before to 2 months after initiation of antibiotic treatment, indicating that eradication of SA inhibited the amount of malignant T cells in lesional skin, which likely explains, at least partly, the observed decrease in disease activity. As antibiotics did not appear to have a direct inhibitory effect on malignant T cells in vitro, our findings suggest that the effect of antibiotics was indirect and possibly mediated through an inhibition of SA directed responses of bystander T cells. A similar mechanism has been proposed in skin cancers because CD4 T-cell responses to SA enhance neoplastic progression in a transgenic model of multistage squamous carcinogenesis induced by human papillomavirus oncogenes.27 Furthermore, Koralov and coworkers reported that disease progression in a STAT3-dependent mouse model of CTCL was dependent on bacteria.35 Thus, disease progression was not observed in mice living under germ-free conditions.35 Although antibiotics were not included and the species of bacteria was not identified, their data strongly support the hypothesis that bacteria fuel disease progression.36 Importantly, we observed that high-affinity receptors for IL-2, STAT3 signaling, and proliferation was inhibited in lesional skin following antibiotic treatment. Thus, immunohistochemical analysis confirmed that pY-STAT3 and Ki67 staining was diminished in the neoplastic-appearing T cells, indicating that antibiotic treatment exerted a comprehensive effect on affected skin. This conclusion is in agreement with our observations that genes and pathways associated with both CTCL and benign skin inflammation were inhibited by antibiotic treatment as judged from micro-array analysis. Recently, Clark and coworkers reported that visible inflammation in CTCL resulted from the recruitment and activation of benign T cells and dendritic cells that may provide tumorigenic signals.3 Thus, it is possible that SA (and its toxins) may accelerate a vicious circle involving cross-talk between benign T cells and dendritic cells that in turn creates a tumorigenic environment. Although we did not investigate the role of dendritic cells (and other cell types), the present data that stimulation of primary PBMCs from SS patients with staphylococcal enterotoxin triggered enhanced proliferation of malignant T cells in vitro, support the hypothesis that a deregulated inflammatory environment may fuel disease progression.13
As expected, SA reemerged with time in some patients (Table 2).37 Yet, clinical and patient-experienced improvement continued in all patients whether or not recolonization by SA was detected. Because outgrow of SA is a qualitative measure of presence or absence of SA, the level of skin recolonization by SA remains unknown. However, it is possible that the bacterial load was higher before treatment when compared with the number of reemerging bacteria in the 3 patients in question. In addition, our observation of a drop in the fraction of malignant T cells in situ and a partial normalization in global mRNA expression profiles after antibiotics suggest that antibiotic therapy could make the skin more resistant to the effects of recolonization by SA. Interestingly, the 2 patients (1 with and 1 without recolonization by SA) who were followed for 8 months continued to improve clinically after termination of the 4 weeks of antibiotic treatment, suggesting that antibiotics may lead to a lasting change in the tumor and its microenvironment (Figure 3). Because multiple species of bacteria may colonize lesional skin, it is possible that other species also play a role in the pathogenesis and as putative targets of antibiotic treatment. Moreover, we cannot exclude the possibility that microbe-independent effects of antibiotics may also play a role. However, as antibiotics at supraclinical concentrations had no effect on the malignant T cells in vitro, it is less likely that inhibition of malignant T cells and disease activity was mediated by bacterial-independent effects of the antibiotics in question. These observations are consistent with the hypothesis that SA and possibly its toxins promote disease progression and that removal of this stimulus leads to diminished disease activity.20,-22,25 Because less aggressive disease usually responds better to anti-CTCL therapy, we foresee that antibiotic treatment, and other antibacterial measures, may pave the way for a better subsequent response to CTCL-directed therapies. Indeed, Duvic and coworkers reported on a novel therapeutic approach, the “Duvic regimen” that successfully combines aggressive antibiotics, an antiseptic whirlpool bathing system, and steroids. This treatment regimen had a profound effect in a CTCL patient with erythrodermic flares secondary to methicillin‐resistant SA.38
In conclusion, the present study provides, to the best of our knowledge, novel evidence for a potential link between antibiotic treatment of SA and disease activity as well as a rationale for aggressive antibiotic treatment as an important adjuvant therapy in CTCL patients with severe disease and lesional skin colonization with toxin-producing SA.
The online version of this article contains a data supplement.
The publication costs of this article were defrayed in part by page charge payment. Therefore, and solely to indicate this fact, this article is hereby marked “advertisement” in accordance with 18 USC section 1734.
Acknowledgments
This work was supported by grants from The Novo Nordisk Research Foundation (NNF14OC0012345), LEO Foundation, the Danish Cancer Society (Kræftens Bekæmpelse), the Fight Cancer Program (Knæk Cancer), LINAK A/S Nordborg, The Danish Council for Independent Research, The Lundbeck Foundation, Aage Bangs Foundation, and Kræftfonden.
Authorship
Contribution: N.O., L.I., A.W., and L.M.L. conceived the study; N.O., L.I., A.W., M.K., A.W.-O., and L.M.L. designed the study; A.W.-O., E.B., M.G., C.N., S.F., T.B.B., and T.K. performed the ex vivo experiments; L.M.L., L.I., B.S.-G., and A.H.R. treated the patients and collected all clinical data and patient samples; M.K. and performed Staphylococcus aureus cultivation, identification of serological detection and genome-based analyses of superantigenic toxins, and multilocus sequence typing of isolates; B.H. detected Staphylococcus aureus by polymerase chain reaction; L.M.L., A.H.R., C.J., L.I., and P.C. collected the skin biopsies and performed RNA extraction; T.L., N.O., L.I., L.M.L., and A.W.-O. performed bioinformatics analysis and interpretation; L.M.R.G., P.R.N., M.B., J.O.E., and J.C.B. performed the immunohistochemistry; J.O.E. and L.M.R.G. performed digital analyses of immunohistochemical stains; L.P., L.K., and J.C.B. performed T-cell receptor β CDR3 analysis; N.O., L.I., L.M.L., T.L., A.W.-O., T.B.B., T.M., A.W., M.K., L.M.R.G., M.A.W., C.G., C.M.B., E.L., and M.G. analyzed and interpreted the data; L.M.L., N.O., L.I., T.L., and A.W.-O. wrote the manuscript. All authors participated in manuscript preparation and approved the final version of the manuscript.
Conflict-of-interest disclosure: T.L. is employed both by Copenhagen University and by LEO Pharma A/S. J.C.B. has received advisory board honoraria from Takeda. The remaining authors declare no competing financial interests.
Correspondence: Lars Iversen, Department of Dermatology, Aarhus University Hospital, Palle Juul-Jensens Blvd 99, DK-8200 Aarhus N, Denmark; e-mail: lars.iversen@clin.au.dk; and Niels Odum, LEO Foundation Skin Immunology Research Center, University of Copenhagen, Blegdamsvej 3c, DK-2200 Copenhagen N, Denmark; e-mail: ndum@sund.ku.dk.
