

Key Points
Nurse-like cells express Wnt5a to induce ROR1-dependent stimulation of NF-κB, which leads to autocrine IL-6-induced STAT3 activation in CLL cells.
Cirmtuzumab inhibits Wnt5a-induced, ROR1-dependent stimulation of NF-κB, and thereby represses autocrine IL-6-dependent STAT3 activation in CLL.

Abstract
Coculture of nurse-like cells (NLCs) with chronic lymphocytic leukemia (CLL) cells induced leukemia cell phosphorylation of STAT3 (pSTAT3), which could be blocked by anti-Wnt5a antibodies or the anti-ROR1 monoclonal antibody, cirmtuzumab. Time-course studies revealed Wnt5a could induce activation of NF-κB within 30 minutes, but required more than 3 hours to induce pSTAT3. Culture of isolated CLL cells for 24 hours revealed Wnt5a-induced expression of interleukin 6 (IL-6), IL-8, CCL2, CCL3, CCL4, and CXCL1, which in turn could induce pSTAT3 in unstimulated CLL cells within 30 minutes. We found that Wnt5a could induce CLL cell expression of NF-κB target genes, including IL-6, and that this effect could be blocked by cirmtuzumab or drugs that inhibit NF-κB. Examination of CLL cells and plasma collected from patients treated with cirmtuzumab revealed reduced levels of phosphorylated p65 and diminished expression of NF-κB and STAT3 target genes in CLL cells, as well as lower plasma levels of IL-6, in the samples after therapy. Collectively, these studies indicate that Wnt5a/ROR1-dependent signaling contributes to CLL cell activation of NF-κB, which in turn causes autocrine IL-6-induced activation of pSTAT3. As such, this study demonstrates that cirmtuzumab can inhibit leukemia cell activation of both NF-κB and STAT3 in patients with CLL.
Introduction
Receptor tyrosine kinase-like orphan receptor 1 (ROR1) is a developmentally restricted oncoembryonic surface protein that is expressed on neoplastic cells of many types of cancer,1 including chronic lymphocytic leukemia (CLL), but not on most normal postpartum tissues.2 ROR1 can serve as a receptor for Wnt5a, which can promote leukemia cell growth and survival,2,-4 potentially accounting for the observation that high-level CLL cell expression of ROR1 is associated with early disease progression and shorter overall survival.5 These properties of ROR1 make it an attractive target for therapy of patients with CLL, prompting development of a humanized monoclonal antibody, called cirmtuzumab, which targets ROR1 and inhibits ROR1-signaling in vitro.4,6,,,-10 A phase I study of cirmtuzumab in patients with CLL demonstrated that this antibody also could inhibit ROR1-signaling in vivo, suppressing leukemia cell activation of ρ-GTPases and phosphorylation of HS1.11
In addition to activation of ρ-GTPases,4 ROR1 signaling also can induce recruitment and activation of 14-3-3ζ,8 HS1,7 DOCK2,6 and cortactin,12 each of which also contributes to Wnt5a-induced, ROR1-dependent enhancement of CLL cell proliferation and/or migration. Wnt5a also has been reported to induce activation of STAT3 in melanoma cells13 and activation of NF-κB in the human embryonic kidney cell line HEK293 in a ROR1-dependent-manner.2 Activation of NF-κB and STAT3 also can enhance proliferation and/or survival of CLL cells.14,,-17 Furthermore, activation of STAT3 may enhance expression of ROR1,18 potentially providing a positive feedback loop in which Wnt5a could upregulate the expression of its receptor. However, it is not known whether Wnt5a could induce activation of STAT3 or NF-κB in ROR1-expressing CLL cells.
Also not clear is the principle cellular source or sources for Wnt5a. Although hydrophobic amino acids and posttranslational palmitoylation provides mature Wnt proteins the capacity to act primarily as surface proteins tethered to the plasma membrane,19 Wnt5a can be found at high levels in the plasma of patients with CLL relative to that of age-matched healthy adults.4,11 The cell source responsible for the high levels of Wnt5a in plasma of patients with CLL is not clear. Although CLL cells themselves have been noted to express Wnt5a, only 38% of patients have detectable transcripts of Wnt5a in their leukemia cells.20 Other candidates include nurse-like cells (NLCs), the nonmalignant accessory cells residing in the proliferation centers of lymphoid tissue that are derived from monocytes,21,22 which may express Wnt5a.23 Expression of Wnt5a by NLCs implicates that there most likely are higher concentrations of Wnt5a in lymphoid tissues than in the circulation, potentially leading to amplified Wnt5a/ROR1 signaling and upregulated expression of ROR1 through the positive feedback loop within the microenvironment.
Among circulating CLL cells, the relative expression CD5 and CXCR4 can be used to distinguish between leukemia cells that recently have exited from the lymphoid tissue microenvironment (CD5high CXCR4dim) and leukemia cells that may be poised to reenter the lymphoid compartments (CXCR4high CD5dim).24,25 Prior studies demonstrated that circulating CXCR4dim CD5high CLL cells express higher levels of genes upregulated in leukemia cells present in lymphoid tissues than blood CXCR4high CD5dim CLL cells of the same patient,24 providing a means with which to assess how the lymphoid microenvironment influences CLL cell gene-expression. We examined whether CXCR4dim CD5high CLL cells have higher levels of activated STAT3 and ROR1 compared with CXCR4high CD5dim CLL cells.
Methods
CLL specimens
Blood samples were collected from Moores Cancer Center patients who provided written informed consent using a protocol approved by the Institutional Review Board of the University of California, San Diego (approval number 090401), in accordance with the Declaration of Helsinki. Peripheral blood mononuclear cells were isolated by density-gradient centrifugation with Ficoll-Paque PLUS (GE Healthcare Life Sciences), followed by purification with human B Cell Isolation Kit (130-091-151, Miltenyi Biotec Inc.). CLL cells were segregated into “ROR1high” and “ROR1low” subgroups, as described.5 Plasma was collected from blood samples that had undergone centrifugation for 10 minutes at 187g, and stored at −80°C. Plasma samples and CLL cells were collected from patients treated with cirmtuzumab in the phase 1 clinical study of cirmtuzumab (registered at www.clinicaltrials.gov as #NCT02222688).10
Generation of nurse-like cells
Peripheral blood mononuclear cells isolated by Ficoll-Paque PLUS from patients with CLL were suspended in RPMI with 20% fetal bovine serum to a final concentration of 2 × 10⁷/mL, as described.21 After 14 days, the nonadherent CLL cells were removed by vigorously pipetting the contents of the well, leaving the adherent cells untouched. We observed these cells to have the morphology typical of NLC via microscopy.
Materials
We obtained BAY 11-7082 (S2913) from Selleckchem. Human recombinant Wnt5a (645-WN) was from R&D Systems. Wnt5a was suspended in sterile PBS containing 0.1% bovine serum albumin at 100 μg/mL.
Immunoblot analysis
Immunoblot analysis was performed as described.2 Primary monoclonal antibody (mAb) for ROR1 (#4102), Phospho-STAT3 (Tyr705; #9145), STAT3 (#4904), phospho-p65 (#3033), phospho-IκBα (#9246), p65 (#8242), and IκBα (#4814) were obtained from Cell Signaling Technology. Secondary antibody conjugated with horseradish peroxidase was from Cell Signaling Technology.
Flow cytometry
Flow cytometry analysis was performed as described.2,11 Anti-ROR1 mAb (4A5) conjugated with Alexa Fluor 647 (4A5-Alexa Fluor 647) was generated in our laboratory. 4A5 is a non–cross-blocking mAb specific for a ROR1 epitope distinct from that recognized by cirmtuzumab.2 Anti-CD19-PerCP, anti-CD5-FITC, anti-pSTAT3 Y705-PE, and anti–CXCR4-APC antibodies were from BD Biosciences. The molecules of ROR1 per cell were determined with the Quantum MESF (Molecules of Equivalent Soluble Fluorochrome) microspheres. Alexa Fluor 647 conjugated beads were run on the same day as stained cell samples to establish a calibration curve relating channel values to MESF units, or ΔMFI.
ELISA
IL-6 in plasma or medium was detected by Human IL-6 ELISA (enzyme-linked immunosorbent assay) kit (430504; BioLegend). Wnt5a was detected by Human WNT5A ELISA kit (OKEH00723; Aviva Systems Biology).
Human cytokine assay
CLL cells were cultured with or without Wnt5a (200 ng/mL) or cirmtuzumab (10 μg/mL) or anti-Wnt5a antibody (MAB645; R&D Systems) (5 μg/mL) in RPMI culture-media, which were analyzed by Proteome Profiler Human Cytokine Array Kit (ARY005B; R&D Systems), as per the manufacturer’s instructions.
NF-κB target gene expression
We used the RT2 Profiler PCR (polymerase chain reaction) Array for human NF-κB signaling targets (PAHS-225ZA; Qiagen) to profile the expression of 83 NF-κB target genes. Real-time PCR was performed per the manufacturer's instructions. The threshold (CT) value for each gene in the array was normalized to the average CT value of 4 housekeeping genes. The Volcano Plots and ClusterGram Heatmap were generated using the Qiagen data analysis center (https://www.qiagen.com/us/shop/genes-and-pathways/data-analysis-center-overview-page/), as per the vendor’s instructions.
Quantitative reverse-transcription PCR
Total RNA was extracted using Trizol (Life Technologies). A 10-μg volume of total RNA was incubated with 10 U RNase-free DNase I (Life Technologies) for 30 minutes at 37°C. RNA was further purified with an RNeasy Mini Kit (QIAGEN, Hilden, Germany). The purified total RNA (2 μg) was reverse transcribed with Superscript III Reverse Transcriptase (Life Technologies). Taq 2× Master Mix (NEB) was used for the PCR, per the manufacturer’s protocol. SYBR Green PCR Master Mix (Thermo Fisher Scientific) and 7900HT Fast Real-Time PCR System (Applied Biosystems,) were used for real-time PCR, per the manufacturer’s protocol. The expression level of WNT5A transcripts was calculated using ACTB.
Gene set enrichment analysis
We performed gene set enrichment analysis (GSEA) of STAT3 target genes in matched lymph nodes and peripheral blood CLL cells collected from 17 patients previously included in a study by Herishanu et al.16 Peripheral blood mononuclear cells of 3 CLL samples were collected before therapy (Pre-Rx) and at day 28 (D28) of cirmtuzumab treatment. Each D28 sample was collected after patients had received 2 doses of 16 mg/kg cirmtuzumab. Negative isolation of CLL cells to more than 95% purity was performed before RNA isolation. Total RNA was extracted using Trizol reagent (Life Technologies). RNAseq data were analyzed as described.11 Using GSEA software,26 we conducted GSEA on the primary RNAseq data from CLL cells isolated from patients before therapy (Pre-Rx) and at D28 of cirmtuzumab treatment. We focused our attention on changes in the NF-κB27 and STAT328 target genes. Each gene set was considered significant when the false discovery rate (FDR) was less than 25%.26 The FDR q value was adjusted for gene set size and multiple hypothesis testing.
Statistical analyses
Data are presented as the mean ± standard deviation. Differences between 2 groups were determined by 2-tailed Student t test. Significance was analyzed by GraphPad Prism 6.0 (GraphPad Software Inc.), and P < .05 was considered significant.
Results
The expression of ROR1 and phosphorylation of STAT3 are higher in CD5high CXCR4dim CLL cells than their CD5dim CXCR4high counterparts
We examined 24 CLL cell samples that expressed high (ROR1high, N = 12) or low (ROR1low, N = 12) levels of surface ROR1 (supplemental Table 1, available on the Blood Web site), as per a previously defined theshold,4 which subsequently was noted to correspond to ≈4 × 10³ molecules of ROR1 per cell.11 CLL cells were stained with antibodies specific for CD5 or CXCR4. CD5high CXCR4dim and CD5dim CXCR4high subpopulations were electronically gated for analysis of the relative expression of other proteins by these subpopulations. The levels of ROR1 and pSTAT3 were determined in each gated subpopulation. We noted that CD5high CXCR4dim CLL cells, which presumably had recently exited the lymph node, had higher levels of ROR1 and pSTAT3 than the CD5dim CXCR4high counterpart CLL cells (Figure 1A-C; supplemental Table 1), although the difference in the levels of ROR1 between such subpopulations did not reach statistical significance for ROR1low samples (Figure 1B). Consistent with the notion that CLL cells exiting the lymph nodes may have higher levels of activated STAT3 than those circulating in the blood is our gene set enrichment analyses of the published transcriptome data on CLL cells isolated from the lymph node and blood of 17 patients.16 This analysis revealed that the expression levels of STAT3-target genes (N = 97) were significantly higher in CLL cells isolated from the lymph node than in CLL cells isolated from the blood of the same patients (NES = 1.30; FDR q = 0.08; Figure 1D).
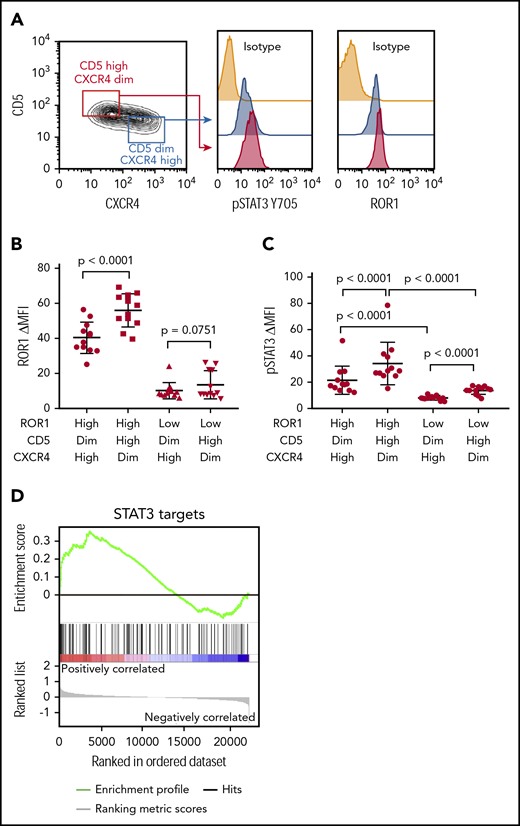
CD5high CXCR4dim CLL cells express higher levels of ROR1 and phosphorylated STAT3 than CD5dim CXCR4high counterparts. (A) Flow cytometry analysis of pSTAT3 (Y705) and ROR1 in CD5high CXCR4dim and CD5dim CXCR4high CLL cells. (B) Dot figures representing ROR1 intensity in CD5high CXCR4dim and CD5dim CXCR4high CLL cells from ROR1high (n = 12) and ROR1low (n = 12) patients. Error bars denote standard deviation. (C) Bar figures representing pSTAT3 ΔMFI in CD5high CXCR4dim and CD5dim CXCR4high CLL cells from ROR1high (n = 12) and ROR1low (n = 12) patients. Error bars denote standard deviation. (D) GSEA plot of STAT3 target genes in lymph nodes vs peripheral blood CLL cells collected from 17 patients. The gene set size was 97, the normalized enrichment score (NES) was 1.30, and the false discoveray rate (FDR) q value was 0.08.
CD5high CXCR4dim CLL cells express higher levels of ROR1 and phosphorylated STAT3 than CD5dim CXCR4high counterparts. (A) Flow cytometry analysis of pSTAT3 (Y705) and ROR1 in CD5high CXCR4dim and CD5dim CXCR4high CLL cells. (B) Dot figures representing ROR1 intensity in CD5high CXCR4dim and CD5dim CXCR4high CLL cells from ROR1high (n = 12) and ROR1low (n = 12) patients. Error bars denote standard deviation. (C) Bar figures representing pSTAT3 ΔMFI in CD5high CXCR4dim and CD5dim CXCR4high CLL cells from ROR1high (n = 12) and ROR1low (n = 12) patients. Error bars denote standard deviation. (D) GSEA plot of STAT3 target genes in lymph nodes vs peripheral blood CLL cells collected from 17 patients. The gene set size was 97, the normalized enrichment score (NES) was 1.30, and the false discoveray rate (FDR) q value was 0.08.
NLCs induce CLL cell activation of STAT3 and upregulation of ROR1 via Wnt5a
We cultured NLCs with CLL cells from each of 6 patients with ROR1high CLL and 6 patients with ROR1low CLL, using an established coculture system.29 The levels of ROR1 and pSTAT3 were determined by flow cytometry. CLL cells cocultured with NLC had increased pSTAT3 in both ROR1high and ROR1low samples (Figure 2A-C). Although ROR1high CLL cells cocultured with NLC had increased levels of ROR1, the upregulation of ROR1 in ROR1low CLL cells cocultured with NLC was not statistically significant (Figure 2B). Activation of STAT3 and upregulation of ROR1 in ROR1high CLL cells were blocked respectively by adding the anti-ROR1 mAb, cirmtuzumab, or neutralizing antibodies to Wnt5a at the initiation of culture (Figure 2A-C). Consistent with the notion that NLCs were the principle source of Wnt5a, we noted that isolated NLC expressed significantly higher amounts of WNT5A than the CLL cells of the same patient (Figure 2D). Moreover, we detected higher amounts Wnt5a in the culture supernatants of isolated NLC than in the supernatants of cultures containing similar numbers of CLL cells (Figure 2E).
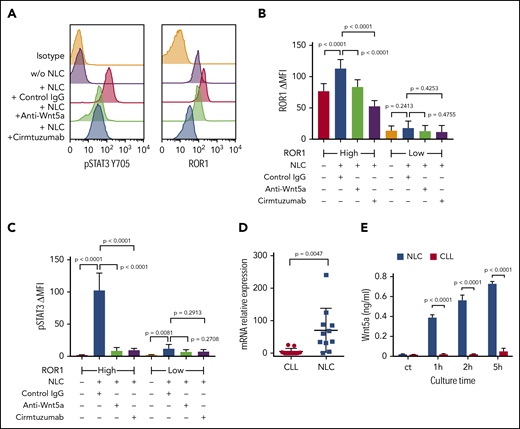
NLC Express Wnt5a, which can induce ROR1-dependent CLL cell activation of STAT3 and upregulation of ROR1. (A) Flow cytometry analysis of pSTAT3 (Y705) and ROR1 in CLL cells cocultured with or without NLC for 16 hours with control IgG or anti-Wnt5a or cirmtuzumab. (B) Bar figures represent the intensity of ROR1 staining of CLL cells from ROR1high (n = 6) and ROR1low (n = 6) patients cocultured with or without NLC for 16 hours in the presence of control IgG, anti-Wnt5a, or cirmtuzumab. Error bars denote standard deviation. (C) Bar figures represent the levels of pSTAT3 ΔMFI in CLL cells from ROR1high (n = 6) and ROR1low (n = 6) patients cocultured with or without NLC for 16 hours in the presence of control IgG, anti-Wnt5a, or cirmtuzumab. Error bars denote standard deviation. (D) Quantitative real-time PCR analysis and comparison of WNT5A transcript levels in NLC vs CLL cells of the same patient (n = 11). Error bars denote standard deviation. (E) ELISA of Wnt5a in the medium of cell cultures containing 1 × 10⁴/mL NLC and 1 × 10⁴/mL CLL cells for 0, 1, 2, and 5 hours. Error bars denote standard deviation (n = 3).
NLC Express Wnt5a, which can induce ROR1-dependent CLL cell activation of STAT3 and upregulation of ROR1. (A) Flow cytometry analysis of pSTAT3 (Y705) and ROR1 in CLL cells cocultured with or without NLC for 16 hours with control IgG or anti-Wnt5a or cirmtuzumab. (B) Bar figures represent the intensity of ROR1 staining of CLL cells from ROR1high (n = 6) and ROR1low (n = 6) patients cocultured with or without NLC for 16 hours in the presence of control IgG, anti-Wnt5a, or cirmtuzumab. Error bars denote standard deviation. (C) Bar figures represent the levels of pSTAT3 ΔMFI in CLL cells from ROR1high (n = 6) and ROR1low (n = 6) patients cocultured with or without NLC for 16 hours in the presence of control IgG, anti-Wnt5a, or cirmtuzumab. Error bars denote standard deviation. (D) Quantitative real-time PCR analysis and comparison of WNT5A transcript levels in NLC vs CLL cells of the same patient (n = 11). Error bars denote standard deviation. (E) ELISA of Wnt5a in the medium of cell cultures containing 1 × 10⁴/mL NLC and 1 × 10⁴/mL CLL cells for 0, 1, 2, and 5 hours. Error bars denote standard deviation (n = 3).
Wnt5a/ROR1 induces production of proinflammatory factors that induce phosphorylation of STAT3 and upregulation of ROR1 in CLL cells
We stimulated CLL cells with exogenous Wnt5a for 0 to 6 and 24 hours in the presence of control IgG or cirmtuzumab. Cell lysates were analyzed by immunoblot for pSTAT3 (Y705) and total STAT3. This revealed that Wnt5a induced phosphorylation of STAT3 in ROR1-positive CLL, and that this effect could be blocked by cirmtuzumab (Figure 3A). The capacity of Wnt5a to induce pSTAT3 was less apparent in CLL cells that lacked expression of ROR1 (supplemental Figure 1). Wnt5a also enhanced expression of ROR1 on ROR1-positive CLL cells, but did not induce expression of ROR1 on CLL cells that lacked ROR1 (supplemental Figure 2). Time course studies revealed latent induction of pSTAT3, which first was detected 3 hours after stimulation with Wnt5a. Because of this latent induction, we hypothesized that the capacity of Wnt5a to induce activation of STAT3 in CLL cells was indirect, being caused by a factor or factors made by isolated CLL cells on stimulation by Wnt5a.

Wnt5a/ROR1 induces production of proinflammatory factors that lead to phosphorylation of STAT3 in CLL cells. (A) Immunoblot analysis of anti-pSTAT3(Y705) or anti-STAT3 in lysates of CLL cells treated with Wnt5a (200 ng/ml) for 0-6 hours or 24 hours in the presence of control IgG or cirmtuzumab. Bar figures represent ratios of density (pSTAT3/Total STAT3). (B) Wnt5a/ROR1 induced production of cytokines in CLL cells. The medium of CLL cells cultured with or without Wnt5a for 16 hours was analyzed by the human cytokine array. (C) Cirmtuzumab or neutralizing anti-Wnt5a antibodies blocked Wnt5a-induced cytokine production in CLL cells. The medium of CLL cells cultured with or without Wnt5a, in the presence of control IgG, cirmtuzumab, or anti-Wnt5a was analyzed by the human cytokine array. (D) Immunoblot analysis of anti-pSTAT3 (Y705) or anti-STAT3 in lysates of CLL cells treated with control medium, conditioned medium, or IL-6. Tocilizumab or control IgG was added to the CLL cultures 2 hours before treatment. The numbers on the top indicate the relative density of pSTAT3/Total STAT3. The density of the sample treated by conditioned medium only (the 3rd lane) was considered as 1.0. (E) Reverse transcript PCR analysis of IL-6 and β-actin in RNA isolated from purified CLL cells treated with Wnt5a (200 ng/mL) in 0 to 5 hours. (F) ELISA of IL-6 in medium of isolated CLL cells cultured with Wnt5a for 0 to 8 hours in the presence of cirmtuzumab or control IgG (n = 5).
Wnt5a/ROR1 induces production of proinflammatory factors that lead to phosphorylation of STAT3 in CLL cells. (A) Immunoblot analysis of anti-pSTAT3(Y705) or anti-STAT3 in lysates of CLL cells treated with Wnt5a (200 ng/ml) for 0-6 hours or 24 hours in the presence of control IgG or cirmtuzumab. Bar figures represent ratios of density (pSTAT3/Total STAT3). (B) Wnt5a/ROR1 induced production of cytokines in CLL cells. The medium of CLL cells cultured with or without Wnt5a for 16 hours was analyzed by the human cytokine array. (C) Cirmtuzumab or neutralizing anti-Wnt5a antibodies blocked Wnt5a-induced cytokine production in CLL cells. The medium of CLL cells cultured with or without Wnt5a, in the presence of control IgG, cirmtuzumab, or anti-Wnt5a was analyzed by the human cytokine array. (D) Immunoblot analysis of anti-pSTAT3 (Y705) or anti-STAT3 in lysates of CLL cells treated with control medium, conditioned medium, or IL-6. Tocilizumab or control IgG was added to the CLL cultures 2 hours before treatment. The numbers on the top indicate the relative density of pSTAT3/Total STAT3. The density of the sample treated by conditioned medium only (the 3rd lane) was considered as 1.0. (E) Reverse transcript PCR analysis of IL-6 and β-actin in RNA isolated from purified CLL cells treated with Wnt5a (200 ng/mL) in 0 to 5 hours. (F) ELISA of IL-6 in medium of isolated CLL cells cultured with Wnt5a for 0 to 8 hours in the presence of cirmtuzumab or control IgG (n = 5).
We examined harvested supernatants of CLL cells cultured with or without Wnt5a, using a human cytokine array. Multiple proinflammatory factors including IL-6, IL-8, CCL2, CCL3, CCL4, and CXCL1 were detected in the medium of CLL cells cultured for 24 hours with Wnt5a that either were not detected or were found at significantly lower levels in the medium of CLL cells cultured without Wnt5a (Figure 3B). Cirmtuzumab inhibited the capacity of Wnt5a to induce CLL cells to generate most of these factors (Figure 3C). The medium harvested from CLL cells cultured with Wnt5a, but not the medium of CLL cells cultured without Wnt5a, could induce pSTAT3 within 30 minutes in serum-starved CLL cells; this effect could be inhibited by the anti-IL-6-receptor mAb, tocilizumab (Figure 3D). The conditioned medium also induced upregulation of ROR1 in ROR1high CLL cells; this effect also could be inhibited by tocilizumab, but not by neutralizing antibodies specific for Wnt5a (supplemental Figure 3). We used exogenous Wnt5a, IL-6, IL-8, CCL2, CCL3, CCL4, or CXCL1 to stimulate serum-starved CLL cells for 30 minutes, and found IL-6 was the most potent early inducer of pSTAT3 (supplemental Figure 4). IL-6 could induce pSTAT3 in CLL cells independent of the expression of ROR1 (supplemental Figure 5), but it could only upregulate the level of ROR1 on CLL cells that already expressed ROR1 (supplemental Figure 6). Because IL-6 is a target gene of STAT3, we considered whether the increased expression of IL-6 might be a consequence of STAT3 activation, rather than a cause. Using reverse transcription PCR on RNA isolated from cultured CLL cells, we detected increased levels of IL6 within 1 hour of treatment with Wnt5a before the noted phosphorylation of STAT3. As such, the induced expression of IL6 preceded the 3 or more hours required for Wnt5a to induce CLL cell activation of STAT3 (Figure 3E). Similarly, we detected IL-6 by ELISA in the media of CLL cells within a few hours after adding exogenous Wnt5a (Figure 3F). These data indicate that the activation of STAT3 largely was caused by autocrine IL-6, which was expressed after Wnt5a-induced activation of ROR1 signaling.
Wnt5a induces production of proinflammatory factors via activation of NF-ĸB
Prior studies noted that NLC could stimulate CLL cells to activate NF-κB,20,,,,,,,,,,,-32 which in turn could influence expression of the genes encoding many of the cytokines and chemokines we found were induced by Wnt5a.33 We hypothesized that Wnt5a expressed by NLC could contribute to CLL cell activation of NF-ĸB. First, we found that Wnt5a indeed could induce phosphorylation of p65 and IκBα in CLL cells that expressed ROR1 (Figure 4A). Moreover, the capacity of Wnt5a to induce activation of NF-κB in CLL cells could be blocked by cirmtuzumab or neutralizing antibodies specific for Wnt5a (Figure 4A). As anticipated, we found that NLC also could induce phosphorylation of p65 in both ROR1high and ROR1low CLL cells (Figure 4B; supplemental Figure 7). Unexpectedly, however, we found that cirmtuzumab or anti-Wnt5a antibodies caused near-complete suppression of the p65 phosphorylation in ROR1high CLL cells induced by coculture with NLC, which elaborate factors, such as APRIL or BAFF, that also could activate NF-κB (Figure 4B; supplemental Figure 7).30,-32 As such, these studies reveal that Wnt5a may be a primary factor involved in NLC-induced activation of NF-κB in ROR1-expressing CLL cells.
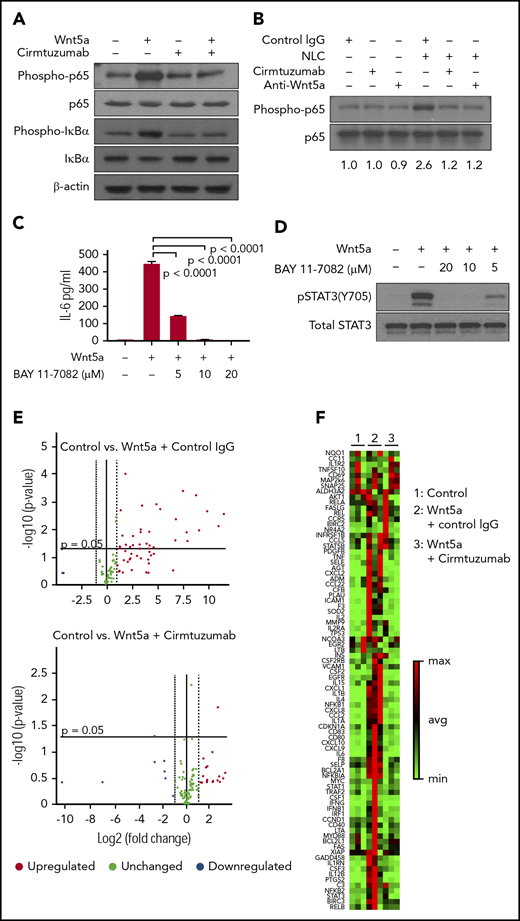
Wnt5a induces ROR1-dependent production of proinflammatory factors through activation of NF-κB in CLL cells. (A) Immunoblot analysis of lysates from CLL cells treated by Wnt5a (200 ng/mL) for 30 minutes, with or without cirmtuzumab, and probed using anti-phospho-p65, anti-p65, anti-phospho-IκBα, anti-IκBα or anti-β actin. (B) Immunoblot analysis of lysates from CLL cells cocultured with NLC overnight, with or without cirmtuzumab or anti-Wnt5a, and probed with anti-phospho-p65 or anti-p65. (C) ELISA of IL-6 in medium of CLL cells cultured with Wnt5a and BAY 11-7082 (5-20 µM) for 8 hours, as indicated in the text. (D) Immunoblot analysis of lysates from CLL cells treated by Wnt5a and BAY 11-7082 (5-20 µM) for 8 hours that was probed with anti-pSTAT3 (Y705) or anti-STAT3, as indicated in the text. (E) Volcano plot of transcripts of NF-κB target genes expressed by CLL cells stimulated with Wnt5a in the presence of control IgG or cirmtuzumab (P < .05 was considered statistically significant). (F) Heat map of transcripts of NF-κB target genes expressed by CLL cells stimulated with Wnt5a in the presence of control IgG or cirmtuzumab.
Wnt5a induces ROR1-dependent production of proinflammatory factors through activation of NF-κB in CLL cells. (A) Immunoblot analysis of lysates from CLL cells treated by Wnt5a (200 ng/mL) for 30 minutes, with or without cirmtuzumab, and probed using anti-phospho-p65, anti-p65, anti-phospho-IκBα, anti-IκBα or anti-β actin. (B) Immunoblot analysis of lysates from CLL cells cocultured with NLC overnight, with or without cirmtuzumab or anti-Wnt5a, and probed with anti-phospho-p65 or anti-p65. (C) ELISA of IL-6 in medium of CLL cells cultured with Wnt5a and BAY 11-7082 (5-20 µM) for 8 hours, as indicated in the text. (D) Immunoblot analysis of lysates from CLL cells treated by Wnt5a and BAY 11-7082 (5-20 µM) for 8 hours that was probed with anti-pSTAT3 (Y705) or anti-STAT3, as indicated in the text. (E) Volcano plot of transcripts of NF-κB target genes expressed by CLL cells stimulated with Wnt5a in the presence of control IgG or cirmtuzumab (P < .05 was considered statistically significant). (F) Heat map of transcripts of NF-κB target genes expressed by CLL cells stimulated with Wnt5a in the presence of control IgG or cirmtuzumab.
We reasoned that the capacity of anti-Wnt5a or cirmtuzumab to inhibit the activation of STAT3 in CLL cells was a result of the production of cytokines induced by activation of NF-κB. Consistent with this notion, we observed that levels of IL-6 released into media were elevated in ROR1high CLL cells cocultured with NLC, which could be inhibited by anti-Wnt5a or cirmtuzumab, but not in ROR1low CLL cells (supplemental Figure 8). Also, a small molecule inhibitor of NF-κB, BAY 11-7082, could inhibit Wnt5a-induced CLL cell production of IL-6 and activation of STAT3 (Figure 4C-D). Furthermore, we found that Wnt5a could induce CLL cells to enhance expression of NF-κB target genes, including IL6, and that this effect could be blocked by cirmtuzumab (Figure 4E-F). We also examined this effect in MEC1, which is a human cell line derived from CLL that does not express ROR1. Previously, we demonstrated that MEC1 cells transfected to express ROR1 (MEC1-ROR1 cells) had higher rates of cell proliferation and more effective chemokine-directed migration than parental MEC1 cells.4 In this study, we found that MEC1-ROR1 had higher levels of phosphorylated p65 and STAT3, and secreted higher amounts of IL-6 into the media, than MEC1 cells (supplemental Figure 9A-B). Furthermore, knockout of IL6R reduced the levels of activated STAT3 in MEC1-ROR1 cells (supplemental Figure 9C-D).
Treatment with cirmtuzumab inhibits CLL cell activation of NF-κB and STAT3
To examine the in vivo significance of our findings, we collected plasma and CLL cells from patients treated with cirmtuzumab in a phase 1 clinical trial.11 Immunoblot and RNAseq, respectively, were used to examine for activation of NF-κB and the transcriptomes of negatively selected CLL cells. ELISA was used to evaluate the concentrations of IL-6 in plasma collected before and after treatment with cirmtuzumab. Consistent with our in vitro findings, cirmtuzumab downregulated CLL cell expression of NF-κB and STAT3 target genes in vivo (Figure 5A) and reduced the levels phosphorylated p65 and STAT3 detected in the CLL cells of treated patients (Figure 5B). The levels of IL-6 in plasma also were decreased significantly in patients after treatment with this antibody (Figure 5C; supplemental Table 2).
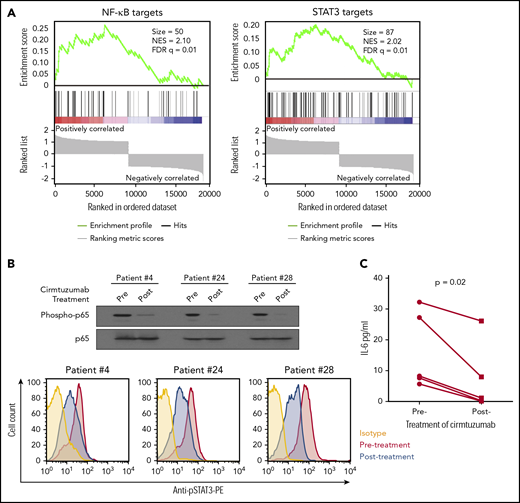
Cirmtuzumab inhibits expression of NF-κB and STAT3 target genes in the CLL cells of patients treated with cirmtuzumab in phase I clinical trial. (A) GSEA plots of NF-κB and STAT3 target genes on pretreatment vs paired postcirmtuzumab CLL cells at D28 of therapy (n = 3). Gene set size (Size), enrichment score, normalized ES (NES), and FDR q values are indicated. (B) Immunoblot and flow cytometry analysis of CLL cells isolated from patients before and after treatment with cirmtuzumab for phospho-p65 and phosphor-STAT3, respectively. (C) The paired concentrations of IL-6 in the plasma of patients before and after treatment with cirmtuzumab (n = 5).
Cirmtuzumab inhibits expression of NF-κB and STAT3 target genes in the CLL cells of patients treated with cirmtuzumab in phase I clinical trial. (A) GSEA plots of NF-κB and STAT3 target genes on pretreatment vs paired postcirmtuzumab CLL cells at D28 of therapy (n = 3). Gene set size (Size), enrichment score, normalized ES (NES), and FDR q values are indicated. (B) Immunoblot and flow cytometry analysis of CLL cells isolated from patients before and after treatment with cirmtuzumab for phospho-p65 and phosphor-STAT3, respectively. (C) The paired concentrations of IL-6 in the plasma of patients before and after treatment with cirmtuzumab (n = 5).
Discussion
In this study, we found that NLC could induce Wnt5a/ROR1-dependent activation of NF-κB in CLL, which in turn elicits autocrine IL-6-induced activation of STAT3. First, we found that levels of ROR1 and pSTAT3 were higher in circulating CD5high CXCR4dim CLL cells than in CD5dim CXCR4high CLL cells in any 1 patient, suggesting that ROR1 and pSTAT3 may be higher in CLL cells within the leukemia microenvironment present in lymphoid tissues. We found NLC-induced Wnt5a/ROR1-dependent activation of STAT3 and upregulation of ROR1 in ROR1+ CLL cells by inducing the leukemia cells to produce proinflammatory cytokines, predominantly IL-6, through the activation of NF-κB.
Prior studies revealed that NF-ĸB may be constitutively activated in patients with CLL, thereby contributing to disease progression and CLL-cell resistance to apoptosis.15 CLL cells present in the microenvironment are more likely to have activated NF-ĸB than the CLL cells in the circulation.16 Activation of NF-ĸB in CLL was considered a consequence of CLL-cell exposure to factors such as BAFF and/or APRIL, as well as B-cell receptor signaling, which are more prominent in the microenvironments of lymphoid tissues than in the blood.22,30,31,34 In this study, we found that cirmtuzumab, a mAb that could block ROR1 signaling, inhibited CLL cell phosphorylation of p65 and expression of NF-ĸB target genes and proteins, such as IL-6, in patients treated with this mAb. These findings indicate that ROR1 signaling is at least a major contributor to the activation of NF-ĸB in ROR1-positive CLL cells in vivo.
The in vitro effects of IL-6 on the survival of CLL cells appear context-based.35 Prior studies showed that IL-6 could inhibit the proliferation of CLL cells when stimulated with tumor necrosis factor α or Toll-like receptor 7.36,37 However, other studies found that IL-6 could enhance the CLL-cell proliferation and resistance to spontaneous apoptosis.38,39 A more recent study found that high-level CLL-cell production of IL-6 apparently was associated with high levels of CLL-cell STAT activation and more aggressive disease.40 Conceivably, targeting signaling pathways that induce higher levels of IL-6 may have beneficial clinical effects, as have drugs that inhibit B-cell receptor signaling, which also leads to higher levels of JAK/STAT activation in CLL cells.41 Because drugs that inhibit B-cell receptor signaling, such as ibrutinib, do not inhibit Wnt5a-induced ROR1 signaling in neoplastic B cells,9,42 there may be an added advantage to targeting both signaling pathways in patients with CLL.
In addition to IL-6, we observed that Wnt5a/ROR1 signaling also induced CLL cells to make other proinflammatory factors, such as IL-8, CCL3, and CCL4, which also may play a role in promoting disease progression in patients with CLL.43,-45 Moreover, the current study demonstrates that cirmtuzumab also could inhibit Wnt5a-induced CLL-cell expression of IL-6 and these other cytokines/chemokines, which help recruit nonneoplastic accessory cells to the leukemia microenvironment.46
Wnt5a not only is expressed by accessory cells in the microenvironment but also is present at high levels in the blood of patients with CLL relative to that of age-matched healthy adults.4 Although amphipathic Wnt factors typically are thought of being involved primarily in cognate cell-cell interactions, Wnt5a may be released from NLC and carried on plasma proteins to effect activation of CLL cells within the circulation. This may account in part for the high levels of activated NF-κB found in the circulating CLL cells of some patients, whose leukemia cells are relatively resistant to spontaneous or drug-induced apoptosis.14 We showed that the CLL cells of patients treated by cirmtuzumab had reduced activation of NF-κB and reduced expression of NF-κB target genes. Our data support a model proposing that Wnt5a expressed by NLC induces leukemia cell activation of NF-κB, which may enhance CLL-cell survival and induce expression of proinflammatory factors by CLL cells in vivo that in turn could activate CLL cells in an autocrine fashion (Figure 6). Consistent with the notion that NLC expression of Wnt5a contributes to a ROR1-dependent survival stimulus for CLL cells, we note that cirmtuzumab or neutralizing antibodies to Wnt5a can mitigate the survival advantage of CLL cells cocultured with NLC cells in vitro (supplemental Figure 10).

A model for NLC-Wnt5a-induced proinflammatory factors through ROR1-dependent NF-κB activation, which induces production of IL-6 and autocrine activation of STAT3.
A model for NLC-Wnt5a-induced proinflammatory factors through ROR1-dependent NF-κB activation, which induces production of IL-6 and autocrine activation of STAT3.
Collectively, these data indicate that Wnt5a/ROR1-dependent signaling induced by NLC contributes to the noted activation of NF-κB, leading to cytokine production and activation of STAT3 in CLL. As such, agents such as cirmtuzumab that can block ROR1 signaling can suppress leukemia-cell activation of NF-κB and production of factors that contribute to disease progression, providing another rationale for evaluating the potential benefit of cirmtuzumab in patients with this disease.
This work was presented in part at the 60th annual meeting of the American Society of Hematology, San Diego, CA, 1-4 December 2018.
The online version of this article contains a data supplement.
The publication costs of this article were defrayed in part by page charge payment. Therefore, and solely to indicate this fact, this article is hereby marked “advertisement” in accordance with 18 USC section 1734.
Acknowledgments
The authors thank the California Institute for Regenerative Medicine (grant DR3-06924) for supporting us in the generation of anti-ROR1 mAb, cirmtuzumab. This work was supported by the UC San Diego Foundation Blood Cancer Research Fund, a SCOR grant (7005-14) from the Leukemia and Lymphoma Society, and a grant (R01-CA236361 [T.J.K.]) from the National Institutes of Health, National Cancer Institute. The RNA sequencing was conducted at the IGM Genomics Center, University of California, San Diego, La Jolla, CA (National Institutes of Health, National Cancer Institute grant P30CA023100).
Authorship
Contribution: Y.C. and T.J.K. conceived the project; Y.C., L.C., J.Y., M.Y.C., and L.Z. performed the experiments; Y.C., L.C., J.Y., E.M.G., M.Y.C., S.Z., E.S.-L., G.F.W., K.M., L.Z.R., C.J., and T.J.K. analyzed data; and Y.C. and T.J.K. wrote the manuscript.
Conflict-of-interest disclosure: Cirmtuzumab was developed by T.J.K. and licensed from the University of California, San Diego, to Oncternal Therapeutics, Inc., which provided stock/options and funding to the University of California, San Diego, and to T.J.K. The remaining authors declare no competing financial interests.
Correspondence: Thomas J. Kipps, Moores Cancer Center, University of California, San Diego, 3855 Health Sciences Dr, Room 4307, La Jolla, CA 92093-0820; e-mail: tkipps@ucsd.edu.

This feature is available to Subscribers Only
Sign In or Create an Account Close Modal