

Key Points
Dormant multiple myeloma cells express a unique transcriptome signature.
This unique transcriptome signature controls dormancy, predicts survival, and identifies new treatment targets.

Abstract
The era of targeted therapies has seen significant improvements in depth of response, progression-free survival, and overall survival for patients with multiple myeloma. Despite these improvements in clinical outcome, patients inevitably relapse and require further treatment. Drug-resistant dormant myeloma cells that reside in specific niches within the skeleton are considered a basis of disease relapse but remain elusive and difficult to study. Here, we developed a method to sequence the transcriptome of individual dormant myeloma cells from the bones of tumor-bearing mice. Our analyses show that dormant myeloma cells express a distinct transcriptome signature enriched for immune genes and, unexpectedly, genes associated with myeloid cell differentiation. These genes were switched on by coculture with osteoblastic cells. Targeting AXL, a gene highly expressed by dormant cells, using small-molecule inhibitors released cells from dormancy and promoted their proliferation. Analysis of the expression of AXL and coregulated genes in human cohorts showed that healthy human controls and patients with monoclonal gammopathy of uncertain significance expressed higher levels of the dormancy signature genes than patients with multiple myeloma. Furthermore, in patients with multiple myeloma, the expression of this myeloid transcriptome signature translated into a twofold increase in overall survival, indicating that this dormancy signature may be a marker of disease progression. Thus, engagement of myeloma cells with the osteoblastic niche induces expression of a suite of myeloid genes that predicts disease progression and that comprises potential drug targets to eradicate dormant myeloma cells.
Introduction
Multiple myeloma (MM) is a B-cell neoplasm where malignant plasma cells disseminate to the skeleton and cause disease.1,2 Therapeutic advances have improved complete response rates and support the notion that MM may be curable.3 However, despite the success of targeted therapies, relapse is common. One mechanism that contributes to relapse is the reactivation of MM cells that reside in a dormant state, within specialized niches in the skeleton.4,5 These long-term, niche-resident dormant MM cells evade the immune system and resist cytotoxic chemotherapy,6,7 posing an obstacle to cure. Despite the importance of this problem, the nature of dormant MM cells and the factors that govern their behavior have eluded the field. The development of intravital imaging4,8,9 and single-cell technologies,10 including single-cell RNA sequencing (scRNAseq),11 now makes the identification and analysis of rare dormant cancer cells possible.12
Dye-retention strategies, where membrane dyes are shared with daughter cells during cell division, can mark long-term, nondividing, dormant MM cells.4 When combined with longitudinal intravital imaging, these methods can be used to map the fate of dormant cells at single-cell resolution.4 Using these approaches, we have shown that MM cells seed the endosteal bone surface4 and interact with bone-lining cells, which induce MM cells to enter a dormant state.4,13 Alterations to the endosteal bone niche, caused by osteoclasts remodeling the bone surface, displace MM cells from the niche. This releases them from cellular dormancy and causes their selective reactivation.4 Thus, MM cell extrinsic factors that alter the dormant MM cell niche can release cells from dormancy. However, our understanding of how the endosteal bone niche reprograms colonizing MM cells to become dormant is limited. We hypothesized that unbiased mapping of the transcriptional control programs expressed by dormant cells would identify the functional pathways that control MM cellular dormancy.
To address this, we developed a strategy to define the molecular signature of dormant MM cells in models of dormancy and validate signature genes in patients with MM. We used 2 complementary scRNAseq technologies: SMART-seq for full-length transcriptome profiling and massively parallel scRNA-seq (MARS-seq) for high-throughput analysis. We showed that dormant MM cells express a distinct transcriptome signature characterized by expression of immune genes typically associated with myeloid cell lineage differentiation. Targeting 1 of the genes most highly expressed by dormant cells, the tyrosine kinase AXL, released MM cells from dormancy and increased MM burden in vivo. Notably, the dormant transcriptome signature discriminated patients with monoclonal gammopathy of uncertain significance (MGUS) from patients with overt MM and was associated with a twofold increase in overall survival in clinical trial data sets.
Methods
Cell lines
Mouse models
A total of 2 × 10⁶ 5TGM1-eGFP murine myeloma cells were labeled with the lipid dye 1,1’-dioctadecyl-3,3,3′,3′-tetramethylindodicarbocyanine (DiD) and injected IV into 6- to 8-week-old C57BL/KaLwRijHsd mice (BKAL; Harlan) as previously described.4 Animal experiments were approved by the Garvan Institute of Medical Research Animal Ethics Committee (ARA14/43).
scRNA-seq
Dormant (DiD-retaining eGFP+DiDhi) and reactivated (DiD-negative eGFP+DiDneg) cells were sorted by fluorescence-activated cell sorting into 384-well plates for SMART-seq or MARS-seq and sequenced on Illumina HiSeq2500 or Nextseq500 platforms (supplemental Methods, available on the Blood Web site). External RNA Controls Consortium coverage was calculated.16 Clonotypic sequence of 5TGM1 cells was determined using MiXCR,17 verified using IgBlast,18 and visualized using MegaAlignPro in DNASTAR.
Differential gene expression analysis
Functional annotation and clustering analysis
Functional annotation was performed using the Database for Annotation, Visualization and Integrated Discovery.22,23 Differentially expressed genes identified by SMART-seq were clustered by nonnegative matrix factorization in R.24 t-distributed stochastic neighbor embedding dimensionality reduction algorithms were performed on the MARS-seq data using Seurat.21
Transcription factor prediction analysis
Validation of myeloid markers
5TGM1-eGFP+ myeloma cells were isolated from disease-bearing mice and stained for myeloid markers for index sorting and validation of myeloid gene expression. Data were acquired and analyzed using BD Symphony (BD Biosciences). In separate experiments, individual eGFP+DiDhi or eGFP+DiDneg myeloma cells were index sorted into 96-well plates containing 100 5TGM1-luc cells using Aria III (BD Biosciences). Cells were cultured for 14 days at 37°C with 5% carbon dioxide. GFP+ colonies were imaged using a Leica DFC9000GT microscope and quantified using ImageJ.28
AXL inhibition studies
BKAL mice were injected with DiD-labeled 5TGM1-eGFP+ cells; 14 days postinoculation, they were treated with cabozantinib (60 mg/kg), BMS-777607 (50 mg/kg), or vehicle daily for 10 days by gavage. Mice were euthanized 25 days postinoculation for flow cytometric analysis of dormant and reactivated cells from bone marrow and spleen.
Micro computed tomography analysis of bone structure
Bone structure in the femora was assessed using a micro computed tomography scanner (Model 1172; Skyscan) at 50 kV, 200 mA, with a 0.5-mm aluminum filter using a pixel size of 4.3 µm. Images were reconstructed using NRecon and analyzed by CTAn software. Three-dimensional models were created with Drishti-2.29 Bones were decalcified, sectioned, stained for tartrate-resistant acid phosphatase, and analyzed as described.4
Intravital 2-photon microscopy
Intravital microscopy of dormant and reactivated MM cells in the skeleton was performed as described.4
Coculture experiments
A total of 1 × 10⁵ MC3T3 osteoblast-like cells were seeded into 6-well plates in α MEM media with 10% fetal calf serum/1% penicillin-streptomycin; 24 hours after seeding, 1 × 10⁵ 5TGM1-eGFP cells were added, and after 72 hours, cells were harvested and GFP+ myeloma cells were analyzed. In separate experiments, 1 × 10⁵ MC3T3 cells were seeded in 6-well plates and cultured in the presence or absence of media conditioned by 5TGM1-eGFP cells. Alternatively, 5TGM1-eGFP cells were cocultured in direct contact or separated by a 0.4-µm transwell for 24 hours.
Real-time quantitative polymerase chain reaction analysis of myeloid gene expression
Nucleic acid isolation and complementary DNA synthesis are described in supplemental Methods and supplemental Table 1. Real-time quantitative polymerase chain reaction was performed using Taqman or Syber green primers on a QuantStudio 7 Flex Real-Time PCR System (ThemoFisher Scientific) or 7900HT Real-Time PCR System (Applied Biosystems), and gene expression was calculated using the 2-ΔΔCT method.
AXL expression in patient samples
Bone marrow aspirates were obtained from patients with MGUS or active MM30 (Royal Adelaide Hospital, Adelaide, Australia). Bone marrow mononuclear cells were isolated by density gradient centrifugation.31 AXL expression was assessed by flow cytometry on CD38++/CD138+ MM plasma cells using a LSRFortessa (BD Biosciences). The Royal Adelaide Hospital Ethics Committee approved the study (#030206, #131132, and #110304). Gene expression of marrow cell populations was performed as previously described.32
Nearest-neighbor analysis
Nearest-neighbor analysis was performed on the AXL gene (Probeset: 202686_s_at) using the Mayo Clinic Patient Dataset.33 Analysis was performed on the Multiple Myeloma Genomic Portal. χ2 test of independence was performed using R.
Survival analysis
Survival analysis was performed on GSE9782-GPL96,34 E-MTAB-4715, E-MTAB-4717, E-MTAB-5212, E-TABM-937, and E-TABM-1088 data sets32,35,36 (supplemental methods). Univariate and multivariate Cox regression models were used to estimate hazard ratios (HRs) and 95% confidence intervals (CIs) for each covariate using the survival package in R.
Quantification and statistical analysis
Statistical analysis was performed by Mann-Whitney test in R. Box and whisker plots show the medians and interquartile ranges (IQRs) between 25% (Q1) and 75% quartiles (Q3). The lower whisker is the lowest data point or Q1 − 1.5 × IQR, whichever is smaller; the upper whisker is the highest data point or Q3 + 1.5 × IQR, whichever is greater.
Results
Single-cell transcriptomic analysis of dormant and reactivated MM cells
5TGM1-eGFP murine myeloma cells14 were labeled with DiD and injected into BKAL mice (Figure 1A). Dormant MM cells were identified by expression of eGFP and retention of DiD (eGFP+DiDhi). Reactivated cells that had proliferated and diluted the DiD label were eGFP+DiDneg (Figure 1B). Individual eGFP+DiDhi dormant cells and eGFP+DiDneg reactivated cells were sorted into 384-well plates, and single-cell transcriptomes were generated using SMART-seq and validated against pools of 20 cells (Figure 1A-B). This enabled us to evaluate ∼4 × 10³ uniquely mapped genes per cell (Figure 1C). External RNA Controls Consortium spike-in controls showed equivalent mean read coverage per depth (Figure 1D). RNA biotypes showed similar diversity between dormant and reactivated cells (Figure 1E).
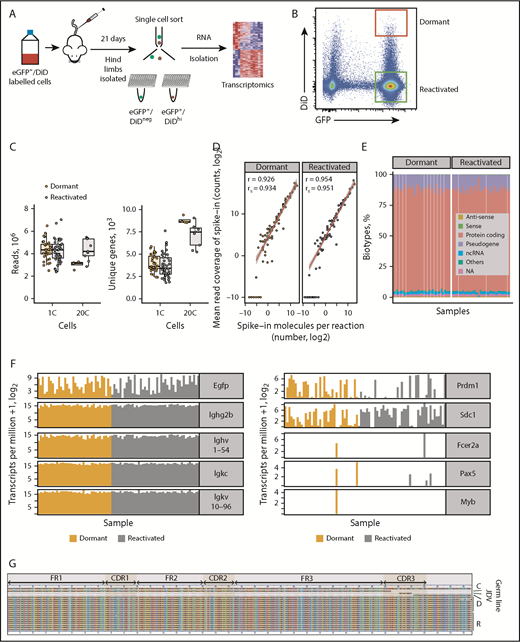
Single-cell transcriptome of dormant myeloma cells. (A) Experimental workflow for scRNAseq of dormant and reactivated MM cells. eGFP+DiD+ 5TGM1 cells were injected IV into BKAL mice. Hind limbs were isolated and individual eGFP+DiDhi and eGFP+DiDneg cells sorted into 96-well plates for scRNAseq. (B) Representative flow plot illustrating the gating of eGFP+DiDhi dormant and eGFP+DiDneg reactivated cell populations for cell isolation and scRNAseq. (C) Distribution of sequencing read coverage (left) and number of uniquely mapped genes (right) from across single (1C) and pooled (n = 20; 20C) dormant and reactivated cells. (D) Distribution of 92 External RNA Controls Consortium spike-in controls across dormant and reactivated single cells. (E) Distribution of gene biotypes for dormant and reactivated cells. (F) Transcript profile of dormant and reactivated single cells showing the expression level of Egfp and idiotype genes (left) and plasma cell (Prdm1, Sdc1), naive B-cell (Fcer2a, Pax5), and myeloid lineage (Myb) genes (right). (G) Alignment of the VDJ sequence from individual 5TGM1 cells. Each row represents a single cell. C, consensus sequence; D, dormant samples; NA, not annotated; ncRNA, noncoding RNA; R, reactivated samples.
Single-cell transcriptome of dormant myeloma cells. (A) Experimental workflow for scRNAseq of dormant and reactivated MM cells. eGFP+DiD+ 5TGM1 cells were injected IV into BKAL mice. Hind limbs were isolated and individual eGFP+DiDhi and eGFP+DiDneg cells sorted into 96-well plates for scRNAseq. (B) Representative flow plot illustrating the gating of eGFP+DiDhi dormant and eGFP+DiDneg reactivated cell populations for cell isolation and scRNAseq. (C) Distribution of sequencing read coverage (left) and number of uniquely mapped genes (right) from across single (1C) and pooled (n = 20; 20C) dormant and reactivated cells. (D) Distribution of 92 External RNA Controls Consortium spike-in controls across dormant and reactivated single cells. (E) Distribution of gene biotypes for dormant and reactivated cells. (F) Transcript profile of dormant and reactivated single cells showing the expression level of Egfp and idiotype genes (left) and plasma cell (Prdm1, Sdc1), naive B-cell (Fcer2a, Pax5), and myeloid lineage (Myb) genes (right). (G) Alignment of the VDJ sequence from individual 5TGM1 cells. Each row represents a single cell. C, consensus sequence; D, dormant samples; NA, not annotated; ncRNA, noncoding RNA; R, reactivated samples.
All single cells expressed Egfp, confirming that MM cells had been isolated. All eGFP+DiDhi and eGFP+DiDneg cells expressed Ighg2b immunoglobulin heavy and Igkc immunoglobulin light chain genes, consistent with the IgG2b κ paraprotein secreted by 5TGM1 cells.37,38 Each cell also expressed the Ighv1-54 heavy chain and Igkv10-96 light chain variable region genes, establishing that they expressed the clonotypic B-cell receptor genes (Figure 1F). We also reconstructed the entire variable region gene sequence from single dormant and reactivated cells, which were identical to the parental cells (Figure 1G). Single cells were shown to express PR/SET domain 1 (Prdm1) and syndecan-1 (Sdc1), markers of plasma cells, but not naïve B-cell gene markers Fc receptor, IgE, low affinity II, α polypeptide (Fcer2a), or paired box gene 5 (Pax5) or the macrophage gene marker myeloid oncogene v-Myb (Myb; Figure 1F). These data demonstrate that only bona fide MM cells had been isolated and sequenced.
Dormant MM cells express a distinct gene signature
Comparison of the transcriptomes of dormant cells and reactivated cells identified 1492 differentially expressed genes (Figure 2A; supplemental Table 2). Gene ontology (GO) analysis revealed enrichment for biological processes involving response to interferon γ (GO:0034341; P < .0001), immune response (GO:0006955; P < .0001), and inflammatory response (GO:0006954; P < .0001) pathways in dormant cells (Figure 2B). Processes involving DNA transcription (GO:0006351; P < .01), phosphorylation (GO:0016310; P < .005), and regulation of transcription (GO:0006355; P < .005) were enriched in reactivated cells, consistent with their proliferation status (Figure 2B). Nonnegative matrix factorization analysis39 revealed that the cells clustered into 3 distinct groups: 2 dormant cell clusters (C1 and C2) and a single reactivated cell cluster (C3; Figure 2C-E; supplemental Figure 1C). The C1 metagene was enriched with genes associated with interferon signaling (116 of 168 genes in the interferome v2.01 database40 ) and the myeloid lineage (Figure 2F; supplemental Figure 3; supplemental Table 3). Approximately 15% of genes are under the transcriptional control of Irf7 and Spic (Figure 2G). Thus, dormant MM cells expressed a distinct transcriptome signature characterized by immune-response genes and genes associated with myeloid cell differentiation.
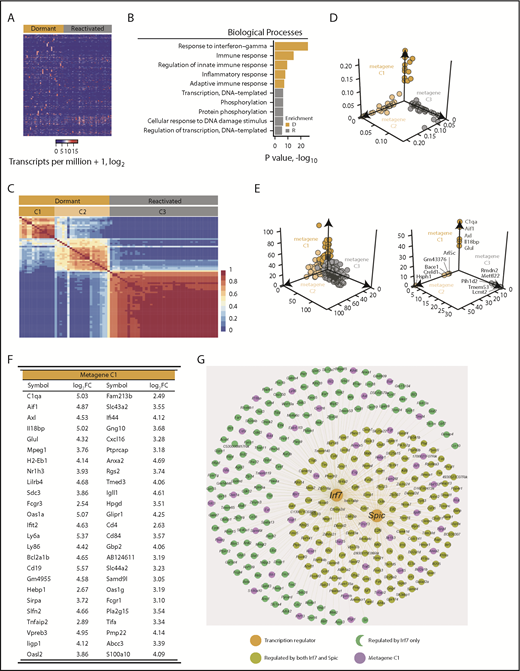
Dormant myeloma cells express a distinct gene signature. scRNAseq analysis of eGFP+DiDhi dormant and eGFP+DiDneg reactivated cell populations using SMART-seq. (A) Heatmap of 1492 differentially expressed genes between dormant and reactivated cells. (B) Biological processes associated with the genes upregulated in dormant (D; gold) and upregulated in reactivated (R; gray) populations. (C) Consensus matrix of nonnegative matrix factorization analysis of 1492 differentially expressed genes between dormant and reactivated cells defines 2 dormant (gold; C1 and C2) and 1 reactivated (gray; C3) cluster. (D) Distribution of individual cell sample contributions to each of the 3 metagenes. (E) Distribution of all the genes (top) and the top 5 unique genes (bottom) contributing to each metagene. (F) Top 50 genes from the primary (C1) dormant metagene sorted by descending contribution. (G) Genes predicted to be controlled by the Irf7 and Spic transcription factors.
Dormant myeloma cells express a distinct gene signature. scRNAseq analysis of eGFP+DiDhi dormant and eGFP+DiDneg reactivated cell populations using SMART-seq. (A) Heatmap of 1492 differentially expressed genes between dormant and reactivated cells. (B) Biological processes associated with the genes upregulated in dormant (D; gold) and upregulated in reactivated (R; gray) populations. (C) Consensus matrix of nonnegative matrix factorization analysis of 1492 differentially expressed genes between dormant and reactivated cells defines 2 dormant (gold; C1 and C2) and 1 reactivated (gray; C3) cluster. (D) Distribution of individual cell sample contributions to each of the 3 metagenes. (E) Distribution of all the genes (top) and the top 5 unique genes (bottom) contributing to each metagene. (F) Top 50 genes from the primary (C1) dormant metagene sorted by descending contribution. (G) Genes predicted to be controlled by the Irf7 and Spic transcription factors.
Dormant MM cells express a myeloid transcriptome signature
MARS-seq on a larger data set validated the dormant cell transcriptome signature. We profiled 1067 eGFP+ cells, including 319 eGFP+DiDhi dormant cells. t-distributed stochastic neighbor embedding partitioned the MARS-seq data into 3 clusters. C0 and C1 contained eGFP+DiDneg reactivated cells and a limited number of eGFP+DiDhi cells. This reflects the inclusion of eGFP+DiDhi cells that were recently reactivated but had not yet diluted all their label. C2 contained only eGFP+DiDhi cells, demonstrating this was the primary dormant cell cluster (Figure 3A-B). A total of 602 genes were differentially expressed between cells in C2 and C0 and C1. Functional annotation revealed cell cycle and DNA replication processes were enriched in C0 and C1 (P < .001), suggesting they were reactivated cells. In contrast, C2 was enriched for processes, including immune system processes (GO:0002376; P < .0001), innate immune response (GO:0045087; P < .0001), and response to interferon γ (GO:0034341; P < .005; Figure 3C). Nineteen of the top 20 C2 genes were also identified by SMART-seq. This included genes associated with myeloid cell differentiation, including the transcription factors Irf7 and Spic (Figure 2G), and the adhesion molecules and receptors Axl, Fcer1g, Mpeg1, Sirpa, and Vcam1 (Figure 3D). These are characteristic features of myeloid and macrophage lineage cells.41-44 To verify markers, we isolated CD138+eGFP+DiDhi dormant cells and CD138+eGFP+DiDneg reactivated cells for flow cytometric analysis. Surface expression of AXL, FCER1G, CSF1R, and SIRPA proteins were all upregulated in CD138+eGFP+DiDhi dormant cells (Figure 3E). These approaches demonstrate that dormant MM cells express a suite of genes associated with myeloid cell differentiation, which is downregulated as cells are reactivated and transition to active growth.
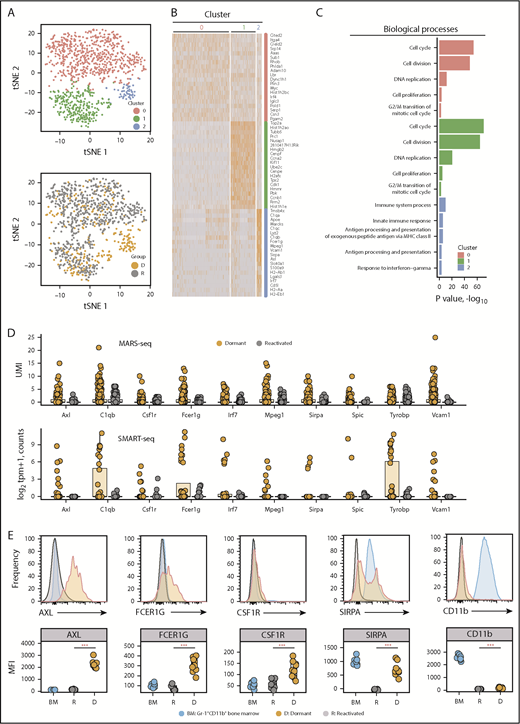
Dormant myeloma cells express a myeloid transcriptome signature. scRNAseq analysis of eGFP+DiDhi dormant and eGFP+DiDneg reactivated cell populations using MARS-seq. (A) t-distributed stochastic neighbor embedding (t-SNE) plots of the MARS-seq analysis of 1067 single myeloma cells identifies 3 distinct clusters (0, 1, and 2) (top) and maps eGFP+DiDhi dormant cells to cluster 2 (gold; D) and eGFP+DiDneg reactivated cells to C0 and C1 (gray, R) (bottom). (B) Heatmap of the top 20 genes contributing to each cluster (red, 0; green, 1; and blue, 2). (C) Database for Annotation, Visualization and Integrated Discovery functional annotation of the top 5 biological processes associated with each cluster. (D) Transcript profile of 10 common genes identified by MARS-seq (top) and SMART-seq (bottom) workflows for individual dormant (gold) and reactivated (gray) cells. Horizontal lines are the median; box indicates the IQR. (E) Histograms of expression of myeloid markers (top) and quantitation of mean fluorescent intensity of expression (MFI; bottom) of Gr1+CD11b+ bone marrow (BM), eGFP+DiDhi dormant, and eGFP+DiDneg reactivated cells. Mann-Whitney test: ***P < .001. UMI, unique molecular identifier.
Dormant myeloma cells express a myeloid transcriptome signature. scRNAseq analysis of eGFP+DiDhi dormant and eGFP+DiDneg reactivated cell populations using MARS-seq. (A) t-distributed stochastic neighbor embedding (t-SNE) plots of the MARS-seq analysis of 1067 single myeloma cells identifies 3 distinct clusters (0, 1, and 2) (top) and maps eGFP+DiDhi dormant cells to cluster 2 (gold; D) and eGFP+DiDneg reactivated cells to C0 and C1 (gray, R) (bottom). (B) Heatmap of the top 20 genes contributing to each cluster (red, 0; green, 1; and blue, 2). (C) Database for Annotation, Visualization and Integrated Discovery functional annotation of the top 5 biological processes associated with each cluster. (D) Transcript profile of 10 common genes identified by MARS-seq (top) and SMART-seq (bottom) workflows for individual dormant (gold) and reactivated (gray) cells. Horizontal lines are the median; box indicates the IQR. (E) Histograms of expression of myeloid markers (top) and quantitation of mean fluorescent intensity of expression (MFI; bottom) of Gr1+CD11b+ bone marrow (BM), eGFP+DiDhi dormant, and eGFP+DiDneg reactivated cells. Mann-Whitney test: ***P < .001. UMI, unique molecular identifier.
Dormant myeloid transcriptome signature originates from donor MM cells and not host-derived myeloid cells
The expression of myeloid genes in dormant cells raised the possibility that either host macrophages had engulfed dormant MM cells, that MM cells had engulfed host myeloid cells (cancer cell cannibalism45 ), or that the MM cells had fused with myeloid cells to create hybrid host-cancer cells.46 We reasoned that an MM cell that had been phagocytosed by a macrophage would not proliferate. To investigate this, we isolated eGFP+DiDhi dormant cells and eGFP+DiDneg reactivated cells, stained them for myeloid cell surface markers, and index sorted single cells into the individual wells of a 96-well plate to evaluate their growth potential (Figure 4A). On day 0, all cells expressed eGFP, and eGFP+DiDhi dormant cells retained the DiD label (Figure 4B). Evaluation of 1161 individual cells from 3 experiments demonstrated the development of eGFP+ colonies from both eGFP+DiDhi dormant cells and eGFP+DiDneg reactivated cells (Figure 4B-C). Expression of AXL, SIRPA, and FCER1G was similar between cells that had formed colonies and those that had not (Figure 4D). These data confirm that dormant cells could form colonies, arguing they had not been engulfed by macrophages.
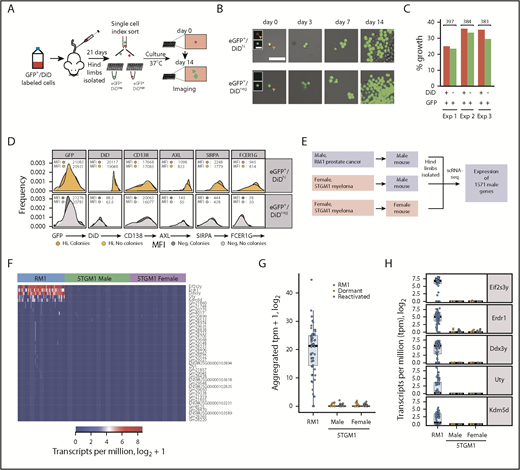
Myeloid gene signature originates from donor myeloma cells and not host myeloid cells. (A) Experimental workflow to examine the proliferative potential of dormant myeloma cells. eGFP+DiD+ 5TGM1 cells were injected IV into BKAL mice. Hind limbs were isolated, and eGFP+DiDhi and eGFP+DiDneg cells were index sorted into individual wells of 96-well plates. Plates were cultured and imaged over 14 days. (B) Representative images of individual eGFP+ cells isolated from eGFP+DiDhi (top) and GFP+DiDneg (bottom) cell populations at day 0 through day 14. Inset images show eGFP and DiD channels separately. Scale bar = 50 µm; inset scale bar = 20 µm. (C) Histogram showing the proportion of wells containing eGFP+ colonies after 14 days from 3 independent experiments. Red bars represent dormant MM cells; green bars represent reactivated MM cells. Numbers are individual cells evaluated from each experiment. (D) Histograms of the aggregated expression of myeloma cells and myeloid markers from index-sorted dormant (gold) and reactivated (gray) cells that formed colonies or those that did not. (E) Schematic workflow for the analysis of expression of 1571 Y-chromosome (chrY) genes from RM1 (positive control) and 5TGM1 scRNAseq data from cells isolated from male and female mice. (F) Heatmap of the top 41 chrY genes detected from raw unfiltered counts from RM1 cells (blue) and 5TGM1 cells isolated from male (green) and female (purple) mice. (G) Aggregated raw unfiltered counts of 41 chrY genes in RM1 single cells isolated from male mice and 5TGM1 single cells isolated from male and female mice. (H) Transcript profile of the top 5 chrY genes from raw unfiltered counts in RM1 single cells and 5TGM1 single cells isolated from male and female mice.
Myeloid gene signature originates from donor myeloma cells and not host myeloid cells. (A) Experimental workflow to examine the proliferative potential of dormant myeloma cells. eGFP+DiD+ 5TGM1 cells were injected IV into BKAL mice. Hind limbs were isolated, and eGFP+DiDhi and eGFP+DiDneg cells were index sorted into individual wells of 96-well plates. Plates were cultured and imaged over 14 days. (B) Representative images of individual eGFP+ cells isolated from eGFP+DiDhi (top) and GFP+DiDneg (bottom) cell populations at day 0 through day 14. Inset images show eGFP and DiD channels separately. Scale bar = 50 µm; inset scale bar = 20 µm. (C) Histogram showing the proportion of wells containing eGFP+ colonies after 14 days from 3 independent experiments. Red bars represent dormant MM cells; green bars represent reactivated MM cells. Numbers are individual cells evaluated from each experiment. (D) Histograms of the aggregated expression of myeloma cells and myeloid markers from index-sorted dormant (gold) and reactivated (gray) cells that formed colonies or those that did not. (E) Schematic workflow for the analysis of expression of 1571 Y-chromosome (chrY) genes from RM1 (positive control) and 5TGM1 scRNAseq data from cells isolated from male and female mice. (F) Heatmap of the top 41 chrY genes detected from raw unfiltered counts from RM1 cells (blue) and 5TGM1 cells isolated from male (green) and female (purple) mice. (G) Aggregated raw unfiltered counts of 41 chrY genes in RM1 single cells isolated from male mice and 5TGM1 single cells isolated from male and female mice. (H) Transcript profile of the top 5 chrY genes from raw unfiltered counts in RM1 single cells and 5TGM1 single cells isolated from male and female mice.
To determine whether the myeloid signature could arise from the fusion with host cells, we exploited the knowledge that the 5TGM1 cells were derived from a female mouse.47 We injected DiD-labeled 5TGM1eGFP cells into male and female mice and performed scRNAseq of dormant and reactivated cells (Figure 4E). We then analyzed expression of 1571 Y-chromosome genes. Analysis of positive control cells (RM1 prostate cells) revealed expression of Y-chromosome genes (Figure 4E-H). In contrast, neither dormant nor reactivated MM cells, isolated from either female or male mice, expressed any of the 1571 Y-chromosome transcripts (Figure 4F-H). These data confirm that MM cells, and not host cells, are the source of the myeloid transcriptome signature.
Niche-dependent induction of myeloid genes in dormant MM cells
We next determined whether the myeloid signature genes were induced after engagement with the dormant cell niche. Intravital 2-photon microscopy and immunohistochemistry showed that single dormant MM cells resided adjacent to the endosteal bone (Figure 5A-B).4 This is covered by differentiated cells of the osteoblast lineage. We therefore examined whether osteoblast lineage cells could induce expression of myeloid transcriptome signature genes. After 3 days of coculture with MC3T3 cells, the expression of Axl, Mpeg1, Sirpa, and Csf1r was upregulated in 5TGM1eGFP cells (Figure 5C). Expression of AXL was confirmed by flow cytometric analysis (Figure 5D). This was not observed when cells were cultured with media conditioned by osteoblasts or separated by a transwell (Figure 5E). RNAseq analysis showed that 1156 genes were upregulated and 1 gene was downregulated by coculture (Figure 5F). Osteoblasts expressed the binding partners for key dormancy signature genes, including Gas6 and α4β1; however, there were no statistically significant differentially expressed genes (Figure 5G). Together, these observations suggest that endosteal niche cells are able to induce contact-dependent upregulation of myeloid transcriptome signature genes in MM cells to induce dormancy.
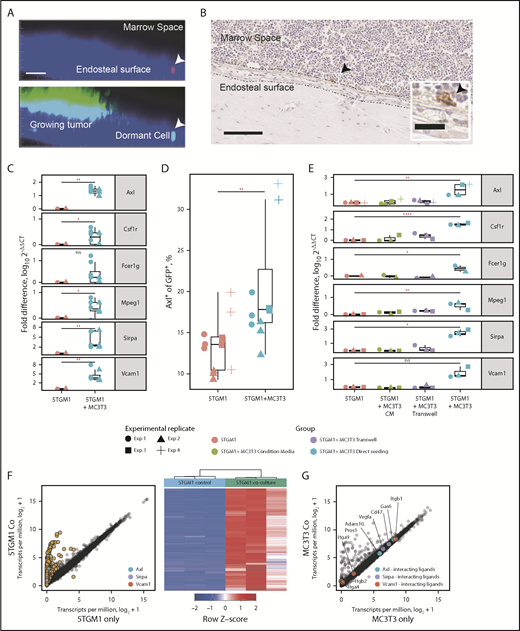
Niche-dependent induction of the myeloid gene signature. (A) Intravital imaging of a dormant MM cell (arrow) residing on the endosteal surface and a growing MM colony. Top shows the DiD (red) channel, and bottom shows the eGFP (green) channel. Scale bar = 50 µm. (B) Immunohistochemical staining for CD138 showing an individual 5TGM1 tumor cell (arrow) adjacent to the endosteal bone surface. Scale bar = 50 µm; inset scale bar = 20 µm. (C) Real-time quantitative polymerase chain reaction (RT-qPCR) of myeloid marker genes from 5TGM1 cells cultured with and without MC3T3 cells. (D) Flow cytometric analysis of AXL expression by 5TGM1 cells cultured with and without MC3T3 cells. Symbols denote different experimental replicates. (E) RT-qPCR of myeloid marker genes from 5TGM1 cells cultured alone, with MC3T3 conditioned media (CM), and with MC3T3 cells seeded directly or separated by a transwell. (F) Scatter plot of genes expressed by 5TGM1 cells cultured alone or with MC3T3 cells (left); heatmap of differentially expressed genes (right). (G) Scatter plot of genes expressed by MC3T3 cells cultured alone or with 5TGM1 cells. (C-E) Each point represents an independent experiment. Horizontal lines are the median; box indicates the IQR. Mann-Whitney test: *P < .05, **P < .01, ****P < .0001. ns, not significant.
Niche-dependent induction of the myeloid gene signature. (A) Intravital imaging of a dormant MM cell (arrow) residing on the endosteal surface and a growing MM colony. Top shows the DiD (red) channel, and bottom shows the eGFP (green) channel. Scale bar = 50 µm. (B) Immunohistochemical staining for CD138 showing an individual 5TGM1 tumor cell (arrow) adjacent to the endosteal bone surface. Scale bar = 50 µm; inset scale bar = 20 µm. (C) Real-time quantitative polymerase chain reaction (RT-qPCR) of myeloid marker genes from 5TGM1 cells cultured with and without MC3T3 cells. (D) Flow cytometric analysis of AXL expression by 5TGM1 cells cultured with and without MC3T3 cells. Symbols denote different experimental replicates. (E) RT-qPCR of myeloid marker genes from 5TGM1 cells cultured alone, with MC3T3 conditioned media (CM), and with MC3T3 cells seeded directly or separated by a transwell. (F) Scatter plot of genes expressed by 5TGM1 cells cultured alone or with MC3T3 cells (left); heatmap of differentially expressed genes (right). (G) Scatter plot of genes expressed by MC3T3 cells cultured alone or with 5TGM1 cells. (C-E) Each point represents an independent experiment. Horizontal lines are the median; box indicates the IQR. Mann-Whitney test: *P < .05, **P < .01, ****P < .0001. ns, not significant.
AXL inhibition releases MM cells from dormancy
One of the most highly upregulated genes in dormant cells was Axl, which was selected for proof-of-concept functional analysis. To inhibit AXL, we used 2 inhibitors: cabozantinib and BMS-777607. Cabozantinib inhibits receptor tyrosine kinases, including AXL, c-MET, and VEGF (Figure 6A).48 With the exception of Axl and Flt3, the targets of cabozantinib were not expressed by dormant or reactivated cells (Figure 6A). Cabozantinib treatment decreased eGFP+DiDhi dormant cells and increased eGFP+DiDneg MM cells, suggesting that inactivation of AXL released cells from dormancy and allowed MM cells to proliferate (Figure 6B). Importantly, the reduction in numbers of dormant cells was consistent with the number of tumor colonies required to explain the increase in tumor burden.4 In the spleen, cabozantinib treatment had no effect on dormant cell numbers and only slightly increased MM burden (Figure 6C). To verify this, we evaluated the effect of BMS-777607, an inhibitor with greater affinity for AXL and more limited activity against other tyrosine kinases, none of which were expressed by dormant cells49 (Figure 6D). BMS-777607 treatment also reduced eGFP+DiDhi dormant cells and increased eGFP+DiDneg MM cell burden in the bone marrow but not the spleen (Figure 6E-F). Given that osteoclastic resorption releases MM cells from dormancy,4 we determined whether BMS-777607 could increase osteoclasts and release dormant cells indirectly. BMS-777607 treatment of naive mice had no effect on osteoclast numbers, the bone surface occupied by osteoclasts, or the endosteal bone surface where dormant cells reside (Figure 6G-I), suggesting this was not an off-target effect. Together, this suggests that AXL, as a prototypical dormancy gene, is able to control retention of MM cells in a dormant state and that AXL inhibition releases dormant cells from the endosteal niche, causing reactivation and MM growth.
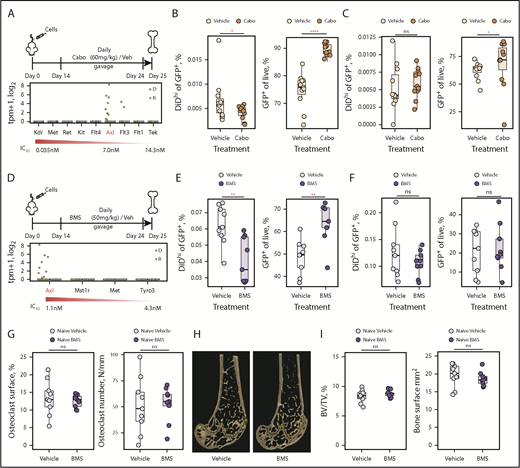
Inhibiting AXL releases myeloma cells from dormancy. (A) Experimental design investigating carbozantinib (cabo) treatment on dormant myeloma cells (top) and transcript expression levels of cabo targets in dormant (D) and reactivated (R) cells (bottom). (B) Impact of cabo treatment on dormant cells (left) and myeloma burden (right) in the bone marrow. (C) Impact of cabo treatment on dormant cells (left) and myeloma burden (right) in the spleen. (D) Experimental design investigating BMS-777607 (BMS) treatment on dormant myeloma cells (top) and transcript expression levels of BMS targets in dormant (D) and reactivated (R) cells (bottom). (E) Impact of BMS treatment on dormant cells (left) and myeloma burden (right) in the bone marrow. (F) Impact of BMS treatment on dormant cells (left) and myeloma burden (right) in the spleen. (G) Impact of BMS and vehicle treatment on osteoclast surface (%) (left) and number (per mm) (right). Individual points represent a single mouse. (H) Three-dimensional micro computed tomography reconstructions of distal femora from representative mice treated with BMS or vehicle. (I) Impact of BMS and vehicle treatment on trabecular bone volume/total volume (BV/TV; %) (left) and the bone surface (mm2) (right). Data represented by median and IQR. Mann-Whitney test: *P < .05, **P < .01, ****P < .001. IC50, half maximal inhibitory concentration; ns, not significant.
Inhibiting AXL releases myeloma cells from dormancy. (A) Experimental design investigating carbozantinib (cabo) treatment on dormant myeloma cells (top) and transcript expression levels of cabo targets in dormant (D) and reactivated (R) cells (bottom). (B) Impact of cabo treatment on dormant cells (left) and myeloma burden (right) in the bone marrow. (C) Impact of cabo treatment on dormant cells (left) and myeloma burden (right) in the spleen. (D) Experimental design investigating BMS-777607 (BMS) treatment on dormant myeloma cells (top) and transcript expression levels of BMS targets in dormant (D) and reactivated (R) cells (bottom). (E) Impact of BMS treatment on dormant cells (left) and myeloma burden (right) in the bone marrow. (F) Impact of BMS treatment on dormant cells (left) and myeloma burden (right) in the spleen. (G) Impact of BMS and vehicle treatment on osteoclast surface (%) (left) and number (per mm) (right). Individual points represent a single mouse. (H) Three-dimensional micro computed tomography reconstructions of distal femora from representative mice treated with BMS or vehicle. (I) Impact of BMS and vehicle treatment on trabecular bone volume/total volume (BV/TV; %) (left) and the bone surface (mm2) (right). Data represented by median and IQR. Mann-Whitney test: *P < .05, **P < .01, ****P < .001. IC50, half maximal inhibitory concentration; ns, not significant.
AXL is expressed by human bone marrow plasma cells and MM cells
We next investigated candidate dormancy genes AXL, CSF1R, FCER1G, SIRPA, and VCAM1 in healthy donors and patients with MM (Figure 7A; supplemental Figure 4). AXL is expressed in normal CD138+ bone marrow plasma cells. In malignant diseases, AXL is also expressed, with higher expression in plasma cells from patients with MGUS than in plasma cells from those with overt or relapsed MM. AXL is not expressed in memory B cells, in vitro–generated polyclonal plasmablasts, or human MM cell lines. In the bone marrow microenvironment, AXL is expressed in mesenchymal cells and osteoblasts only (Figure 7A). Similar patterns of expression were observed for other myeloid dormancy signature genes (supplemental Figure 4). We next showed that a small subpopulation of CD138+CD38+ plasma cells expressed AXL (Figure 7B). The proportion of AXL+ cells was higher in patients with MGUS than those with MM or relapsed MM, and there was an inverse correlation between disease burden and the frequency of AXL+ cells (rs2 = −0.689; P < .001; Figure 7B). This indicates that AXL and proteins encoded by myeloid dormancy signature genes may identify a subpopulation of dormant human MM cells.
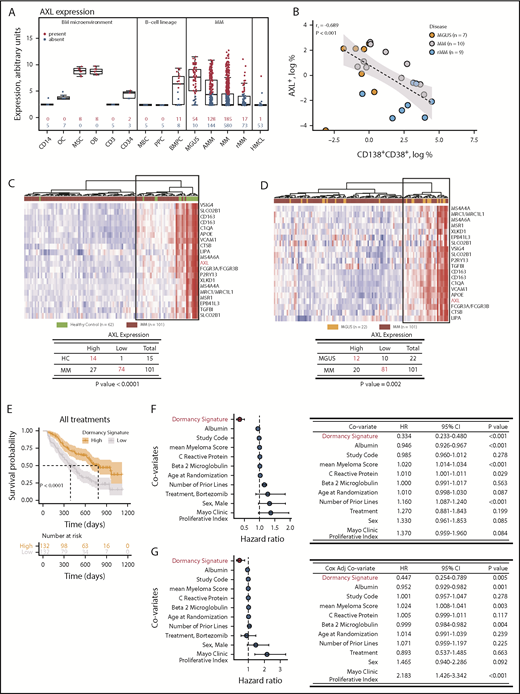
Myeloid transcriptome signature predicts disease progression. (A) Gene expression profiling of isolated bone marrow (BM) cells, CD14+ monocytes (CD14), osteoclasts (OCs), mesenchymal stromal cells (MSCs), osteoblasts (OBs), T cells (CD3), hematopoietic stem cells (CD34), memory B cells (MBCs), in vitro–generated polyclonal plasmablastic cells (PPCs), BM plasma cells (BMPCs), and CD138+ cells from patients with MGUS, asymptomatic MM (AMM), MM, and relapsed MM (rMM). Blue represents the absence of expression; red represents expression according to the presence-absence calls with negative probesets algorithm. Data represented by box and whisker plots. (B) Relationship between expression of AXL and CD138+CD38+ determined by flow cytometry for plasma cells isolated from patients with MGUS, MM, and rMM. (C) AXL nearest-neighbor analysis of CD138+ plasma cells in healthy controls (HC; green) and patients with MM (brown) from the Mayo Clinic microarray data set. Heatmap of 20 genes coexpressed with AXL in HC compared with MM (top) and the χ2 test of the association of AXL expression in HC vs MM (bottom). (D) AXL nearest-neighbor analysis of CD138+ plasma cells in MGUS (orange) and MM (brown) from Mayo clinic microarray data set. Heatmap of 20 genes coexpressed with AXL in MGUS compared with MM (top) and the χ2 test of the association of AXL expression in MGUS vs MM (bottom). (E) Kaplan-Meier analysis of dormancy signature genes and overall survival in the Millennium clinical trial microarray data set. (F) Univariate Cox regression analysis of the dormancy gene signature (red) and disease biomarkers. Forest plot of the HRs and 95% CIs (left) and summary table (right). (G) Cox-adjusted analysis of the dormancy gene signature (red) and disease biomarkers. Forest plot of the HRs and 95% CIs (left) and summary table (right).
Myeloid transcriptome signature predicts disease progression. (A) Gene expression profiling of isolated bone marrow (BM) cells, CD14+ monocytes (CD14), osteoclasts (OCs), mesenchymal stromal cells (MSCs), osteoblasts (OBs), T cells (CD3), hematopoietic stem cells (CD34), memory B cells (MBCs), in vitro–generated polyclonal plasmablastic cells (PPCs), BM plasma cells (BMPCs), and CD138+ cells from patients with MGUS, asymptomatic MM (AMM), MM, and relapsed MM (rMM). Blue represents the absence of expression; red represents expression according to the presence-absence calls with negative probesets algorithm. Data represented by box and whisker plots. (B) Relationship between expression of AXL and CD138+CD38+ determined by flow cytometry for plasma cells isolated from patients with MGUS, MM, and rMM. (C) AXL nearest-neighbor analysis of CD138+ plasma cells in healthy controls (HC; green) and patients with MM (brown) from the Mayo Clinic microarray data set. Heatmap of 20 genes coexpressed with AXL in HC compared with MM (top) and the χ2 test of the association of AXL expression in HC vs MM (bottom). (D) AXL nearest-neighbor analysis of CD138+ plasma cells in MGUS (orange) and MM (brown) from Mayo clinic microarray data set. Heatmap of 20 genes coexpressed with AXL in MGUS compared with MM (top) and the χ2 test of the association of AXL expression in MGUS vs MM (bottom). (E) Kaplan-Meier analysis of dormancy signature genes and overall survival in the Millennium clinical trial microarray data set. (F) Univariate Cox regression analysis of the dormancy gene signature (red) and disease biomarkers. Forest plot of the HRs and 95% CIs (left) and summary table (right). (G) Cox-adjusted analysis of the dormancy gene signature (red) and disease biomarkers. Forest plot of the HRs and 95% CIs (left) and summary table (right).
Dormant myeloid transcriptome signature genes may be associated with survival
To determine the role of AXL as an exemplar dormant signature gene in disease evolution, we used nearest-neighbor analysis to identify AXL-coregulated genes (Figure 7C). Hierarchical clustering showed that expression of AXL-coregulated genes could discriminate controls and patients with MGUS from patients with MM (Figure 7C-D). This suggests that AXL and coregulated genes play an important role in MM.
Finally, we analyzed expression of dormant MM cell signature genes in the transcriptome of plasma cells from a clinical trial in which patients were treated with dexamethasone or bortezomib.34 Median survival was increased by almost twofold in patients with high expression of the dormant cell transcriptome signature, when compared with patients with low expression of signature genes (392 vs 723 days; P < .0001; Figure 7E). This was independent of treatment and not observed with the reactivated cell transcriptome signature (supplemental Figure 5A). This was validated in an independent data set (Figure 5B),32,35,36 where overall survival increased from 77 months in patients with low expression of the dormancy gene signature to 111 months in patients with high expression of the signature (P = .00057; supplemental Figure 5A). Event-free survival was also greater with high signature expression (P = .0048; supplemental Figure 5B). Univariate and multivariate Cox regression analyses of clinical covariates demonstrated the dormancy signature score was a prognostic marker (HR, 0.33; 95% CI, 0.23-0.48; P < .001 and HR, 0.44; 95% CI, 0.25-0.79; P = .005, respectively; Figure 7F-G). The replication of the prognostic value of the dormancy transcriptome signature in 2 independent randomized controlled trials makes it unlikely that this was a false-positive signal. Nevertheless, we also examined the MMRF CoMMpass data repository. This is a prospective, longitudinal, observational study involving patients receiving different treatments. Genes in the dormancy signature were detected in patients in the CoMMpass data set (supplemental Figure 6). However, when patients were stratified based on high or low expression of the dormancy signature, there was no statistically significant difference in overall survival (supplemental Figure 6). This could be due to the fact that patients and treatments are heterogeneous, unlike in the gold-standard randomized controlled trials. However, collectively, this suggests that the dormant MM cell transcriptome signature maybe a marker of disease progression and overall survival.
Discussion
In this study, we defined a dormant MM cell transcriptome signature, a catalog of genes that are expressed by dormant MM cells but switched off when they are reactivated and transition to actively growing MM. The transcriptome signature was enriched for genes expressed by myeloid cells and included the transcription factors Irf7 and Spic, which are predicted to control ∼15% of signature genes, including the exemplar genes Axl, Vcam1, and Sirpa. Inhibition of AXL reduced dormant cells and increased MM burden, showing these genes are functionally important. The absence of effects in the spleen argues that dormancy control pathways may be under bone niche–specific regulation.
In MM, cells of the osteoblast lineage play an important role in the dormant cell niche.4,5,13 These cells retain both murine and human myeloma cells in a dormant state, and release from osteoblast niche control allows them to proliferate to form myeloma colonies.4,5,13 Culturing MM cells with osteoblast lineage cells induced expression of dormancy genes in a contact-dependent manner. This argues that engagement with the endosteal niche switches on expression of myeloid genes to control dormancy. In support of this, osteoblasts express GAS6, the ligand for AXL, and prostate cancer cells, which disseminate to the same endosteal niche, also express AXL and, through binding GAS6 on osteoblasts, enter dormancy.50 Myeloid progenitor cells also reside in the endosteal niche,51 and the AXL-GAS6 axis controls the survival and self-renewal capacity of chronic myeloid leukemia stem cells.52 Irf7 and interferon signaling also control breast cancer metastasis in bone.53 Together, these data suggest that it is the endosteal niche that regulates a repertoire of myeloid genes in myeloma cells that control cellular dormancy.
Inhibition of AXL in solid cancers decreases tumor burden, particularly in combination with conventional treatments.54-56 Although the mechanism is unclear, AXL has been implicated in invasion and metastasis.57 However, the present study suggests that AXL inhibition releases cells from dormancy and sensitizes them to chemotherapy, providing an alternative mechanism of action. In MM, cabozantinib showed no anti-MM activity as a single agent.58 However, in experimental models, cabozantinib combined with bortezomib showed greater efficacy than either agent alone.59 Although our data establish AXL as a regulator of MM cell dormancy, the dormancy gene signature has identified many other candidate molecules. Analysis of these molecules will likely reveal the architecture of dormancy control and additional drug targets. Furthermore, AXL acts through a range of downstream signaling pathways, the targets of which may also prove to be potential therapeutic targets.
In patients with MM, predicting who will relapse has proven challenging. This study showed that dormancy signature genes could identify subpopulations of dormant cells in patients. Using AXL as proof of concept, plasma cells in patients contained a rare subpopulation of AXL+ cells. Patients with MGUS had a greater proportion of AXL+ cells than patients with MM, whereas patients with relapsed disease had the least number of AXL+ cells. This is consistent with the AXL+ subpopulation being reactivated and playing a role in disease relapse. In support of this, expression of AXL nearest-neighbor genes distinguished MM patients from patients with MGUS. Interestingly, a subgroup of patients with MGUS clustered with patients with MM, raising the possibility that they are at high risk of progression. High expression of the dormant MM cell transcriptome signature was also associated with improved survival in some cohorts when compared with patients with low dormancy gene signature expression. Although this is consistent with evidence that proliferation is an independent prognostic factor in MM,60 unlike our single-cell data, we cannot exclude the possibility that this reflects rare contaminating myeloid cells in these data sets. Notably, the dormancy transcriptome signature was a superior predictor of disease progression than many conventional biomarkers.
In summary, this study has defined a dormant MM cell transcriptome signature, enriched with myeloid differentiation–related genes that control cellular dormancy in MM. This also revealed the importance of the endosteal niche in inducing MM cell dormancy. This dormant cell transcriptome signature provides a platform on which to build an understanding of the role of dormant cells in disease evolution and relapse and develop rationally informed therapies to eradicate these cells and prevent disease relapse.
RNA-seq data are available at SRA: PRJNA453652.
The online version of this article contains a data supplement.
The publication costs of this article were defrayed in part by page charge payment. Therefore, and solely to indicate this fact, this article is hereby marked “advertisement” in accordance with 18 USC section 1734.
Acknowledgments
The authors acknowledge the Biological Testing Facility, the Australian BioResources Centre, and the Kinghorn Cancer Centre for Clinical Genomics and thank Rob Salomon, the Garvan-Weizmann Centre for Cellular Genomics, and Nancy Anders and the Small Animal Imaging Facility.
This work was supported by Janice Gibson and the Ernest Heine Family Foundation, the National Health and Medical Research Council (NHMRC; 1139237, 1104031, and 1140996), a Kay Stubbs Cancer Research Grant, a Cancer Council New South Wales Grant, Peter and Val Duncan, the Ann Helene Toakley Charitable Endowment, the Deutsche Forschungsgemeinschaft (SFB/TRR79, TP B1, B12, M9), and the German Federal Ministry of Education (CLIOMMICS; 01ZX1609A) and (CAMPSIMM; 01ES1103). K.D.V. is a postdoctoral fellow of Fonds Wetenschappelijk Onderzoek–Vlaanderen; T.G.P. is an NHMRC Senior Research Fellow (1155678). Biospecimens were provided by the South Australian Cancer Research Biobank, which is supported by the Cancer Council SA Beat Cancer Project, Medvet Laboratories Pty Ltd, and the Government of South Australia.
Authorship
Contribution: P.I.C. and T.G.P. conceived the study; W.H.K., G.L., A.W., R.L.T., M.M.M., R.C.C., K.D.V., K.L.O., K.S.O., K. Vandyke, A. Seckinger, N.K., D.R.H., C.S., M.N., R.S.L., T.V.N., B.P., D.H., K. Vanderkerken, A.C.W.Z., I.A., P.I.C., and T.G.P. designed and performed experiments; J.R.C., S.T.M., J.A.P., Y.X., and A.P.C. performed experiments; B.O.O. and D.A. provided reagents; W.H.K., G.L., A.W., D.L.R., R.L.T., M.M.M., R.C.C., K.D.V., K.L.O., K.S.O., K. Vandyke, A. Seckinger, N.K., A.N., T.V.N., B.O.O., D.A., B.P., D.H., K. Vanderkerken, A.C.W.Z., I.A., P.I.C., and T.G.P. analyzed and interpreted data; P.I.C., T.G.P., and W.H.K. wrote the manuscript; W.H.K., G.L., A.W., A. Seckinger, B.O.O., D.A., A. Swarbrick, B.P., D.H., K. Vanderkerken, A.C.W.Z., P.I.C., and T.G.P. revised the manuscript; and all authors read and approved the manuscript.
Conflict-of-interest disclosure: D.A. is an employee of Exelixis Inc. The remaining authors declare no competing financial interests.
Correspondence: Peter I. Croucher, Garvan Institute of Medical Research, 384 Victoria St, Sydney, NSW 2010, Australia; e-mail: p.croucher@garvan.org.au; and Tri Giang Phan, Garvan Institute of Medical Research, 384 Victoria St, Sydney, NSW 2010, Australia; e-mail: t.phan@garvan.org.au.
